Corporate Presentation - 1st Quarter 2021 - Alpek

Page created by Sylvia Black
 
CONTINUE READING
Corporate Presentation - 1st Quarter 2021 - Alpek
Corporate Presentation
1st Quarter 2021
Corporate Presentation - 1st Quarter 2021 - Alpek
Index

Alpek at a Glance

Key Investment Highlights

Financials

Relevant Events

The Case for PET

Appendix
Corporate Presentation - 1st Quarter 2021 - Alpek
Alpek is a large component of ALFA’s portfolio of companies
      Alfa posted US$12.3B in Revenues & US$1.5B in EBITDA1

                                                                                                                                                                    2

                                        Petrochemicals                        Food Products                  IT + Telecom                     Aluminum Auto Parts
                  EBITDA1
                                               37%                                  45%                             20%                                   -
                  (% Alfa)

                                                                                                              8 out of 10
                                     #1 Producer of PTA,                    11 Sigma brands                                                    1 out every 4 new cars
                                                                                                       Mexican Corporates use
                                      PET, rPET, EPS &                       sell more than                                                   sold in the world has at
                                                                                                       Axtel’s IT and Telecom
                                   ARCEL® in the Americas                 US$100M a year each                                                least one Nemak product
                                                                                                               services
                                            18
                                            18%                                                               19%         53%                       25%
                                            %

                                                                                                            28%
                                                   82
                                                   82%                               100                                                                      75%
                                                   %                                  %

                                                                                           Alfa   Publicly traded          Other Privately Held
(1) Nemak has discontinued operations. Figures as of December 31, 2020
(2) ALFA´s entire share ownership in Nemak distributed to ALFA shareholders in December 2020                                                                             3
Source: Alpek
Corporate Presentation - 1st Quarter 2021 - Alpek
Alpek is one of the largest PetChems in The Americas
     Strong portfolio of resilient products across two main segments

                                                                                    Comparable                                         Net Debt /
              Revenues1:                        US$5.3B                                                       US$601M                                   2.1x
                                                                                     EBITDA1:                                      Reported EBITDA1:

                  Polyester (75% Sales)2                                                                        Plastics & Chemicals (22% Sales)2

          PTA, PET                             Polyester                          Polypropylene             Expandable Styrenics       Caprolactam     Specialty Chemicals
           & rPET                               Fibers                                 (PP)                   (EPS & ARCEL®)              (CPL)           & Fertilizers

(1) Figures for the year ended December 31, 2020;
(2) Sales revenue for the year ended December 31, 2020; additional 3% represented by other small business
                                                                                                                                                                 4
Source: Alpek
Corporate Presentation - 1st Quarter 2021 - Alpek
Our footprint now spans 31 plants across 7 countries
      Over 8.0 million tons and more than 6,200 employees worldwide
                              Installed capacity breakdown (Kta)
                                                            rPET
      Country             Site         PTA     PET   Flake Pellet   SPT   Fibers PP    EPS Arcel CPL Other
                   Monterrey                                               160
       Mexico      Altamira            1,000                                     640   240
     (3,395 Kta)   Salamanca                                                                      85   360
                   Cosoleacaque        610     185                  15
                   Lerma                                                                               100
                   Fayetteville, NC            170    55
                   Charleston, SC              170                  15     150
                   Columbia, SC        640     725
         USA       Bay St. Louis, MS           430
     (2,644 Kta)   Richmond, IN                       55
                   Darlington, SC                            30
                   Monaca, PA                                                          123   36
                   Painesville, OH                                                      45
       Canada
                   Montreal                    144
      (144 Kta)
                   Zárate                      190
     Argentina
                   Pacheco                            22     15
     (246 Kta)
                   General Lagos                                                       19
        Brazil     Guaratingueta                                                       46
     (1,226 Kta)   Ipojuca             640     450                         90
                   Santiago                                                                            5
        Chile      Puerto Montt                                                                        2     Polyester
      (28 Kta)     Punta Arenas                                                                        1
                   Concon                                                              20                    P&C
  United Kingdom
                  Wilton                       350
     (350 Kta)
       Total Capacity: 8,033 Kta       2,890 2,814   132     45     30     400   640   493   36   85   468
Kta: Thousand tons per year                                                                                    5
Source: Alpek estimates
Corporate Presentation - 1st Quarter 2021 - Alpek
Index

Alpek at a Glance

Key Investment Highlights

Financials

Relevant Events

The Case for PET

Appendix
Corporate Presentation - 1st Quarter 2021 - Alpek
Investment Highlights

         1   Market leadership across all our products in the Americas

             2        Consumer-oriented product portfolio limits demand volatility

                  3    Proven track record of growth across all parts of the cycle

                  4     State-of-the-art technology resulting in low-cost position

              5       Clear strategy & catalysts executed by experienced management team

         6   Portfolio uniquely placed to lead growth of circular economy
Corporate Presentation - 1st Quarter 2021 - Alpek
11. Market Leadership

      Alpek holds leading industry positions for all its products

                        Polyester Industry Position1 by Product                                                                   P&C Industry Position1 by Product

                                    PTA                         1          The Americas                                                       PP              1   Mexico

                                                                1          The Americas
                                                                                                                                    Expandable
                                                                                                                                                              1   The Americas
                                   PET
                                                                                                                                     Styrenics
                                                                2          Worldwide                                                                          3   Worldwide

                                  rPET                          1          The Americas                                                     CPL               1   Mexico

                                   PSF2                         2          The Americas

(1) Industry position is based on installed capacity and reflects market position as of December 31, 2020. (2) Polyester Staple Fiber (excluding filaments)
                                                                                                                                                                                 8
Source: PCI and Alpek estimates
Corporate Presentation - 1st Quarter 2021 - Alpek
11. Market Leadership

      Alpek is the largest PTA-PET producer in Americas
      Market has consolidated & become increasingly organized over time

                The Americas PTA Capacity Share (%)           The Americas PET Capacity Share (%)

                                          7,240                                        6,781
                  Kta                      9%      Others     Kta                       7%      Others
                        6,190                                               5,681       8%
                                  5,940                             5,494                       M&G
                        14%                19%     BP                       8%          11%     FENC
                                                                    16%     10%
                                  24%                                       6%
                        23%
                                           25%     Indorama         27%                 33%     Indorama
                                  24%                                       32%
                        27%
                                                                    24%

                                           46%                                          42%
                                  49%                                       43%
                        36%                                         34%

                        2015      2020    2025E1                    2015    2020       2025E1

(1) Includes
Kta:  Thousands
             CC Polymers
                tons per year                                                                          9
Source: Alpek
         Wood &Mackenzie
                 Wood Mackenzie
Corporate Presentation - 1st Quarter 2021 - Alpek
21. Consumer Oriented Portfolio

      Resilient end-markets account for 92% of volume
      97% of Alpek’s sales are dollar-based

                                  Volume by Industry 20201                                          Sales Geography 20201
                                     Textiles 4% Construction 4%                                            EUR 6% Asia 0.4%
                                                                     92%
                                                                                                                               71%
                                                                                                  SA 22%
             Consumer Goods 25%                                                                                                   USA/CAN 42%
                                               Volume 2020                                                        Sales 2020
                                                4,802 Kta                                                         US$5,326 M

                                                                    Food & Beverage 67%

                                                                                                        MEX 29%

                                                                                Sample End Users by Industry
                                              Beverage                             Food           Personal Care                Textiles

(1) Volume and sales breakdown for data for the year ended December 31, 2020.
                                                                                                                                                10
Kta: Thousand tons per year
Source: Alpek
31. Proven Growth

      Alpek has continued growing at 8.6% CAGR since 1986
      Constant growth at different points of the industry cycle

                                                           Sales Volume 1986-2020 (Index: 1986 = 100)

                                                                                                                                                                          PET
                                                                                                                                                                       acquisition
                                                                                                                                                                         in UK
                                                                                                                                                         Polyester
                                                                                                                                                        acquisition                     Corpus Christi
                                                                                                                                 IPO (BMV)
                                                                                                             U.S. PTA/                                   in Brazil                      Polymers (JV)
                                                                                                             PET plant
                                                                                                            acquisitions
                                                                                                                                                                               Styrenics
                                                                                                                                                                rPET
                                                                                                   EPS                                                                        Acquisition
                                                                                                                                                              Acquisition
                                                                                                 capacity                                                                       in USA
                                                                                                                                                               in USA
                                                                                                expansion                                 First power
                                                                             First U.S.
                                                                                                   (JV)                                  cogeneration
                                                                             polyester
                                                                               plant                                                         plant
                                                                            acquisition                                First
                                                                                                                    recycling
                                                                                                                    plant (JV)
                                                        CPL plant
                                                        acquisition

                                Acquisition
                                of first PTA
                                    plant
                      DMT
                    Expansion

                                                 PP plant
                                               start-up (JV)

                       ´86                       ´93                  ´98                 ´03               ´08                         ´13                           ´18       ´20 ´25
                                                                                                                                                                                                    11
Source: Alpek
41. Low-Cost Position

      State-of-the-art tech, strategically located assets & low-cost
      logistics yield low-cost position in industry

        Continuous investment in own technology has                                          World scale production facilities make Alpek the
        improved Alpek’s cost position (i.e. IntegRex)                                        low-cost producer in The Americas (i.e. PP)
                             Steps eliminated with IntegRex®

                                                                            Precursor 
             Oxidation             Feed prep              Esterification
                                                                            Preheating

                                                                                               Margin
                                             
          Post-Oxidation         Hydrogenation                 Pre-Poly    Crystallization

                                                                                       
           Crystallization       Crystallization         Polymerization      Annealing
                                                                                                                            80% of Market
           Filtration and       Filtration and                              Solid State                                    Participants
                                                          Pelletization
               Drying                Drying                                Polymerization

                                                         Precursor 
           CTA Storage           PTA Storage                                 PET Resin
                                                           Storage
                                                                                                                     Cost

                                                                                                                                            12
Source: Alpek, Philip Townsend
51. Strategy & Mgmt. Team

      Long-term strategy is based around 3 key pillars

                                                         13
51. Strategy & Mgmt. Team

      Mgmt. with 30+ years average experience in PetChem
      Clear strategy & culture of empowerment ensure efficient operations

                                                                             José de Jesús Valdez
                                                                                   CEO (45)

                                                  José Carlos Pons
                                                      CFO (25)

                   Felipe Garza           Jorge Young            Gustavo Talancón           Alejandro Llovera     José Luis Zepeda       Gustavo Talancón
                   Co-President           Co-President                President                  President            President           President CPL &
                Alpek Polyester (44)   Alpek Polyester (31)     Polyester Filament (32)     Polypropylene (36)   EPS & Chemicals (35)   Ammonium Sulfate (32)

                                            Polyester                                                            Plastics & Chemicals

(#) Years with Alfa/Alpek                                                                                                                                 14
Source: Alpek
61. Portfolio prepared to lead in circular economy

      Our strong innovation efforts are focused on circular
      economy initiatives and process improvements

                                                        In-house    • Process simplification & cost reduction to Integrex
                                                      Innovation      PTA/PET production process
                                                     (Examples)
                                                                    • Organic fertilizer production from bio-mass organisms
                                                                    • Chemical recycling processes from PET back to BHET &
                                                                      MEG and EPS back to Styrene

                                                           Open     • Structured collaboration with start-ups to identify and
                                                     Innovation       monetize innovation trends related to our business
                                                       Initiative
                                                                    • Extended reach beyond in-house innovation
                                                                    • Reduced time-to-market for new products
                                                                    • Increased efficiency of R&D capital allocation

                                                                                                                                15
61. Portfolio prepared to lead in circular economy

       Alpek strives to continue improving its ESG performance
       Reaffirmed commitment to ESG by joining UN Global Compact                                                           in 2021

                           CDP ESG Ratings                                Sustainalytics ESG Ratings                                  CSA Ratings

                                               2019             2020                                                  54             2019       2020
                                                                                                  Risk
                                                               B-                    39     32
                                                                                                  Rating                                  43        44
                                 C                                                                                              35
                                                                                                                 31        32                  30
                                                                                                                                     28

                      D                                                                     68
                                                                                     61
                                                      D-

              Climate Change                           Water                        2019   2021                   Env.     Soc.      Gov.      Total
         NA                D                               B           Percentile   39      64                              Percentile ‘19      31

Chemical                   C                               B                                                                Percentile ‘20      66

                                       Company recognized by                               as     2    Best ESG in its segment
                                                                                                                                                    16
Index

Alpek at a Glance

Key Investment Highlights

Financials

Relevant Events

The Case for PET

Appendix
Recent Financial Results

                         Sales Volume (KTon)                                                                     Revenues (US$M)
                                                    4,802                                                      6,991
                               4,402      4,384                                                                        6,216
                 4,012
                                                                                                  5,231                               5,326
       P&C
                                                                                          P&C

  Polyester                                                        1,184      1,230                                                                   1,614
                                                                                      Polyester                                               1,433

                 2017          2018       2019       2020          1Q20       1Q21                2017         2018    2019           2020    1Q20    1Q21

                  Reported EBITDA (US$M)                                                                             CAPEX (US$M)
                               1,063                                                                           826
                               220         850
                                                                                                    Suape/
                         800           789 188                                                      Citepe &
                                                     565
                                                                                                    CCP
                                                  601 35
Comparable
excl. RMCF
           462                 843                                                                                      270
                                                                                                  236
                                           662                                                                                        162
                                                     530
                 384                                                       203 324                                             Nova
                                                             147                                                                               15      30
                                                                    111
                 2017          2018       2019       2020          1Q20       1Q21                2017         2018    2019           2020    1Q20    1Q21
     % Sales     7.3%          15.2%      13.7%      10.6%         14.4%      20.1%                                                                           18
Free Cash Flow Generation

   US$M
                                                                   23         2       1,219
      1,185      324                                     30
                                                 44
                                        67
                         192

                           FCF: US-9M

     Net Debt   EBITDA   NWC        Financial   Taxes   CAPEX   Dividends   Others   Net Debt
      Dec’20                        Expenses                                          Mar’21
Leverage

          Net Debt (US$M)                         LTM EBITDA (US$M)                   Net Debt/EBITDA (Times)
        1,436 1,428                                                                           2.0
                                 +3%        789                                                     2.0    2.0
1,330                                             769                                   1.9                        1.9
                      1,235
                              1,185 1,219               701                     1.7
                                                                          657
                                                              624   601

                                            850   821                                                      2.1
                                                                          778                 1.9
                                                        735   719                       1.7         1.7
                                                                                1.6                                1.6
                                                                    565

4Q19    1Q20   2Q20   3Q20    4Q20   1Q21   4Q19 1Q20 2Q20 3Q20 4Q20 1Q21       4Q19 1Q20 2Q20 3Q20 4Q20 1Q21

                                                        Comp. EBITDA                     Net Debt / Comp. EBITDA
Balance Sheet Accounts

                        Net Working Capital1 (US$M)                                                                          Property, Plant and Equipment (US$M)
                                            951                                                                                                     2,390
                                                                                                                                     2,105
                                                           774                          750                                                                 1,968   1,934   1,899
                                                                         608
                             497

          NWC Days            44             43            53             44            42

                             2017          2018           2019          2020           2021                                          2017           2018    2019    2020    2021

                                    Net Debt2 (US$M)                                                                                   Stockholders’ Equity (US$M)
                                           1,832                                                                                                            2,391
                                                                                                                                                    2,193           2,281   2,259

                            1,262                        1,330
                                                                        1,185          1,219                                         1,604
                                                                                               IFRS 16

                             2017          2018           2019          2020           2021                                          2017           2018    2019    2020    2021

(1) Net Working Capital = Accounts receivable + Other accounts receivable + Inventories - Suppliers - Other accounts payable and accrued expenses
(2) Net Debt = Bank loans and notes payable + Current portion of long-term debt + Long term debt – Cash
                                                                                                                                                                                    21
Source: Alpek estimates
Debt Profile
     99% of Debt denominated in USD1,2 / Debt average life @ 7.2 years

                                                                                                                        Available Comm.
               Net Debt:                      US$1,219M                       Gross Debt:           US$1,714M                                 US$680M
                                                                                                                          Credit Lines

                                                                        Consolidated Debt Profile2 (Mar. 2021)
                    US$M
                  900          Cash
                  800          Bonds
                               Bank Debt
                  700                                                                                                                                Coupon
                                                                                                                                              600    3.250%
                  600                                                                                                                Coupon
                                                                                                                                     4.250%
                             495                                                                                              500
                  500

                  400                                                               Coupon
                                                                                    5.375%
                                                                             300
                  300
                                                             Coupon
                                                             4.500%
                  200
                                                                       94
                  100
                                                        22                             40
                     0
                            Cash                       2021           2022   2023     2024   2025     2026      2027   2028   2029     2030   2031

(1) A small portion of debt is denominated in ARS                                                                                                      22
(2) Excludes leases, documents and accrued interests
Dividends

                                                                                 Alpek Dividends (US$M)
                                                                                                                             Announced in General
              250                                                                                                            Shareholders’
                                                                                                                                       12 Meeting
                                                                                    225                                       (To be paid in 2Q21)
                                                                                                                                      11
                                                                                                            206
                                                                                                                                      10
              200                                                                                                  178
                                                                                             176                                      9
                             165                                     160                                                   160
                                                 155                                                                                  8
                                                                                             143            143    143              Total Dividend
              150                                                                                                                     7
                                                                                                                           126
                                                 114                                111                                             Shareholders
                                                                                                                                      6
                             100                                     95
              100                                                                                                   9.6               5
                                                                                                                                      4
                                                                                                                                    Dividend
                                                                                             5.9      53                   6.5        3 (%)
                                                                                                            5.6                     Yield
                50
                                                                     3.4             3.4                                              2
                                                 3.0
                             2.1                                                                                                      1
                                                                                                      0
                  0                                                                                                                   0
                            2013               20141                2015            2016     2017    2018   2019   20202   2021

(1) Paid in December 2013                                                                                                               23
(2)
 (1)Showing  US$143M
     Paid in January   Dividend in 2020 (Compensated lack of dividend in 2018)
                     2020
Results by Quarter

                        Sales Volume (KTon)                                                                                Revenues (US$M)
                                            1,260           1,248                                           1,643                                                   1,614
                      1,121 1,109                                    1,184 1,230                                              1,523
                                    1,118           1,059                            +4%                                                      1,407 1,392   1,433
                                                                                                                                      1,325
                                                                                                                    1,175

                         2Q             3Q              4Q               1Q                                       2Q                3Q           4Q               1Q

                      Reported EBITDA (US$M)                                                                Majority Net Income (US$M)
                400                                                                                                                           209
                                                     356

                                     231       Cogen 188
                       217                     Sale          Lotte Bus.                                                                                             121
                                                         201            203                                                                           99
                                                     173     Comb.
                             149            154      356 151 35 147 324
                                                                                                             56                          65
                                                                                                                               50
                                     194 179                166
                       161                           168                                                               6
                                                                      111
                              74
                 0
                         2Q             3Q              4Q               1Q                                                                                 -19
                                                                                                                  2Q                3Q           4Q            1Q

                                                              2019            2020         2021   Comparable EBITDA                                                       24
Source: Alpek
EBITDA Breakdown

                                                 1Q21 EBITDA (US$M)
                                                                                                             324
                                                                                                              17      Others
                                                                                           63

                                        +35%                                                                 123      P&C
                                                                         58
                                                    203
                                                     17

         147               151
          3                 4
                                                     97
          50                66
                                                                                                             184      Polyester

          94                81                       89

    1Q20 Comparable   4Q20 Comparable          1Q21 Comparable   Carry-forward Effect    Inventory   1Q21 Reported EBITDA
        EBITDA            EBITDA                   EBITDA                               Adjustment
Breakdown of Extraordinary Effects

                                           2020                 2021    Δ 1Q21 vs.

                 M dls         1Q    2Q           3Q     4Q     1Q     1Q20    4Q20

      Reported EBITDA          111   74           179    201    324    214      123

        Inventory Adjustment   17    42           (16)   (9)    (63)   (80)     (54)

        Carry-Forward Effect   20    39           (6)    (9)    (58)   (78)     (49)

        Others                  -    (6)          (3)    (33)    -      -       33

      Comparable EBITDA        147   149          154    151    203     56      52
Index

Alpek at a Glance

Key Investment Highlights

Financials

Relevant Events

The Case for PET

Appendix
Texas Polar Vortex

    Operations   • USGC producers impacted by lack of Power,
                   Natural Gas and/or Feedstocks

–                • All Alpek sites continued operating as normal
                 • Producers of feedstocks (Ethylene, PGP, MEG,
                   Styrene) & finished goods (NG, PP, EPS) offline

      Demand     • Demand continued to be high, drawing
=                  inventories to low levels

    Feedstock    • Natural Gas price with two-week spike, reaching
+      Prices      levels as high as US$400/MMBtu at one point
                 • Average Propylene price increased to 73cpp

      Margins    • PP Margins increased to 32cpp in 1Q21
+                • Alpek able to commercialize Natural Gas to 3rd
                   party customers in México during polar vortex

                                                            28
Alpek 2031 Bond Emission

Principal Amount   US$600M

        Maturity   Feb. 2031 (10 Years)

        Coupon     3.25% (-1.00% vs.’29 Bond)

         Spread    200bps (-55bps vs. ’29 Bond)

     US 10 Yr T.   1.28% (vs. ~1.68% on April 1)

     Order Book    US$5.4B (9.0x Over-subscribed)

                   Strong participation from
    Other Notes
                   ESG-focused funds

                                                29
CCP Update

• Pre-construction period extended through end of 2021
• Stronger PET demand in NA supportive of project
• Focused on minimizing CAPEX & optimizing timing
• Front-loading engineering work & analyzing all options

              PTA          PET
           1.3 M tons   1.1 M tons

Own Px                                 • PET (Int.): 367 Kta
& MEG                                  • PTA: 125 Kta

Own Px                                 • PET (Int.): 367 Kta
& MEG                                  • PTA: 125 Kta

Own Px                                 • PET (Int.): 367 Kta
& MEG                                  • PTA: 125 Kta

                                                       30
CO2 Recovery & Liquefaction JV

                • 50/50 Joint Venture with ContourGlobal
                • 70,000-Ton CO2 facility linked with Cogeneración Altamira

                • Meeting the rising demand of food-grade CO2 in Mexico
                • JV leverages both partners’ core strengths
                • Final investment decision expected by 3Q21

      Strengthen                   Foster Circular                  Strategic &
      Core Business                Economy                          Focused Growth

✓ Value-added Products      ✓ Sustainable Product Portfolio   ✓ Product Innovation

                                                                                     31
NOVA Chemicals’ Expandable
                    Styrenics Business Purchase
                                                                         204        529
                                                                          36
                ARCEL®
                EPS                                                      168
                                      20        19           325
                           46
              240                                                       NOVA

     KTA
              MEX          BRA       CHI       ARG           Pre-       USA       Post-
                                                          Acquisition           Acquisition

       Strengthen                       Foster Circular                   Strategic &
       Core Business                    Economy                           Focused Growth

✓ Global Cost                    ✓ Sustainable Product             ✓ Value Chain Integration
  Improvement                      Portfolio
                                                                   ✓ Product Innovation
✓ Value-added Products
✓ Footprint Optimization
                                                                                   32
Growth in rPET Capabilities
                                                                                             207

                                                               Up to 120KTA at
                                                                                              60          2020
                                                             25% recycled content
                           132            PolyQuest
                                       (Darlington, SC)   Cooper River &
                                                          Cosoleacaque       Poseidon
                                             45                               Plastics
                                                                                             147          2019
                                                               30               (UK)
                                             30                                 15
                                             15
             K Tons
                         Bottle to        Flake to        Single Pellet     Enhanced         Total
                          Flake            Pellet         Technology®       Recycling

      Strengthen                            Foster Circular                          Strategic &
      Core Business                         Economy                                  Focused Growth

✓ Value-added Products               ✓ rPET Leadership                      ✓ Value Chain Integration
✓ Footprint Optimization             ✓ Recycling Promotion
                                     ✓ Sustainable Product
                                       Portfolio
                                                                                                     33
ALFA’s Unlocking Value Initiative

Nemak           Axtel            Lower             Alpek
Spin-off        Sale              Debt            Spin-off

 2020           TBD               TBD               TBD

   Alpek’s   • Spin-off not expected in 2021
Transition
      Plan   • Working on becoming fully independent
               from ALFA’s corporate services

 Potential
             • No impact expected to Alpek’s SG&A
 Impact &
  Benefits   • Possibility for more shares to be publicly
               traded, thus increasing share liquidity
             • Strengthened Governance practices

                                                     34
Index

Alpek at a Glance

Key Investment Highlights

Financials

Relevant Events

The Case for PET

Appendix
INDEXED GOOGLE SEARCHES 2009-2020

Every bottle ends up in the middle of the
ocean, I’ve seen the images on TV

     A friend told me that glass is the most eco-
     friendly option, so I always go for that if I can

Companies care more about their sales than the
environment. Just look at any supermarket aisle
’

                                                      PET is #1 for a reason

                                                           100% RECYCLABLE

HDP   PVC    LDPE
 E                                                         RECYCLED AT HIGH RATES

                                                           ONLY PLASTIC THAT CAN
                                                           BE REMADE BACK TO ITS
                                                           ORIGINAL PURPOSE
PP    PS    OTHERS

                HOWEVER, THEY ALL GET BUNDLED TOGETHER,
Although Alpek plays an important role as the largest producer
  and recycler of PET in the Americas, we’re not the only ones
                     involved in its lifecycle.

So rather than hearing it from us, we’d like to introduce you to
some people that can better explain The Case for PET based
            on how it touches their lives every day.

              These are their stories.
«PET is simply a
better product»
For a while now, we wanted to sell more of our berries in
the local supermarkets, but packaging was a problem. We
used carton but there were a lot of disadvantages, for
example if the package got too wet, like from the humidity
in the supermarket refrigerators, it would lose its
resistance or leave our berries exposed to mold. Also,
since it’s not transparent, it was hard to highlight the
quality of our product.

Last year though, we started working with PET packaging
and things are looking up. The package is nice and
resistant, but is also much cheaper! We are using the
savings in other parts of the business to keep growing,
but I’m not going to lie, I’ve also used it for other things
like computers for my kids homeschool and kept a couple
of dollars in my pocket at the end of the day.

                                    5th-generation berry farmer
                                                 California, USA
With the same kilogram of material, you get:     For the cost needed to produce 1 glass bottle,
                                                     you can produce up to 8 PET bottles.

                                           x

                                           x            CENTS

                                           x

  BPA & Phthalate free, as well as the only widely   Unlike glass and aluminum, PET can be transported with
available individually packaged resealable option.   minimal protection as it is more resistant to damage.
«PET keeps
me safe»
The current health emergency caused by the Coronavirus
has taught us many things about our life and ourselves in
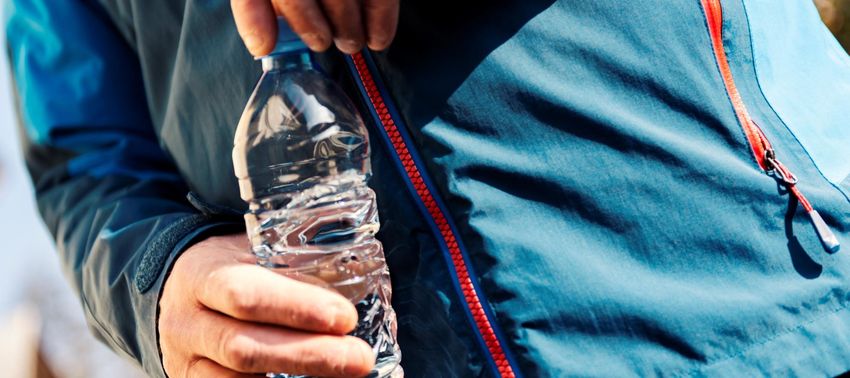
a very short period of time. Something I didn’t expect to
learn was the importance of PET for us, as doctors and
patients. To me PET was just the water bottle I used when
running, but it turns out that it’s also present in many
other things, starting with the safety goggles and
facemask I must wear at work.

It’s odd how something like a virus we can’t even see
showed us how vulnerable we really are. Today I trust the
PET in those goggles and facemask to get home safely
and be with my two daughters and husband. Obviously,
we were not expecting this pandemic, but PET helped us
face it head-on.

                                   Currently fighting Covid-19
                                                 Toronto, CAN
You can easily identify PET products, just look for the
«Educating towards
smarter choices»
From my perspective there have never been more
options in terms of the products we consume every day.
I go to the supermarket and for just one thing, let’s say
orange juice, there are like 3 different packaging
options: PET, glass and cardboard.

My job is to encourage my students by exploring the
current problems we face. After doing a ton of research,
I’ve found that the general misconceptions around PET’s
sustainability are wrong. It is fully recyclable and
recycled at the same rates as its alternatives and made
without hazardous materials. More importantly, I have
the responsibility to teach my kids to dispose whichever
juice bottle they choose, to ensure it gets back to them
another day.

                                   Elementary school teacher
                                             Manchester, UK
B E V E R A G E PA C K A G I N G I N D U S T R Y U N I T S B Y S U S T R AT E ( B U N I T S ) 2 0 0 0 - 2 0 1 9
B UNITS
98%

                                 69%
                  65%
   58%

                                            46%

            30%
                                                        16%

                              ALUMINUM      GLASS      OTHER
WORLDWIDE
                              WORLDWIDE   WORLDWIDE   PLASTICS
«We should
think about the
big picture»
I think society has focused on solving the waste
problem, and we definitely need to solve that, but we
shouldn’t lose sight of the real problem facing our
generation: climate change. Said differently, if all we do
is recycle more, does that mean we are doing less harm
to the environment?

More and more people are doing their part, choosing
fully recyclable materials, putting garbage in the right
place, and starting action in their communities, but I
think that we should also start questioning corporations
about everything that happens before and after we as
consumers make our choice. Fixing the amount of
carbon emissions generated to make the green glass
bottle my sparkling water comes in, and how much
more will be released when it’s recycled, now that’s big
picture stuff.

                                             College student
                                              Sao Paulo, BR
187 gr. CO
                                         182 gr. CO                                    2

                                              x
                                                      2
                                                                               x

Let’s put it into   37 gr. CO
                                2
                         x
perspective»
                                    CARBON FOOTPRINT OVER LIFECYCLE, PER 355 ML. BOTTLE.
90 gr. CO
                                                                              x2

Let’s put it into                       31 gr. CO
                                                    2
                    10 gr. CO
                                              x
perspective»
                                2
                         x
                                    CARBON FOOTPRINT OVER LIFECYCLE, PER 355 ML. BOTTLE.
IS MADE AT
                                                       TEMPERATURES HOTTER
                                                                THAN LAVA.

                                        IS MADE AT A
                        TEMPERATURE HOTTER THAN THE
                                  SURFACE OF VENUS.

         IS MADE AT THE SAME
       TEMPERATURE NEEDED
TO MAKE A NICE SLICE OF PIZZA.
Think back to the last time you had a burger…

What if I told you, you could wash it down with

                     and still
The CO2 emissions generated by
         flying from NYC to San Francisco

is equal to that from recycling     PET bottles
«PET is my
livelihood»
I know it might not sound very attractive, but my job is
to find and separate PET from the rest of your garbage.
Why? Because certain people are willing to pay me good
money for it. There are collection points all around my
city, they buy the PET from me, and then they sell that
material to a recycling plant. I guess it’s good business
for them too, because they never stop coming for more
and more PET.

I tend to focus on PET because contrary to glass and
aluminum, I can find it easily, separate it without much
risk, and carry it since it’s so light and compactable. I
definitely don’t miss getting tetanus shots.

My work allows me to put food on the table for my
family and send my children to school, so I’m very proud
of it. It also gives me great pleasure to see the streets
clean, knowing that in some way, my effort contributed
to achieving that.

                                Garbage collector for 17 years
                                       Ciudad de México, MX
· Increase Recycled PET production
                           · Meet bottlers’ needs
                           · Improve Recycled PET technology

                                                                    · Use higher rPET content
                                                                ®   · Design for higher recyclability
                                                                    · Willingness to source rPET

 · Promote recycling
 · Promote use of lower
   CO2 products

                                                                    · Promote and offer
                                                                      recyclable products
                                                                    · Offer recycle solutions
                                                                      at their locations

· Grow gathering network
                                                                    · Consume responsibly
· Improve PET separation
                                                                    · Recycle everything
· Improve bale quality
                                                                    · Separate trash properly
«We have
a clear goal»
I have proudly been part of Alpek for the last 4 years.
Sometimes I’m questioned by my family about my work
because they’ve heard negative stories surrounding
plastics. But I know that PET is unlike any other plastic.
I’m convinced that for us to achieve a true change in our
society, the first thing we need is real information, so I
actually see these discussions and questions as
opportunities to share the data I have.

I recently had the chance to log-in to a Webcast where
Pepe Valdez, Alpek’s CEO, talked about the company’s
five-year strategy. It was very focused on increasing the
amount of rPET we make, and helping meet our
customers’ goals. These type of things make me proud
to be part of the Alpek family.

                              Lab Analyst at Ecopek (Alpek rPET)
                                                  Pacheco, ARG
Alpek is
 leading the way
           Today we already recycle

                       each year

            And we’re aiming to reach

To get there, among other initiatives, Alpek has joined
associations such as             to develop more trash
      gathering infrastructure in major US Cities.
1. Recycle! As much as you can, and not just PET, but every product you come across.

2. Promote the use of fully recyclable materials in any place: your home,
   your work and even in your favorite coffee shop.

3. Share your newfound knowledge about PET and recycling, to speed up
   our progress towards a truly sustainable future.
Index

Alpek at a Glance

Key Investment Highlights

Financials

Relevant Events

The Case for PET

Appendix
Polyester Value Chain

 Crude Oil              Refinery   Naphtha           Reformer/BTX

                                                                                                            PET             rPET

                                                                                            0.84 ton PTA
                                                                                             per ton PET

                                                                      0.66 ton PX
                                                                      per ton PTA

                                                                 PX                   PTA
                                                                                      0.34 ton MEG
                                                                                        per ton PET        Fibers &
                                                                                                           Filaments
                                             0.80 ton Ethylene          0.72 ton EO
                                                per ton EO              per ton MEG

    Ethane              Cracker     Ethylene         Ethylene Oxide                   MEG
(From Natural Gas)
                                                                                                                       58
Source: Alpek, Nexant
Polypropylene (PP) Value Chain

                                        1.01 ton
                                      Propylene
                                      per ton PP

        Ethane /
        Propane

                                                   59
Source: Alpek, Nexant
Expandable Styrenics (EPS & ARCEL®) Value Chain

               Crude Oil     Refinery     Naphtha                        Reformer                      Pentane

                                                                                                           0.06 ton Pentane
                                                     Benzene                                               per ton EPS

                                                               0.79 ton Benzene
                                                                 per ton Styrene
                                          Ethylene
                                                     0.29 ton Ethylene              0.94 ton Styrene
                                                      per ton Styrene                 per ton EPS

               Ethane        Cracker                                      Styrene                       EPS
        (From Natural Gas)

                                                                                                       Arcel®
                                        Polyethylene                                                                          60
Source: Alpek, Nexant
Caprolactam (CPL) Value Chain

      Crude Oil         Refinery    Naphtha       Reformer

                                                                      Cyclohexane            Caprolactam

                                        Benzene
                                                            0.94 ton Bz per
                                                           ton Cyclohexane

                                                                                    0.99 ton CX
                                                                                    per ton CPL              Nylon

                                   Natural Gas    Syngas                 Ammonia       Ammonium Sulfate    Fertilizers

                                                                                                              61
Source: Alpek, Nexant
Latest Quarter Results

                                                                                                    Results and Key Metrics
                                                                                                              1Q21   4Q20                 1Q20    QoQ (%)   YoY (%)
                            Volume1 (ktons)                                                                               1,230   1,248   1,184     (1)       4
                              Polyester                                                                                    996     992     967       -        3
                              Plastics & Chemicals                                                                         234     256     217      (9)       8
                            Production (ktons)                                                                            1,621   1,612   1,583      1        2
                              Polyester                                                                                   1,346   1,343   1,318      -         2
                              Plastics & Chemicals                                                                         274     269     265       2         3
                            Revenues                                                                                      1,614   1,392   1,433     16        13
                              Polyester                                                                                   1,069    967    1,094     11        (2)
                              Plastics & Chemicals                                                                         471     374     300      26        57
                            EBITDA                                                                                         324     201     111      61       193
                              Polyester                                                                                    184     124      58      48       216
                              Plastics & Chemicals                                                                         123      73      49      69       153
                              Others                                                                                        17       4       3     337       385
                            Comparable EBITDA2                                                                             203     151     147      35        38
                              Polyester                                                                                     89      81      94      10        (5)
                              Plastics & Chemicals                                                                          97      66      50      48        95
                              Others                                                                                        17       4       3     337       385
                            Net Income (Controlling Interest)                                                              121      99     (19)     23       722
                            CAPEX                                                                                           30      97      15     (69)      107
                            Net Debt                                                                                      1,219   1,185   1,436      3       (15)
                            Net Debt / EBITDA3                                                                             1.6     2.1      1.7
(1) Times: Last 12 months   (1) Excludes intracompany sales (2) Excludes carry forward effect (3) Times: last 12 months                                               62
Source: Alpek
Latest Quarter Results
                                                                  Cash Flow
                                                                                                           QoQ
                                                                        1Q21         4Q20        1Q20               YoY (%)
                                                                                                            (%)
                      EBITDA                                             324          201         111        61       193
                      Net Working Capital & Others                      (192)         (16)        100     (1,119)    (292)
                      CAPEX                                              (30)         (97)        (15)       69      (107)
                      Financial Expenses                                 (67)         (23)        (26)     (194)     (154)
                      Income Tax                                         (44)         (24)        (64)      (80)      31
                      Dividends                                          (23)         (15)       (163)      (52)      86
                      Other Sources / Uses                                (2)          22         (49)     (109)      96
                      Decrease (Increase) in Net Debt                    (34)          49        (106)     (168)      68

                                                                  Net Income
                      TABLE 7 | NET INCOME                                                                 QoQ
                                                                        1Q21         4Q20        1Q20               YoY (%)
                      (in U.S.$ million, except as noted)                                                  (%)
                      Consolidated Net Income                            152          118        (16)       29      1,033
                      Non-Controlling Interest                            31          20           3        59       912
                      Controlling Interest                               121          99         (19)       23       722
                      Earnings per Share (U.S. $)                        0.06        0.05        (0.01)     23       723
                      Avg. Outstanding Shares (million)*                2,112        2,112       2,115                        63
Source: Alpek   * The same number of equivalent shares are considered in the periods presented
Relevant References: Crude Oil
Price increased during 1Q21 as quotas met & demand for refined products rose

     US$/Bbl                                  Brent Crude Oil Price
     120

                      99
     100

     80
                                                                        71
                                                                                    64
                                                                                                      61
     60                           52                        54
                                                44                                              42
     40

     20

      0
               2014        2015        2016          2017        2018        2019        2020        2021
Relevant References: Paraxylene
Px prices increased by 30% in line with Crude Oil price (+36%)

     US$/Ton                                           NA Px Contract Price
   2,000

           1,708
                   1,635 1,641

   1,500                         1,382
                                                           1,174   1,165
                                                                           1,077
                                         992         954                           955
   1,000                                                                                 937                           891
                                               876                                             876

                                                                                                           658   685
                                                                                                     590
    500

      0
           2011 2012 2013 2014 2015 2016 2017 2018                  1Q      2Q     3Q    4Q    1Q    2Q    3Q    4Q    1Q

                                                                              2019                     2020            2021
Integrated PET Margins
Margins increased by 36% QoQ due to strong demand

    US$/Ton                                     Asian Margins (Px / MEG to PET)
    600
                 China

    500

    400                                  382                                                                          +36%
                                                              370
                                                        324                                                                  330
                                                                           304               310
    300   277                                                                          275
                                  266
                                                              214                                         250   242
                     227   223           260                                     227
                                                        214                164
    200                                                                                      227                             249    PET
          208                     192                                                  196
                                                                                 145                      172   175
                     165   159
    100
                                                              155          140
                                         122            110
           69        62     64     73                                            82    78    83           78    68           81     PTA
      0
          2014      2015   2016   2017   2018           1Q    2Q           3Q    4Q    1Q    2Q           3Q    4Q           1Q

                                                                    2019                           2020                      2021
Relevant References: Propylene & Polypropylene
Increase in both PGP contract prices and PP margins due to polar vortex

             NA Propylene Contract Price (PGP)                                          NA Polypropylene Margin (PP to PGP)
       cpp                                                                            cpp
  80     76                                                                      35
                                                                           73                                                                            32
                        71
  70               69
                                                                                 30
              60                                                                                                 27
  60
                                            54                                   25                         24
                                                                                                                           22                       22
  50                                                                                                                            21
                                       45                                                                             19
                                                                     41          20
                             39                  37                                                                                            17
  40                                                                                                   15                                 16
                                  34                            35                                                                   15
                                                      31                         15               13
  30                                                       26                           12   12

                                                                                 10
  20

  10                                                                             5

  0                                                                              0
         11   12   13   14   15   16   17   18   19   1Q 2Q 3Q 4Q 1Q                    11   12   13   14   15   16   17   18   19   1Q 2Q 3Q 4Q 1Q

                                                            2020          2021                                                             2020          2021
Relevant References: Caprolactam

                     US$/Ton                             Asian Caprolactam to NA Benzene Spread (Contract)
                2,400

                           2,100
                2,100

                1,800

                1,500
                                                                                                 1,281
                                   1,240                                             1,231 1,272
                1,200                                                        1,137
                                           1,069                                                         1,075
                                                                                                                 976                                       943
                     900                           840    862
                                                                727                                                    692                           739
                                                                                                                             644         669
                                                                                                                                               606
                     600                                                                                                           549

                     300

                       0
                           2011 2012       2013 2014     2015 2016    2017    1Q      2Q    3Q    4Q      1Q     2Q    3Q    4Q    1Q    2Q    3Q    4Q    1Q

                                                                                        2018                       2019                    2020            2021

                                                                                                                                                                  68
Source: IHS Markit
Stock Highlights (BMV: ALPEK)

                     Daily Stock Price (MXN)
   30
   25                                                                          Valuation        2018    2019    2020         1Q21
   20
   15
   10                                                                   Market Cap. (US$B)      3,040   2,571   1,543        1,931
    5
     Jan     May          Sep   Jan   May           Sep   Jan Mar       Net Debt (US$M)         1,832   1,330   1,185        1,219
              2019                    2020                  2021        EBITDA LTM (US$M)       1,063   850     565          778

                                                                        Enterprise Value /
                                                                                                 4.8     4.9     5.3          4.4
    Daily Average Traded Shares & Value (M Shares)                      EBITDA
(M Shares)                                                  (US$M)      Price / Earnings         4.0     6.6     7.9          5.3
    5                                                               4
    4                                                                   Price per Share (MXN)   27.61   23.40   15.70        18.57
                                                                    3
    3
                                                                    2   Exchange Rate
    2                                                                                           19.24   19.26   21.49        20.32
                                                                        (MXN/USD)
    1                                                               1

    0                                                               0
        J F M A M J J A S O N D J F M A M J J A S O N D J F M

                   2019                      2020           2021
                                                                                                                        69
Alpek’s Investor Relations Team
Email: IR@alpek.com / Phone: +52 (818) 748-1146

                Alejandro
                                     • 10 Years at Alfa/Alpek
                Elizondo             • Previously held roles as Director of Logistics & Procurement at Indelpro, Director of Energy Markets at
                   IRO                 Alfa, and Project Leader at The Boston Consulting Group
                                     • BS in Industrial Engineering from Cornell University and MBA from Stanford Graduate School of Business
              aelizondo@alpek.com

                Alejandra
               Bustamante            • 9 Years at Alfa/Alpek
               IR Manager            • Previously held roles in Human Capital, Talent & Culture at Alfa and Axtel
                                     • BA in International Relations from ITESM
             abustamante@alpek.com

                                                                                                                                            70
Disclaimer

  This presentation contains, or may be deemed to contain, “forward-looking statements”. By their
  nature, forward looking statements involve risks and uncertainties because they relate to events
  and depend on circumstances that may or may not occur in the future. The future results of Alpek,
  S.A.B. de C.V. and its subsidiaries may differ from the results expressed in, or implied by the
  forward-looking statements set out herein, possibly to a material degree.

                                                                                                  71
Corporate Presentation
1st Quarter 2021
You can also read