Creating thematic maps online using PHP, KML and Google Earth, an example of visualizing selected indicators for the Slovak republic
←
→
Page content transcription
If your browser does not render page correctly, please read the page content below
Creating thematic maps online using PHP, KML and Google Earth, an
  example of visualizing selected indicators for the Slovak republic
                                  Vladimír Bačík
 Department of Human Geography and Demogeography, Comenius University in Bratislava
                                bacik@fns.uniba.sk

Thematic mapping is one of the most common cartographic methods used to identify spatial interrelated
phenomena, which are observed in another form to a limited extent. Cartographic expression helps to identify the
exact context in space. Nowadays, there exist a number of specialized products for the creation of thematic
maps, in the form of software applications, or applications using services from the World Wide Web. In our
paper we will try to explain the possibility of vector format KML and its properties for thematic mapping in
Google Earth closer, which is used to display the resulting map outputs. Maps alone are compiled by the client
using the Web site browser for transferring input variables to the server, where they are processed and map data
is subsequently generated according to client requirements. As well as KML format the application also uses the
MySQL database system, which serves for storing the geometry of entities in the form of single points forming
the boundaries of administrative units (communities), as well as attributes from the official census of population
and housing in 2001 for these spatial units.

Keywords: Thematic Mapping, Google Earth, KML, PHP, Database System

1. Introduction
        Thematic mapping is used to visualize the results of geographic research, thereby helping to observe the
spatial dimension of achievements and thus also aid their better understanding in the context of the evaluation of
spatial relationships between studied phenomena. There exist a number of specialized programs and tools for
creating thematic maps using a variety of standard as well as advanced processing techniques. Solutions are
usually available as complex software solutions operating in offline mode on the local computer or as procedures
using the services of map servers, which generate cartographic outputs on the Internet and they are thus available
to a wide range of users, from candidates and enthusiasts to specialized researchers, dealing with this topic.
Intensive improvement of Internet technologies and formats helps to increase the amount of online applications
aimed at the creation of thematic maps on the Internet. It can be concluded that, from the cartographical point of
view, vector formats based on XML - SVG and KML are preferred for the purpose of publishing thematic maps
via the Internet. Vector Format SVG is a W3C standard and is very popular especially in the field of graphics
and design. It has very suitable properties for working with cartographic outputs; while graphical interpretation
alone succumbs to SVG format standards, interactivity on the client side is implemented by using the scripting
languages ECMAScript and Java Script. On the Internet, numbers of very valuable applications were created
which focus on the distribution of thematic maps (e.g. Sri Lanka Atlas, Vienna, OECD Atlas etc.). The issue of
SVG format and its use is described in detail in the work of many authors dealing with the distribution of
geographic data on the Internet using SVG format. Even if the emphasis in literature is given to the graphical
aspects of this format, there are works in which the crux of the problem is devoted to the cartographic aspects of
the use of SVG in the field of webmapping (Ueberschär and Winter 2006, Hu 2008, Li et al. 2008, Xi and Wu
2008). Significant works from the perspective of this paper are also publications devoted to the utilization of this
format for thematic mapping (Held et al. 2003), since the application we will discuss in the next section uses just
those procedures and tools typical for thematic mapping.
We will focus in detail on the more widespread vector format KML in our paper, which is a universal format
supported by the globally spread geobrowser Google Earth from Google, Inc. Functionality is demonstrated in
the example of the Atlas of thematic maps for the Slovak Republic. The spatial extent of the atlas, as well as its
attribute component, is defined by data stored in a database system on the server, and therefore all the procedures
and methods are applicable to any territory and attributes of individual entities.

2. KML and Google Earth
        Google might be considered a world leader in the organization of unordered data in the World Wide
Web through its search mechanism, which was a stimulus in the establishment process of this company. In many
ways Google's expansion activities now play a key role in the further development of Internet technologies. One
of the most successful products is Google Earth (GE), purchased in 2004 from a Keyhole company called also
Keyhole Earth Viewer. Currently, this can be considered as the most widely used geobrowser in a global context.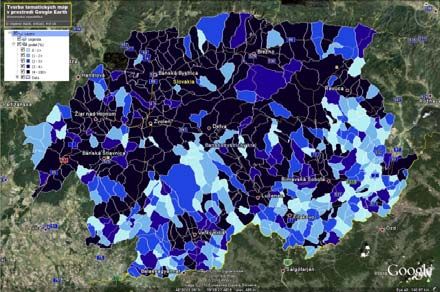
Thanks to its functionality, engine and global popularity it is becoming an important tool for the distribution of
scientific results, which are characterized (among other things) through their spatial dimension. First it should be
noted that Google Earth is not a traditional GIS application in the context of the evaluation of Geoinformatics as
a scientific discipline. However due to its intuitive controls and features it has become a very useful tool not only
in cartographic visualization but also in the educational process at all levels of the education system and not only
from the perspective of geographical sciences. The advantage of this product is its independence from the
operating system, which is the limiting factor for usage in many applications and also in compatibility with other
Google products, thanks to which it is possible to create complex solutions with multiple focus.
          KML1 itself is, according to Google documentation, defined as a file format used to display geographic
data in an earth browser, such as Google Earth, Google Maps, and Google Maps for mobile. A KML file is
processed in much the same way that HTML (and XML) files are processed by web browsers. Like HTML,
KML has a tag-based structure with names and attributes used for specific display purposes. Thus, Google Earth
and Maps act as browsers for KML files (KML Documentation 2011). KML files are very often distributed in
KMZ files, which are zipped files with a .kmz extension. These must be legacy (ZIP 2.0) compression
compatible (e.g. deflate method), otherwise the .kmz file might not uncompress in all geobrowsers. The contents
of a KMZ file are a single root KML document (notionally "doc.kml") and optionally any overlays, images,
icons, and collada 3D models referenced in the KML including network-linked KML files. Complete reference
of all KML elements is available on the website http://code.google.com/intl/sk/apis/kml/
documentation/kmlreference.html. A very valuable source of information about this format is the Handbook
from Josie Wernecke (2009). In 2008 KML 2.2. was accepted as an OGC standard. KML is complementary to
most of the key existing OGC standards including GML (Geography Markup Language), WFS (Web Feature
Service) and WMS (Web Map Service). Currently, KML 2.2 utilizes certain geometric elements derived from
GML 2.1.2. These elements include point, line string, linear ring, and polygon. The OGC and Google have
agreed that there can be additional harmonization of KML with GML (e.g. to use the same geometry
representation) in the future (http://www.opengeospatial.org/standards/kml/).
          The usability of KML format in different geobrowsers’ environments is very diversified, ranging from
simple static display of selected objects to extensive dynamic solutions based on the time cross sections. In our
application we focused on the use of this format for thematic mapping, which plays a key role in the process of
visualization of Human-geographical phenomena in space. There is a large number of procedures and methods
of thematic mapping, which is given close attention in literature (Kaňok 1999, Dobešová and Kusendová 2009,
Slocum et al. 2004, Sandvik 2008). Especially works from B. Sandvik were very inspired in the preparation
phase of resulting applications. In our applications, we focused on the use of those methods, which can be
considered due to their usefulness and frequency most importantly, as well as clearly interpreted not only by
professionals, but also by the lay community. The second important moment (in selection of methods used by
generating thematic maps) is the use of more Google tools, through which a very interesting combination can be
created: user attractive and professionally correctly map outputs. In the final phase we have created a graphical
interface through which it is possible to generate thematic maps based on the cartogram method, pie chart
method, graduated symbol, 3D prism maps and bar charts (Google SketchUp was used due to its ability to export
so-called Collada objects).

3. Used methods
         The aim of the project was distribution of census data in an attractive form for the GE environment. For
this purpose, the methods can be divided into two main parts. At first we focused on the possibilities of PHP
scripting language and MySQL database system to generate map outputs (in GE). The second, equally important,
point was a question of how the original spatial data could be transformed into a suitable form, usable in the final
internet application. Given the focus of the resulting application it is not desirable to transmit the original data
with a maximum spatial accuracy, so it is important to use the appropriate algorithm for geometry generalization.

3.1 Use of PHP scripting language and MySQL database system for dynamic generating
maps
        Our paper is aimed at generating thematic maps in Google Earth, based on the use of vector format
KML. While we approach the description of the existing web solution, attention is drawn to an important
moment of generating own maps and thus highlight the potential uses of PHP scripting language and MySQL
database system. It serves as a central storage not only for the attribute part of individual entities but also as a

1
 The complete scheme is available at http://schemas.opengis.net/kml/2.2.0/ and a basic functionality is described
on the KML documentation pages at http://code.google.com/intl/sk/apis/kml/documentation/whatiskml.html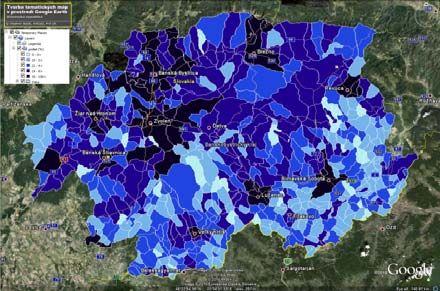
data warehouse for spatial units geometry utilized by us in the form of coordinates (particular points), whose
boundaries consist of the following entities.
          The core of the application is a combined use of PHP scripting language properties, MySQL database
system and KML format, whose standards are currently used for the displaying of thematic maps on the client
side. Each thematic mapping method uses the specific properties of KML elements. Before we proceed to the
description of referred methods, let us return to the basic moment of generating map layouts by extract data from
a MySQL database, which stores the individual attributes, as well as the geometry of entities in the form of
coordinates of points. Graphical display itself is carried out in two cycles, while in the first cycle it comes to a
listing of individual attributes (description element) and in the second cycle it comes to displaying geometry, and
the extraction of coordinates of points forming a given territorial unit. Let´s have a look at a simple listing
mechanism of an individual municipality with the code 512842 (Považská Bystrica).The result may then look as
follows (modified according to source code by Google, 2007):

     // selecting attributes from database table.
     $result=MySQL_Query("SELECT*FROM `municipalitiesSR` WHERE mun_code='512842'");

     $kml = array('');

     // first cycle for displaying attributes
     while ($row = mysql_fetch_array($result)) {

     $kml[] = '';
     … // corresponding KML code for polygons
     $kml[] = '';

     // selecting coordinates from database table.
     $coord = "SELECT * FROM coordinatesSR WHERE coordinatesSR.mun_code = ". $row["mun_code"];

     $list= MySQL_Query($coord);

     // second cycle for displaying coordinates
     while($coord = mysql_fetch_array($list)){

     $kml[] = $coord["long"].",".$coord["lat"].",".$coord["z"]."";
     } // end of the second cycle

     $kml[] = '';
     $kml[] = '';

     } // end of the first cycle

The server processes the request for displaying an area with a given code and by using PHP code it will generate
a list of individual attributes that appear in the  element. Before the end of the entire cycle occurs,
even to listing the coordinates (second cycle), these are printed to the municipality with the same code that was
used to extract individual attributes in the first cycle. The result is a display of the defined area in Google Earth
on the client-side. Output generated in the form of maps in KML should be replaced due to its potential size, and
handled in its compressed form as a KMZ file. For this purpose it is possible to use for example a phpzip
function.

3.2 Preparation of input data
          MySQL database system can be considered as the core of the entire application. Considerable attention
is devoted to the issues of its use in literature - mainly from the IT area (Connoly and Begg, 2002, Ullman 2004).
Attributes of individual municipalities represent selected data from the Census of Population and Housing in
2001 (total 25, with the possibility of an extension following and additions from forthcoming data from last
year’s census). The issue of saving the geometry of the objects relates to the possibilities of used geoinformation
technologies (in our case MapInfo Professional and ArcGIS). From the point of view of the resulting
applications (thematic maps) it is not so important to devote attention to the accuracy of the geometry of input
data. According to Maceachren (1985), spatial data accuracy can be considered to be less relevant in comparison
to accuracy of attribute data of these spatial units.
        In the case of applications based on a client-server principle, an important role is played by the amount of
data transferred between the server and the client’s side. For that reason it is appropriate to use the generalization
process of map data, which is the process of reducing the information content of maps due to scale change, map
purpose, intended audience, and/or technical constraints (Slocum et al. 2005). In the ArcGIS environment, it is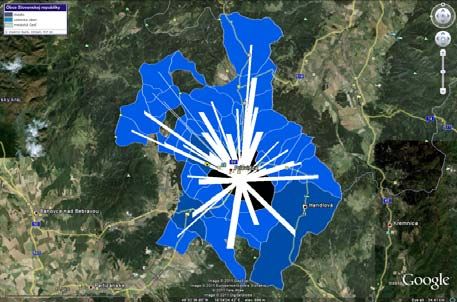
possible to perform two basic types of generalization geometry– Point Remove method (adaptation of the
Douglas – Peucker algorithm) and Bend Simplify method (adaptation of the Wang Algorithm). We preferred the
first one (Point Remove), in which we have a larger decrease of the vertices, so we can reduce the size of the
final map output (Santo et al. 2008)
        Since a created database table contains the coordinates of each point, which make up the boundary of
each municipality, it was necessary to convert the polygons, which means linear objects into individual points.
For this purpose we used the All2points tool, which is a free map basic application (*.mbx file) functioning in
MapInfo Professional. The original map layer contained 369,447 nodes. Using the generalization method, we
reduced the total number of nodes to 94,077. This layer was transformed into a simple text file and imported into
the pre-created database table “coordinatesSR” of a simple structure – id, mun_code, lat, long.
          The same SQL commands (Data Definition Language) were applied by creating another database table
(municipalitiesSR), which contains the attributes of municipalities pertaining to the population and housing
census 2001 in the Slovak Republic. The application itself can be extended to any number of attributes bound to
a different point of time as well as spatial units. The relation between these tables (municipalitiesSR,
coordinatesSR) is realized by the column "mun_code", which is part of both tables.

3.3 Data transfer using a web site with HTML forms
         During designing a graphical interface and functionality of the presented application, we tried to take
into account the basic needs of the users of standard GIS applications for handling a thematic map. Individual
variables, respectively generated thematic maps, can be modified in terms of basic procedures, i.e. clients can
modify the basic size of the symbols, defining ranges, colour range, etc., taking into account cartographic and
aesthetic criteria (Brewer 2005). The spatial extent of the Atlas covers the entire territory of the Slovak Republic,
whereas in the database are stored coordinates of all points, of which consist individual municipalities, i.e. the
lowest administrative units of the Slovak Republic. We have concluded that it will be much more preferable to
define territorial units for the individual client. Therefore a graphical interface is designed such that each client
can choose an indicator on the municipal level for each district (79), region (8), or the whole Slovak republic.
When selecting the appropriate type of thematic map (web page) it is possible to modify the basic properties of
the resulting maps using simple HTML forms with concrete modifying possibilities for specified map types
(breaking values of ranges, colour schemes, size and shape of diagrams, etc.). The client specified modifications
are transferred as variables using the standard POST method to a file that is used to generate thematic maps
itself.

4. Resulting thematic maps
         Generally speaking, there are two main groups of thematic maps – qualitative and quantitative maps.
The main principle of these maps is a graphical representation of the size, number, structure, height, etc. of
observed phenomenon. Each method has well-defined rules, compliance with which enables the creation of
cartographically correct outputs. We used five basic methods of thematic maps in our application that are
appropriate for their displaying in GE – Choropelth maps, Pie chart maps, Proportional symbol maps, Prism
maps, Collada objects2
4.1 Choropleth maps
          The common denominator of all used methods of thematic mapping is the transmission of variables
defining the final form of maps through the Internet to the server, where they are subsequently processed by PHP
module, while the resulting thematic map is based on the KML standard and the client gets the map in the form
of a compressed KMZ file. Most standard thematic maps are made by using the choropleth mapping method.
With this method each data collection area is given a particular colour lightness, colour saturation, or pattern
texture depending on its magnitude (Kimerling et. al. 2009). In this method, we have chosen standard
possibilities of modification of the resulting maps. They are well known from desktop applications, i.e. they have
the possibility to define their own custom ranges (with a fixed number – 5), as well as a choice of five sequential
colour schemes. The essence of this method is assigning particular styles to individual statistical units
(municipalities) based on the value of a monitored indicator. An example is shown in the following extract:

       // $h1-$h5 are breaking values for each interval transferred from HTML form
       // $map is variable expressing what indicator will be displayed on a map
       if (isset($h1) AND $h1 != '' AND $map=='p_odchadza') {
       $h1 = $br1; // $br1 is send through web form with another breaking values(1-5)

2
    Created application is available at: http://www.sodbtn.sk/kml/obcesr2/eng/index.html
// based on values $h1-$h5 are assigned defined styles
if ($indicator$h1 AND $indicator$h2 AND $indicator$h3 AND $indicator$h4 AND $indicatorif ($s=='s1') {$symbol='circle.png';} // if ($s=='s2') {$symbol='square.png';}
if (isset($scale) AND $scale != '') {$number = $scale;}
if (isset($scale) AND $scale == '') {$number ='2000';}
$symbolSize = sqrt($value/$number);
// resulting size of the symbol
$kml[] = ''.$symbolSize.'';
$kml[] = '';
// link to a picture representing the symbol
$kml[] = 'pictures/'.$symbol.'';
$kml[] = '';
$kml[] = '';
// centroid coordinates of the commune, which is lashed symbol location
$kml[] = '';
$kml[] = '' . $row['long'] . ',' . $row['lat'] . '';
$kml[] = '';
Since the size of the symbol is defined by the mathematical expressions in PHP scripting language, it is possible
to modify this size with any mathematical expression used in the field of thematic cartography..
4.3 Pie chart method
Application of this method is very similar to the previous method, when each variable has a precisely
defined size of displayed diagram (pie chart), while this diagram shows the segments complying with the
relevant characteristics. KML primarily does not support pie charts, unlike SVG. Even in this case, the properties
of element can be used and thus enable the transfer of picture files via the Internet. For this purpose we
have used the internet service Google Charts API. This service returns an image to the client in PNG format,
depending on the particular requirements, and it is possible to combine several types of graphs (Sandvik 2008).
The values of indicators that creating the final form of the pie chart are stored in an attribute database table. Each
type of chart can be modified according to the relevant properties of used chart type. The task was to show the
simplest form of this chart, with definition of transparency and setting the beginning angle of displayed
individual values (the specification of the angle in radians). Localization of the chart was, as in the case of
proportional symbol, related to the centroid of the administrative unit.
$kml[] = '';
$kml[] = '';
// series of conditions for displaying indicators depending on the selected map
if ($map=='pie') {$value = ($row['pred'])+($row['pro'])+($row['po']);}
// define the size of the chart
if (isset($scale) AND $scale != '' AND $map=='pie') {$number = $scale;}
if (isset($scale) AND $scale == '' AND $map=='pie') {$number ='1000';}
$symbolSize = sqrt($value/$number);
// resulting size of the chart
$kml[] = ''.$symbolSize.'';
$kml[] = '';
// link to a picture (diagram) generated with Google Charts API, based on transmitted values
if ($map=='pie') {$kml [] =
'http://chart.apis.google.com/chart?chf=bg,s,65432100&chd=t:'.$pred.','.$pro.','.$p
o.'&cht='.$graft.'&chco=9c0000,6666FF,009900&chp=4.71238898038469';}
$kml[] = '';
$kml[] = '';
// centroid coordinates of the municipality, which is lashed chart location
$kml[] = '';
$kml[] = '' . $row['long'] . ',' . $row['lat'] . '';
$kml[] = '';
In similar solutions, several types of charts can be used the use of which is in accordance with cartographic rules
for the creation of thematic maps. Google Charts API is also suitable for graphically displaying monitored
indicators in the info window that appears when the client highlights a particular municipality. All necessary
information associated with a particular unit is included in element . Also in this case, the size ofthe chart can be modified, respectively it can display the 3D shape of the chart, which is a popular expression of
monitored phenomenon especially in the lay public community.
4.4 Prism maps
The method of prism maps, sometimes also called oblique stepped surface maps, is very attractive from
a user´s perspective and also very easily applicable to Google Earth environment functionality. A prism map is
made by dividing the mapped region into data collection areas (in our case municipalities) and showing the
magnitude by varying the heights of the areas. The resulting map looks like a three-dimensional stepped surface
(Kimerling et al, 2009). It is very important to display the order of the coordinates forming individual regions in
the case of prism maps creation in Google Earth. For correct displaying of colours of the selected regions, it is
necessary to display coordinates counter clockwise, which was achieved by using a standard SQL clause
ORDER BY “attribute” DESC.
// list of polygons coordinates displaying counterclockwise
$coord = "SELECT * FROM coordinatesSR WHERE coordinatesSR.mun_code = " . $row["mun_code"] . "
ORDER BY id DESC ";
Individual areas are integrated into classes by using the value of the relevant indicator, as we can see in a
combined prism map, with the displaying of indicators in classes, the height of the entity is unique for each
individual object. A key element is for displaying the height of the entity, which is a part of
element. It is possible to choose from three basic values (absolute, clampToGround,
relativeToGround), we have used „relativeToGround“, which sets the altitude of the element relative to the
actual ground elevation of a particular location (KML reference). Some conditions that enter into the final output
are shown in the following list:
$mode='relativeToGround';
$kml[] = '';
$kml[] = ''.$mode.'1';
$kml[] = '';
// list of polygons coordinates from database displaying counterclockwise
$coord = "SELECT * FROM coordinatesSR WHERE coordinatesSR.mun_code = ". $row["mun_code"] . "
ORDER BY id DESC ";
$list= MySQL_Query($coord);
// value of axis „z“ (predefined, or transfered through the form)
if (isset($scale) AND $scale != '' AND $map=='population') {$z=$value*$scale;}
if (isset($scale) AND $scale == '' AND $map=='population') {$z=$value*1;}
if ($extrude=='on') {$coordz=$z;}
// displaying of coordinates in output map file
while($coord = mysql_fetch_array($list)){
$kml[] = $coord["long"] . ", " . $coord["lat"] . ", " . $coordz . ",";}
$kml[] = '';
4.5 Using COLLADA objects for displaying objects
In the case of displaying collada objects as bearers of information about a monitored indicator, it is
possible to combine several Google products in one application, as in the case of maps generated by the pie chart
method, where Google Charts service was used. This method is also based on the possibilities of displaying 3D
objects created by Google SketchUp, which is a 3D software tool that combines a tool-set with an intelligent
drawing system. This enables models to be placed using real-world coordinates and share them with other people
via the Internet environment (http://sketchup.google.com/). Due to its simplicity, intuitive controls and amount
of features, this program is currently the most popular tool for creating 3D objects in the world. Any 3D object
created using this program (*.skp) can be exported as a file with *.dae extension (COLLADA file) and then this
model can be incorporated into the resulting KML file using , which is a part of the element . The
primary step was the creation of 3 basic objects of a one unit height parameter (block, cone, and cylinder) as wellas a single figure, utilized to display number of population. 3D models exported in *.dae files were stored on
servers, where it is possible to find them using the reference in the form of element 3.
$kml[] = '';
$kml[] = '';
// selecting appropriate collada object
if ($chart=='cylinder') {$col='cylinder.dae';}
if ($chart=='figure') {$col='figure.dae';}
// link to a directory on the server with stored objects
$kml[] = 'link_to_a_file/'.$col.'';
$kml[] = '';
$kml[] = '';
$kml[] = ''. $row['long'] .'';
$kml[] = ''. $row['lat'] .'';
$kml[] = '0';
$kml[] = '';
// scaling of object in the Z-axis
if (isset($scale) AND $scale != '' AND $map=='population') {$z=$value*$scale;}
if (isset($scale) AND $scale == '' AND $map=='population') {$z=$value*6;}
// scaling of object in the X and Y-axis
if ($chart=='cylinder') {$x=2000 AND $y=2000;}
if ($chart=='figure') {$x=$z AND $y=$z;}
$kml[] = '';
$kml[] = ''.$x.'';
$kml[] = ''.$y.'';
$kml[] = ''.$z.'';
$kml[] = '';
$kml[] = '';
In case of simple objects such as a block, cone or cylinder, it is appropriate, respecting the small size of spatial
units, to define the exact dimensions in direction of axes X and Y. For more complex objects (figure) there is a
scaling in all directions (X,Y,Z) to avoid significant distortions of the object. For larger administrative units
(regions, states, continents), this moment is negligible and it is usually used for the possibility of scaling the
objects in all directions. Obviously, this depends on the character of the pursued indicator.
5. Discussion
The imaging of an event in the form of a thematic map is one of the most commonly used cartographic
techniques in geographic research. The presented solution is intended most of all for persons interested in the
creation of similar outputs in the GE environment. Thematic maps created in standard map products (MapInfo,
ArcGIS, Geomedia) can be exported to KML format using a conversion solution intended for this purpose.
Regardless, their definitive version is precisely defined and a client has no direct access to its modification. The
possibility of creating a map output corresponding to client´s requirements can be considered the main added
value of the resulting application. Such services are optimal for companies and organizations distributing large
amounts of statistical data.
The spatial extent of an atlas is limited by the coordinates of points saved in a database and obtained
through the simple conversion of the appropriate map layer in a random GIS programme using appropriate
processes. In our case we preferred the separate location of individual points; the second option is the location of
coordinates of the whole object as one record. We preferred the mentioned record due to the simple listing of
„Z“ coordinate in the cases of prism maps where we imaged the value of the relevant indicator, such as the
mentioned value. There is a problem in the case of such recording of coordinates into a database table: if
a polygon contains „gap“ it means some smaller objects are localized inside it.
The table „coordinatesSR“ created by us contains the coordinates of points forming the main boundary
of a village (). If there are some “hollow polygons”, it would be appropriate to create another
table containing just the coordinates of points forming the inner boundary of such an object
(). In the case of maps, imaging characteristics expressed by points (pie chart, proportional
symbol, collada objects) the objects were recorded using the element . Given symbols are
3
For collada objects, any object can be used from the already established Google gallery, which is available
from the company website devoted to this product.localized in a centroid of a given village , the coordinates of which were extracted in the primary phase
of the map base conversion.
Considering the number of statistical units (2,928 Slovak villages) it is not appropriate to image relevant
thematic maps for the whole territory of the Slovak Republic. First of all, in the case of a map constructed using
the proportional symbol map method, there is a time problem concerning the loading of a diagram for each
object, as the Google Charts API service is used and for each village it is necessary to generate each appropriate
diagram individually. The rate of map output drafting is related to the degree of input spatial data generalization.
For a smaller spatial extent of an atlas, an original geometry can be used; as the number of units grows it is
necessary to start with input layer generalization so that the result will be clearly spatially as well as statistically
interpretable.
The process of generating a thematic map can be seen on two levels - on the one hand the utilization of
PHP scripting language in order to generate a map itself, on the other hand the utilization of basic syntactic rules
of KML format for the purpose of specific visualization of the appropriate method of a thematic map. The
analyzed application uses basic rules concerning the extraction of data from a database and a simple condition
order, which are easily available also for authors with less advanced programming skills. The resulting thematic
maps keep the standard KML syntax based on individual elements and their characteristics. In the case of
cartogram methods the defining of particular object style (colour) is based on interval values sent from the input
form. The proportional symbol map method and proportional symbol method use the possibility to scale the size
of a symbol in question, as well as to image such a symbol in the form of any raster image saved on the server.
When using collada objects, the simplicity of the final model plays an important role once again. The complex
structure of a model extends the time of drawing final map output. For such maps, the use of sophisticated 3D
models is inappropriate due to time necessary for drawing the given model if there are too many spatial units.
6. Conclusion
The main objective of this paper, as well as evaluating existing Web applications, was to demonstrate
the general possibilities of using PHP scripting language and KML format in the field of Thematic Mapping. The
advantage of this format is its direct support for multiple applications and services generated by Google, and
therefore the possibility to combine features and functionality of multiple products into one compact unit. In the
process of creating the application itself, we tried to use the methods and procedures which are known to users of
standard desktop GIS applications, and taking into account the standards and qualities of used KML format.
Spatial possibilities of generated maps are the result of data storage in database tables, while the process of
preparing the necessary data itself uses techniques that are well known to GIS users.
The most appropriate method used in similar-oriented applications is utilization of the database system
MySQL and PHP scripting languages, for the purpose of manipulating data and input variables. Commands
themselves are relatively simple and do not require advanced programming skills, and therefore the possibility of
creating such an application is available to clients with a standard level of computer literacy. Other interesting
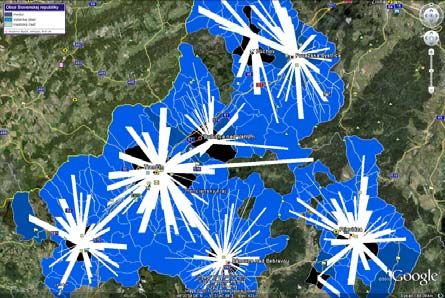
processes can be used in the process of creating thematic maps, such as showing lines of movement (on the basis
of intensity, motion can be assigned different styles with different thickness of lines (Figure 2), or on the
availability of data at different time points to create interesting animated maps, which are the result of the use of
the element, whereby we obtain a dynamic and very attractive user-friendly cartographic output.
Figure 2: Identification of various commuting regions by using method lines of movementApart from the actual cartographic display and possibilities for combining several thematic layers with other
KML outputs, also highly valuable is the use of element to which it is possible to write any
information relating to a particular spatial unit. As follows, it is possible to further connect to external
information sources, display graphical outputs generated by the Google Charts API, listing the relevant attributes
and many other possibilities. Applications of this type are also suitable to supplement the educational process at
different levels of the education system, starting with the lowest levels at which students familiarise themselves
with maps as bearers of spatial information, up to the university level. The benefit of applying the methods of
thematic mapping is also a clear visual interpretation of these maps by the general public, which has the chance
to become familiar with the results of geographic research in very interesting and attractive user-friendly form.
Acknowledgments:
The chapter was carried out under VEGA Grant No. 1/0562/12
References:
Brewer, C. A., 2005. Designing better Maps, A Guide for GIS Users, ESRI Press
Cabello, S., et al., 2008. Algorithmic Aspects of Proportional Symbol Maps [online], Available at:
http://webdoc.sub.gwdg.de/ebook/serien/ah/UU-CS/2008-008.pdf [Accessed 12 July 2010]
Connoly, T. and Begg, C., 2002. Database systems, A practical Approach to Design, Implementation, and
Management, 3rd ed., Addison Wesley
Dobešová Z. and Kusendová, D., 2009. Goal-Question-Metric method for evaluation of cartographic
functionality in GIS software [online], Proceedings Symposium GIS Ostrava 2009, 115 – 120, Available at:
http://gis.vsb.cz/GIS_Ostrava/GIS_Ova_2009/sbornik/Lists/Papers/032.pdf [Accessed 20 January 2011]
Google, 2011a. KML Reference [online], Available at:
http://code.google.com/intl/sk/apis/kml/documentation/kmlreference.html [Accessed 13 January 2011]
Google, 2011b. Google Chart Tools/ Image Charts (aka Chart API) [online], Available at:
http://code.google.com/intl/sk/apis/chart/docs/making_charts.html [Accessed 10 February 2011]
Held, G., Schaeffer, O. and Vogel, A., 2003. Internet GIS mit SVG [online], Available at:
http://www.geographie.hu-berlin.de/gk/gk/leute/publik/ringvl_03/vogel.pdf [Accessd 15 January 2005]
Hu, S., 2008. Advancement of Web Standards and Techniques for Developing Hypermedia Maps on the Internet,
in M. P. Peterson, International Perspectives on Maps and the Internet, Springer, 115-124
Kaňok, J., 1999: Tematická kartografie, Ostravská Univerzita, Ostrava
Kimerling, A., et al. 2009. Map Use, Reading and Analyses, 6th ed. ESRI Press
Lake, R., 2008. KML released as an OGC Specification [online], Available at:
http://www.galdosinc.com/archives/498 [Accessed 21 September 2010]
Li, Y., Huang, H, and Chi, G., 2008. Spatial functionality based on SVG, in M.P. Peterson, International
Perspectives on Maps and the Internet, Springer, pp.125-141.
Maceachren, A., 1985. Accuracy of thematic maps / Iplications of choropleth symbolization, Cartographica, The
International Journal for Geographic Information and Geovisualization, 22 (1), 28-58
Marks, M., 2007. Using PHP and MySQL to create KML [online], Available at:
http://code.google.com/intl/sk/apis/kml/articles/phpmysqlkml.html [Accessed 10 June 2010]
Neumann, A., Winter, A., 2003. Vector-based Web Cartography: Enabler SVG [online], Available at:
http://www.carto.net/papers/svg/index_e.shtml [Accessed 12 January 2006]
Patterson, T. C., 2007. Google Earth as a (Not Just) Geography Education Tool [online], Available at:
http://dx.doi.org/10.1080/00221340701678032 [Accessed 11 December 2010]
Sandvik, B., 2008. Using KML for Thematic Mapping [online], Available at:
http://thematicmapping.org/downloads/Using_KML_for_Thematic_Mapping.pdf [Accessed 10 January
2011]
Santo, M., Oliveira, F., and Wosny, G., 2008. Algorithms for automated line generalization in GIS [online],
Available at: http://www.scdhec.gov/gis/presentations/ESRI_Conference_08/papers/papers/pap_1801.pdf
[Accessed 12 February 2010]
Shepherd, J., C., 1990. Database Management: Theory and Application, Irwin
Sheppard, S.R.J. and Cizek, P., 2009. The ethics of Google Earth: Crossing thresholds from spatial data to
landscape visualisation, Journal of Environmental Management, 90 (6), pp.2102 – 2117.
Slocum, T. A., et al. 2005. Thematic Cartography and Geographic Visualization, 2nd ed. Pearson Education
Ueberchär, N. and Winter, A., 2006. Visualisieren von Geodaten mit SVG im Internet, Band 1: Scalable Vector
Graphics – Eifuhrung, clientseitige Interaktionen und Dynamik, Herbert Wichmann Verlag
Ullman, L., 2004. PHP a MySQL, Názorný pruvodce tvorbou dynamických www stránek, Brno: Computer Press
Wernecke, J., 2009. The KML Handbook, Geographic Visualization for the Web, Addison WesleyYan-tao, X. and Jiang-guo, W., 2008. Application of GML and SVG in the development of WebGIS, Journal of China University of Mining & Technology, 18 (1), pp.140 - 143. Ying-jun, D., Chong-chong, and Y., Jie, L., 2009. A Study of GIS development based on KML and Google Earth, 09 Proceedings of the 2009 Fifth International Joint Conference on INC, IMS and IDC.
You can also read