D6.2 Environmental Impact Report - PowerKite project
←
→
Page content transcription
If your browser does not render page correctly, please read the page content below
Ref. Ares(2018)6619348 - 21/12/2018
Power Take-Off System for a Subsea Tidal Kite
D6.2
Environmental Impact
Report
Deliverable Lead Beneficiary Type Dissemination Due Delivery
number level date date
D6.2 QUB Other PU M36 M36
Editor Per Salomonsson
Authors Louise Kregting
Pál Schmitt
Lilian Lieber
Ross Culloch
Nicholas Horne
David Smyth
Powerkite Horizon 2020/RIA Contract number: 654438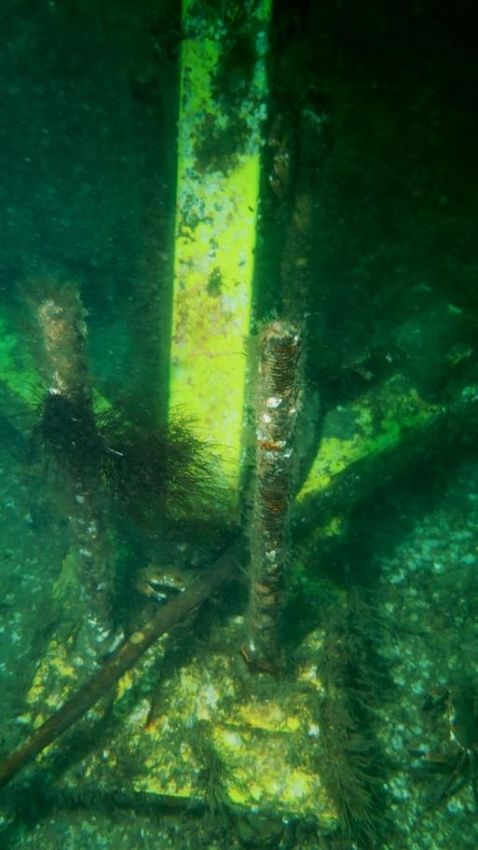
D6.2 Environmental Impact Report
Document history
Kregting, Version Author Beneficiary Date Comment
Louise
1 Kregting, Louise QUB 2018-12- Draft 1
10
2 Kregting, Louise QUB 2018-12- Draft 2
13
3 Kregting, Louise QUB 2018-12- Final
19
For any use or reproduction of photos or other material that is not under the EU copyright, permission
must be sought directly from the copyright holders.
How to cite this report: Kregting L, Schmitt P, Lieber L, Culloch R, Horne N, Smyth D. 2018. D6.2
Environmental Impact Report of the H2020 project PowerKite. Queen’s University Belfast, Northern
Ireland, UK.
1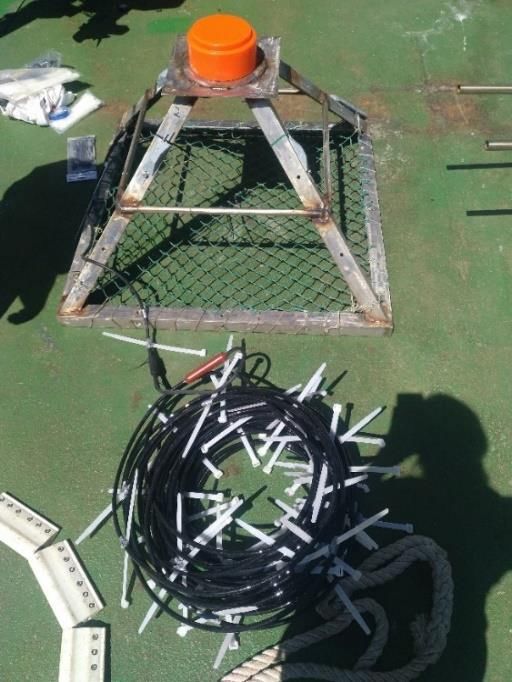
D6.2 Environmental Impact Report
Content
DOCUMENT HISTORY ............................................................................................................................................................... 1
CONTENT .................................................................................................................................................................................. 2
INTERNAL APPROVAL ............................................................................................................................................................... 3
ABBREVIATIONS/ACRONYMS ................................................................................................................................................... 4
1. EXECUTIVE SUMMARY ..................................................................................................................................................... 5
2. BACKGROUND AND SCOPE........................................................................................................................................... 7
3. COLLECTION OF ENVIRONMENTAL DATA ................................................................................................................... 8
3.1 NOISE MEASUREMENTS ......................................................................................................................................... 8
3.1.1 SUMMARY .......................................................................................................................................................... 9
3.2 COLLISION RISK MODEL (CRM) ......................................................................................................................... 9
3.2.1 DEVELOPING THE PARAMETERS FOR THE CRM ........................................................................................... 9
3.2.2 COLLISION RISK MODEL DEVELOPMENT SUMMARY ....................................................................................10
3.3 SONAR SYSTEM DEVELOPMENT..........................................................................................................................10
3.3.1 SONAR SYSTEM DEVELOPMENT SUMMARY...................................................................................................11
3.4 ECHOSOUNDER DEPLOYMENT ..........................................................................................................................12
3.5 CONCURRENT ACOUSTIC DOPPLER CURRENT PROFILER (ADCP) CHARACTERISATION ........................13
3.5.1 CONCLUSION.................................................................................................................................................15
3.6 VEMCO RANGE TESTING ..................................................................................................................................15
3.7 BENTHIC SURVEY.................................................................................................................................................16
3.7.1 RESULTS: SHANNON DIVERSITY INDICES .....................................................................................................17
3.7.2 SITE SPECIFIC COMMUNITY ANALYSIS SIMPSON INDEX ..............................................................................17
3.7.3 DISCUSSION ....................................................................................................................................................20
3.7.4 CONCLUSION.................................................................................................................................................22
4. OUTPUTS .......................................................................................................................................................................23
5. CONCLUSION................................................................................................................................................................25
6. REFERENCES ...................................................................................................................................................................26
2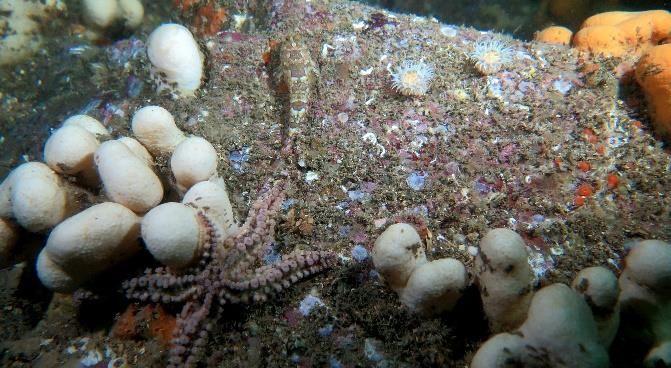
D6.2 Environmental Impact Report
Internal Approval
Coordinator signature
Digitalt signerad av Per
Name
Per Salomonsson
DN: cn=Per Salomonsson, c=SE,
Company Date
o=Midroc,
Salomonsson email=per.salomonsson@midroc.se
Datum: 2018.12.20 10:42:29 +01'00'
Reviewer signature
Name Company Date
Patrik Pettersson Minesto AB 20 Dec, 2018
3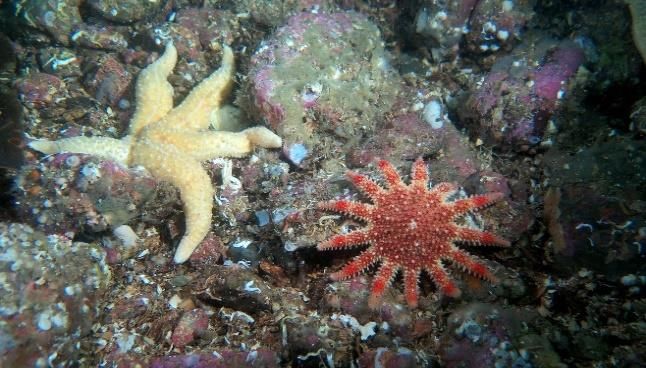
D6.2 Environmental Impact Report Abbreviations/Acronyms ADCP Acoustic Doppler Current Profiler CRM Collision Risk Model EIA Environmental Impact Assessement JNCC Joint Nature Conservation Committee LSR Listening Space Reduction MMO Marine Mammal Observer MRE Marine Renewable Energy PTO Power Take-Off QUB Queen’s University Belfast SAC Special Area of Conservation TEC Tidal Energy Converter 4
D6.2 Environmental Impact Report 1. Executive summary This report is a deliverable of the Powerkite project, a Horizon 2020 project funded by the European Union’s research and innovation programme. The Powerkite’s project main objective was to design, build and deploy a power take-off (PTO) system for the novel tidal energy concept Deep Green referred to in this document as the ‘kite’ and as part of Work Package (WP) 6, gaining a better understanding of the potential environmental interactions of the device. The environmental impact report D6.2 is the final report for WP 6 Environmental Impacts and describes the results of the environmental data collected as part of WP 2 detailed in deliverable D2.10, during the project. This report provides details on the noise measurements, the Collision Risk Model (CRM), the development of the sonar system to visualise animal movement as well as the benthic surveys. Noise data of the PTO system was initially characterised during varying modes of kite operation using a drifting hydrophone methodology (Schmitt et al. 2018). The study found that the largest variation in sound emissions of the kite was due to changes in turbine revolution, while kite flying speed and tether twist had less influence on overall sound levels. Collection of the natural noise data was also undertaken in winter and summer to capture the seasonal variation in ambient and anthropogenic noise in the Narrows. Using both the seasonal noise of the ambient environment and noise data of the PTO, a successive ecological study was conducted to develop a method to evaluate the potential zone of influence that operational devices may have on marine fauna (Pine et al. 2018; Special Issue in Renewable & Sustainable Energy Reviews, accepted). Auditory masking (the interference of important biological signals by anthropogenic noise) was assessed to evaluate the effects of noise from two diverse operational marine renewable energy (MRE) tidal turbine devices (the ¼ scale kite and a horizontal axis turbine) on the listening space of marine mammals. Listening space reductions (LSR) were influenced by type of turbine, species, and season. LSRs were highest during winter, characterised by low ambient noise conditions. The LSR method provides a significant advance to the MRE community as not only can the cumulative noise field from an array of turbine devices be modelled using this approach, the LSR method can also be applied to any MRE device. A CRM that was initially developed by Schmitt et al. (2017) using FreeCAD (freecadweb.org) has now been translated and extended using an alternative open-source game engine called Blender (blender.org) that will allow for a more robust approach to running simulations at less computational cost (e.g. including speed and angles of approach). This enables the development of a tool to calculate collision risk probabilities in a user-friendly environment that can be adopted for case-specific scenarios and devices to better inform environmental impact assessments (EIAs). From an ecological perspective, integrating empirical data (e.g. dive profile data from telemetry tags) with probability distributions obtained from the CRM does significantly reduce the risk of collision, as compared to a uniform distribution (Culloch et al., 2017). Using three Kongsberg Mesotech M3 multibeam sonar heads, optimisation of this system (mounting configurations and orientations) was undertaken and documented to evaluate fine-scale (10s of meters) interactions of seals and other large, mobile marine fauna with the kite. To develop an autonomous and user- friendly observation system that can eventually detect, track and differentiate marine megafauna from other high- intensity targets in the water column (e.g. debris, turbulent features), an automated software (M³ Track) is currently being developed in close collaboration with the sonar manufacturer Kongbserg. While written in the Matlab (MathWorks) programming environment, this is now a more user-friendly, stand-alone software (aimed for MRE developers) to be run alongside the generic M3 software, producing log files of animal two- or three- dimensional positions (x,y,z) underwater from which tracks, trajectories and relative speeds can be extracted. While initially, simulations (10s of simultaneous targets) were run in M³ Track, dummy targets as well as drifting debris were detected and tracked among the different sonar heads in real time. So far, no seals have approached the near-field kite area while the kite and the sonar were in operation. It is anticipated that following further fine- tuning and re-deployment of the sonar system in 2019, the system can be run full-time during future operation. 5
D6.2 Environmental Impact Report Benthic surveys were undertaken in order to assess the ecological composition (e.g, sediment-associated fauna) of the Minesto site and two controls prior to installation and 5 years later. No impact on benthic communities were detected owing to the operation and deployment of the infrastructure associated with the kite at the Minesto site. There were also no changes at the two control sites. While not stastically significant, a trend towards an overall increase in biodiversity was recorded. Whilst meeting the deliverables in WP6, several general knowledge gaps were identified and also addressed during the project, leading to the development of new approaches to provide improved environmental and ecological insight. For instance, there was a lack of knowledge on how seals associate with fine-scale physical structures in high flow environments. For this, a survey was conducted and the study was published (Lieber et al. 2018; Ecological Indicators) to inform site usage at the early stages of EIAs. Also, as high flows interacting with man- made structures can generate wake structures characterised by extreme macro-turbulence, the impact of localised wakes (both natural and anthropogenically-generated wakes) on top predators was assessed, using shallow plunge-diving seabirds as study Photo credit: Lilian Lieber species (Lieber et al. 2018, under review). Lieber Finally, while the application of VEMCO acoustic telemetry for fish tracking and monitoring is not new, VEMCO applications in high flow environments are still rare and relatively unexplored. Working with the company, a range test with two novel high-frequency receivers (180kHz HR2) was conducted to test the system’s detection limits in the vicinity of the kite. Increasing ranges (20m-150m) were assessed under varying tidal (flood, ebb, spring, neap) and meterological conditions and detections will be analysed after the end of the project. This is the final Environmental Impact Report D6.2 (M36). 6
D6.2 Environmental Impact Report
2. Background and scope
Since SeaGen, the worlds first grid connected tidal energy device in 2008, 10 years on we are only now seeing
the emergence of other full- scale tidal energy devices, including the Kite technology (https://minesto.com)
developed by Minesto. There remains a great concern surrounding the environmental impacts of the moving
parts and associated noise of devices on marine fauna. This data gap is reflected in the very few full-scale
operational turbines currently in existence. The limited field-based quantitative studies available on, for example,
collision risk, have been on fish and have been for fixed horizontal axis turbines that were either operationally
limited or not in operation at the time of the observations (Broadhurst & Barr 2011, Hammar et al. 2013, 2015).
Having access to the kite, a quarter-scale prototype tidal energy converter under test in Strangford Lough,
Northern Ireland, has provided us with the opportunity to gather environmental data during periods where the
kite was operational, as well as environmental data from the surrounding (near-and far-field) dynamic
environment to make predictions on the potential risk that such energy devices may pose on the environment.
This project therefore allowed us to gather data from a working prototype tidal energy converter (TEC) in
realistic flow conditions, thereby identifing and reporting on the issues and challenges associated with collecting
data in these highly dynamic environments. Monitoring the noise of TECs and gaining a better understanding of
the collision risk posed to marine animals, such as marine mammals, seabirds, basking sharks, turtles or teleost
fish with tidal turbine devices is considered one of the key challenges when determining the potential
environmental impacts of marine renewable devices. The challenges arise owing to a highly dynamic environment
characterised by high flow velocities, associated turbulence, and generally low visibility.
Unlike conventional horizontal axis turbines, the entire kite is ‘dynamic’ as the only static component of the
device is the mooring located near the seabed, with both the tether and kite continuously moving through the
water column (Fig. 1a & b). Any work that is carried out therefore needs to consider the movement of the entire
structure which occupies a volume of water considerably larger than horizontal axis turbines.
The overall objective of the environmental WP 6 was to assess the environmental interactions of the kite with
marine megafauna, flow, noise and benthic organisms. The aim of D6.2 is to report on the analysis and results of
the environmental data collected during the Powerkite project and is a continuation from D2.10.
This is the final Environmental Impact Report of the results to month 36.
a b
Image credit: Minesto
Figure 1. The components of the kite (a) and the figure-of-eight trajectory of the kite underwater(b).
7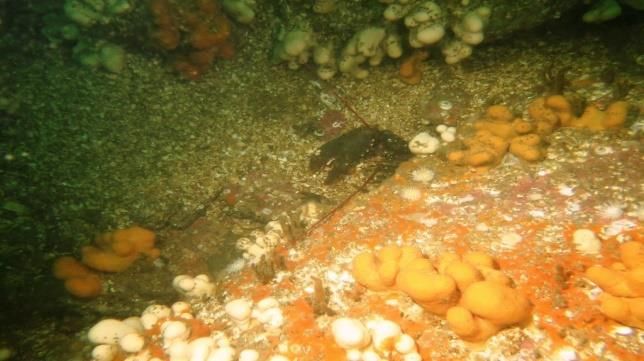
D6.2 Environmental Impact Report
3. Collection of environmental data
This section focused on the results of the environmental data in order to assess the kite’s influence on, and the
interaction with, the marine environment (Fig. 2). The particular aspects of the environment that this work
package has focused on include: noise, collision risk of animals with the device and determining the influence of
the kite on benthic communities within the vicinity of the operational area. However, several general knowledge
gaps were further identified and also addressed during the project to provide improved environmental and
ecological insight. Including: How seals associate with fine-scale physical structures in high flow environments,
the impact of localised wakes (both natural and anthropogenically-generated wakes) on top predators was
assessed, using shallow plunge-diving seabirds as study species and finally, the application of VEMCO fish tracking
and monitoring equipment in high flow environments, discussed in section 3.6.
Photo credit: Alex Nimmo-Smith
Figure 2. Minesto’s site in the Narrows tidal channel, Strangford Lough, Northern Ireland, UK
3.1 Noise measurements
Originally, two separate noise studies were carried out in order to meet the deliverable aims of D2.10 and D6.2
of the Powerkite project. The first study was to investigate the background (ambient) noise in the environment
to provide a baseline to determine the natural variability of noise in an operational flow environment. The second
study carried out was to understand the noise emitted by the PTO system in operating field conditions.
The work progressed beyond simply characterising the ambient noise and characterising the PTO by
amalgamating the two studies into a beneficial application for the marine renewable community. Essentially a new
method was adopted, referred to as the listening space reduction (LSR) method to provide ecological context
to the noise propagated by a device. Instead of determing the footprint of the noise from a single device (Bassett
et al. 2013, Schmitt et al. 2015, Lossent et al. 2018), auditory masking (the interference of important biological
signals by anthropogenic noise) was assessed to evaluate the effects of noise from two diverse operational MRE
tidal turbine devices (the kite and a horinzontal axis turbine) on the listening space of marine mammals. Season
was also taken into account when assessing the noise, a factor never considered before by the MRE industry.
Two manuscripts have resulted from the noise measurement work, one published and one accepted at the time
of writing:
• Schmitt et al. 2018a; JASA Express Letters
• Pine et al. 2018; Special Issue in Renewable & Sustainable Energy Reviews, accepted).
See section 4. for full details including the analysis and results within these publications.
8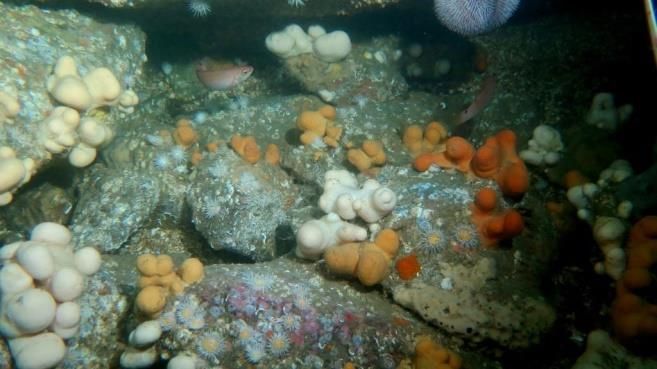
D6.2 Environmental Impact Report 3.1.1 Summary Overall, the study of the PTO noise during varying modes of kite operation found that the largest variation in sound emissions of the kite was due to changes in turbine revolution, while kite flying speed and tether twist had less influence on overall sound levels. The main results from the LSR manuscript were that active LSR were influenced by type of turbine, species, and season. LSRs were highest during winter, characterised by low ambient noise conditions. Further, the LSR method provides a significant advance to the MRE community as not only can the cumulative noise field from an array of turbine devices be modelled using this approach, the LSR method can be applied to any MRE device. 3.2 Collision risk model (CRM) Possibly the greatest concern regarding the infrastructure of MRE devices in the environment is the collision risk with mobile marine fauna and, as a consequence, this is a primary concern for consenting, permitting and licensing of tidal developments (Copping et al. 2016). While there have been no known collisions observed or recorded with the few prototypes currently in existence, there is still a great uncertainty (Hutchison & Copping, 2016). This uncertainty is primarily due to the limitation in research on collision owing to the few full-scale operating MRE devices in existence or because the device is shutdown during operation if a ‘target’ is observed within the vicinity of the device, as was the case for SeaGen (Royal Haskoning 2012) and is the case for the kite in Strangford Lough under the current license. The concern of an animal colliding with the kite is paramount in Strangford Lough, which is a Special Area of Conservation, with harbour seals (Phoca vitulina) listed as a qualifying feature. Currently, to meet the environmental requirements for field testing the kite in Strangford Lough, Minesto must ensure that marine mammal observations by a trained marine mammal observer (MMO) are undertaken whilst the kite is operational. This is costly and MMO observations are limited to animals that are close to or at the surface. While direct observations of animal movements and behaviour in the vicinity of devices is considered the best method to evaluate the risk (ABPmer 2010), the highly turbid waters make visual observations underwater logistically impossible. Consequently, in an effort to quantify the probability of collision risk in such a challenging environment, the use of CRMs has become commonplace. In order to inform the CRM, a variety of components are required, including: population dynamics, animal movement and behaviour and specific information on the tidal device (e.g. rotor swept area, rotational speed). The more information used and the more accurate that information is, the better the model will be at predicting collision risk. This section is a continuation of deliverable D2.10. In D2.10 which included a detailed summary of the translation of the original CRM (Schmitt et al. 2017) into alternative software, Blender (blender.org). 3.2.1 Developing the parameters for the CRM Blender (blender.org) was chosen as the new platfrom for the CRM as it can provide additional outputs, such as relative velocity of a collision. This has also improved simulation speeds (i.e. computational processing time has been greatly reduced). Continued development in this framework will enable increased flexibility of inputs and outputs. Currently the second output, based on Culloch et al. (2017) will be finalised after the end of the project. However further outputs are expected as Queen’s University Belfast (QUB) with academic partner University of the Highlands and Islands has an Interreg funded PhD through the Bryden Centre for Advanced Marine & Bio Energy Research (www.brydencentre.com) working to develop further the CRM. The industrial partners involved are Minesto and Marine Scotland Science, and this work is a direct continuation of the Powerkite project. 9
D6.2 Environmental Impact Report
Anticipated outputs include:
• Development of the model for different marine renewable devices (to be presented at EWTEC 2019)
• Sensitivity Analysis
• Speed of collision
3.2.2 Collision risk model development summary
The development of the CRM will be ongoing beyond the end of the project. A fully three dimensional, transient
model of the kite and animal shape has been developed and published in Schmitt et al. 2017. The second
publication in preparation will use exising data on harbour seal behaviour and ecology, such as animal shape, swim
speed and dive angle and has been presented at three conferences (see below Section 4). Work on the CRM will
remain ongoing via an Interreg funded Bryden Centre PhD that involves academia, industrial and Governmental
partners.
3.3 Sonar system development
Hydroacoustic methods have emerged as a powerful tool for the environmental monitoring of MRE devices
(Lieber et al. 2014, Melvin & Cochrane 2014, Francisco & Sundberg 2015, Williamson et al 2016, Cotter et al.
2016, Fraser et al. 2017). Using imaging multibeam sonar systems, mobile marine vertebrates (marine mammals,
fish and diving seabirds) can be detected and tracked in real time, allowing for the collection of near-field,
ecologically relevant data that can be used in the CRM. Moving away from manned operations, self-contained
high-frequency multibeam sonar systems allow autonomous, subsurface monitoring of MRE installations for
longer time scales (weeks to months) and can be operated in areas in which traditional boat surveys are less
effective (i.e. fast flows). Tidal MRE devices are naturally installed in extremely energetic, acoustically noisy
environments and tidal streams continue to pose a challenge to meaningful acoustic data collection, analysis and
interpretation; i.e. the extraction of biological targets from turbulence (Fraser et al. 2017).
Photo credit: Alex Nimmo-Smith
Figure 3. Minesto’s site in The Narrows tidal channel with a M3 multibeam sonar swath set to 50m range mounted
from Minesto’s barge (insert), for scale visualisation of the hydroacoustic monitoring approach.
The overall aim of the sonar development and acoustic monitoring approach undertaken here was to obtain
subsurface data to better understand collision risk between the kite and mobile marine fauna. The specific
objective was to understand the spatio-temporal variability in seal and fish presence around Minesto’s site (Fig.
3), and how it corresponds to fine-scale changes in hydrodynamics (e.g. velocity, shear, turbulence, and back-
10 D6.2 Environmental Impact Report eddies). Near-field data on animal movement, depth and trajectories, including possible evasive behaviour, can further provide site-specific, ecological data to be used in the CRM (see section 3.2). Since the deliverable D2.10, delivered in M30 (June 2018) of the Powerkite project, there has been no further progress of the sonar development as the sonar system was sent back to the manufacturers after a fault was detected during the July/August 2018 deployment. However, further acoustic data were collected using a calibrated wideband scientific echosounder (Simrad) designed for fishery research applications. Further, another Sentinel Acoustic Doppler current profiler (ADCP) deployment was conducted at Walter’s Rock (250m southeast of Minesto’s barge) covering 6 weeks in the months of July and August 2018. 3.3.1 Sonar system development summary As multibeam sonar as a tool for environmental monitoring is still under development at various sites globally, there is no single solution yet concerning optimal configurations. Further, machine learning algorithms to detect, track and classify marine life are still immature and far from universal, highlighting the importance of further developing sonar as a monitoring tool at the site. Since the purchase of the sonar system in month 13, and therefore over a year delayed in the project, there has been considerable development of the system, including: sonar trials performed by imaging the kite flying from the barge and tethered from the seafloor, using drifting dummy targets to test the capabilities of the sonar to visualise targets at increasing distances from the sonar head, different seabed frame positions and head configuration optimization, detailed in D2.10. Finally, the on- going development of the more user-friendly, stand-along tracking software has made considerable progress since the initial development in Matlab (Fig. 4). The software is now running alongside sonar data recording and can alert the user when objects are approaching the kite area. This work has resulted in one publication (Lieber et al. 2017) and two conference presentations (See section 4). Figure 4. Custom-built M3 sonar software (M³Track) interface during the development phase (100m range shown in sonar swath). The target track shown (bottom left) is generated from a drifting dummy target. 11
D6.2 Environmental Impact Report
3.4 Echosounder deployment
Further acoustic data was collected using a Simrad EK80 wideband Transceiver (WBT) driving a ES70-18CD
wideband split beam transducer (nominal operational frequency 70 kHz; beamwidth 18 degrees) designed for
fishery research applications. The EK80 was deployed at Minesto’s site on 19/07/2018 and retrieved on
03/09/2018 (Fig. 5). However, the echosounder was not run continuously as several power issues emerged
(including limited solar power to charge the remote battery supply on the barge, as well as periods of severe
acoustic contamination).
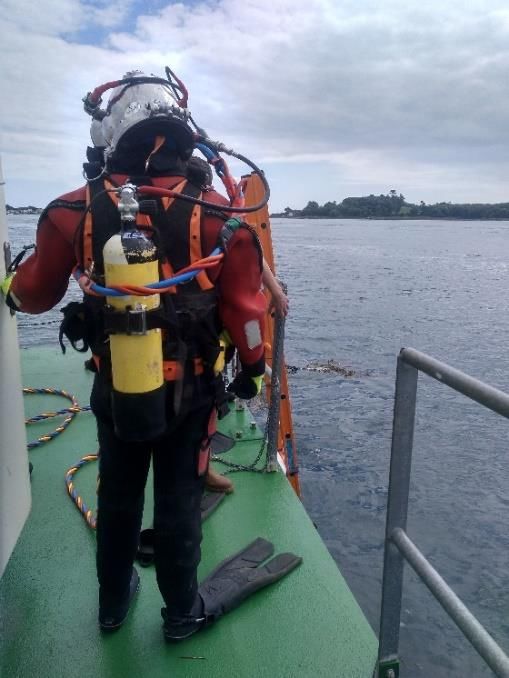
Photo credit: Lilian Lieber Photo credit: Lilian Lieber
Figure 5. Frame-mounted, upward-facing echosunder transducer (left) deployed at Minesto’s site using surface-
supplied, commercial divers (right) on 19/07/2018.
sea surface
bubble intrusion
Figure. 6. Upward-facing echosounder daytime data showing a timeline of approx. 4 minutes of raw data
(visualised in Echoview software) collected on 27/07/2018 13:09:33 to 27/07/2018 13:13:27. Surface bubble
intrusion in red is visible at the top, whereas individual fish-like objects are visualised throughout the water
column. Data collection settings: ‘Normal’ operation, 25m range, ping mode=interval (200ms), ‘no bottom
detection’.
12 D6.2 Environmental Impact Report
The EK80 echosounder data (Fig. 6) is currently being post-processed by Kongsberg using Echoview software
and will be analysed at QUB using Matlab, thereby applying filtering approaches as developed and described in
section 3.5 below to acoustically identify and summarise water column scatterers.
3.5 Concurrent Acoustic Doppler current profiler (ADCP) characterisation
In order to better understand the hydrodynamic processes driving seal passes and water column usage at the
site, current velocities and tidally driven oceanographic features were concurrently collated using Acoustic
Doppler current profilers (ADCPs) (Fig. 7).
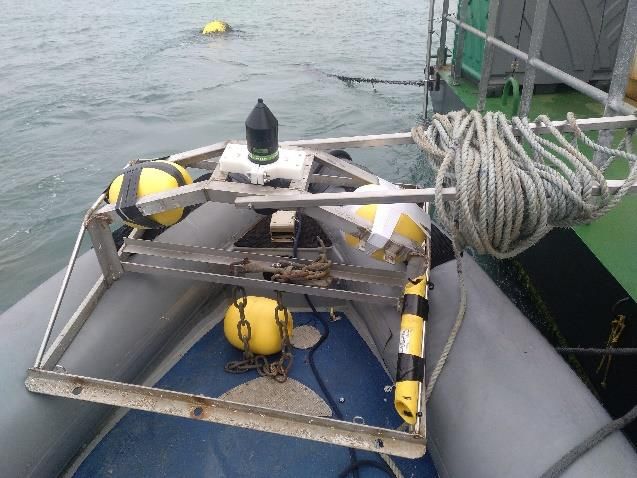
Photo credit: Lilian Lieber
Photo credit: Lilian Lieber
Figure 7. ADCP and sonar frame prior to a seabed deployment (left) and close-up of RDI’s 5-beam sentinel V50
ADCP for long-term deployments (right).
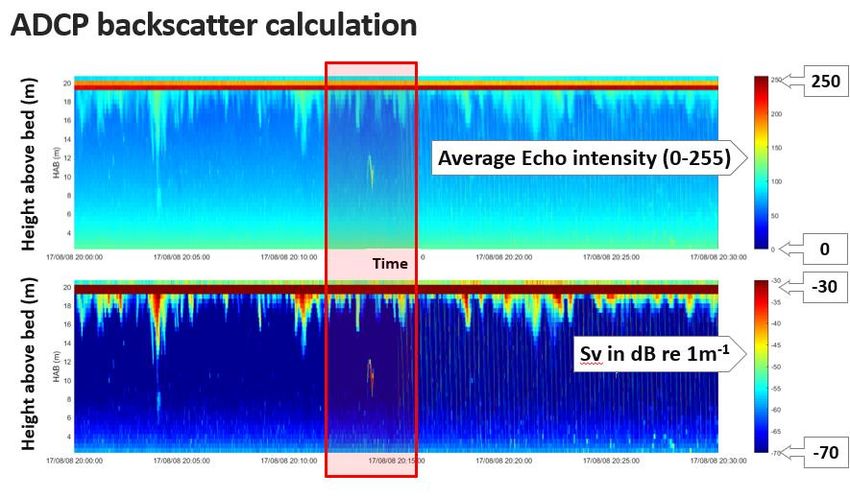
Besides velocity measurements, ADCPs are able to determine the intensity of received echoes (total acoustic
backscattering, measured in RSSI (Received Signal Strength Indicator) (also known as AGC: Automatic Gain
Control) voltage counts over a finite volume. Such ADCP-derived quantifications of echo intensity can be
converted to backscattering strength (Sv, measured in decibels, dB), giving information on mid-water, bio-physical
targets. High values of scattering can be associated with zooplankton, fish, suspended sediment or turbulence,
such as enhanced surface bubble entrainment indicative of macro-turbulence (Lieber et al. 2018).
Here, this approach was undertaken to quantify acoustic scattering in the water column in order to ground-truth
or cross-reference multibeam acoustic images of marine life and physical features later. Volume-backscattering
strength was integrated over a finite volume (maximum of 40 bins) from the ADCP’s recorded raw echo intensity
data using a working version of the sonar equation as described in Deines (1999). Applying Deines’ equation
here, backscatter calculations accounted for time-varying gain (TVG), the absorption loss away from the
transducer, transmit pulse length and beam-specific sensitivity coefficients, making it a more robust and
quantifiable measure compared to raw echo intensity which can be more readily extracted from ADCP data (Fig.
8).
Acoustic backscattering techniques provide a powerful tool to remotely investigate bio-physical water column
properties over a large range of spatial and temporal scales. However, the biggest challenge in highly energetic,
turbulent environments remains reliable target extraction, as common algorithms from fisheries acoustics
generally do not apply. Physical signatures (boundary layer macro-turbulence and bubbles; microstructure (e.g
vortices), suspended sediment) can have comparable backscattering strength as biological targets and are often
co-located.
13 D6.2 Environmental Impact Report Figure 8. An example of RDI’s Sentinel V50 (500kHz) ADCP average echo intensity raw data (upper panel) from a 20min-burst versus conversion of the data into Sv in dB re 1m-1 (lower panel). Therefore, using the Sentinel V50 data set, a workflow in Matlab was written to (the following is intended as an example): 1) filter physical boundaries from mid-water targets, 2) threshold the data set based on backscattering strength (-45dB) and, 3) find and remove objects that may be too small or transient to represent fish shoals (
D6.2 Environmental Impact Report
3.5.1 Conclusion
This is the first study using three synchronised multibeam sonar heads with concurrent ADCP measurements to
assess fine-scale water column use of marine vertebrates around a tidal turbine. Initial acoustic data demonstrated
the efficacy of the M3 sonar to successfully detect mid-water targets in the vicinity of the kite. Although potential
animal-kite interactions at the site are still uncertain, the approach shown here will enable the collation of
valuable, three-dimensional data on animal movement across varying, hydrodynamic conditions around Minesto’s
novel device or elsehwere. The additional use of high-resolution, concurrent ADCP data will aid in a better
understanding of animal presence and behaviour at the site through the bio-physical characterisation of a 3D
domain. Finally, all in-situ collected acoustic measurements will provide empirical data to better inform collision
risk models here as well as around other high-energy sites globally.
As this work took place in August 2018, analysis of the data is ongoing and the final results will be published after
the project has ended.
3.6 VEMCO range testing
Acoustic telemetry uses high frequency sound (e.g. 69 & 180kHz) to transmit information. Typical systems include
a transmitter (tag) and a hydrophone receiver. Applications include the monitoring of fish moving quickly through
acoustic gates (gate=an area between two hydrophone receivers with overlapping detection ranges), or the
frequent and precise positioning of fish (i.e. sub-meter depending on tag transmission rate). VEMCO receivers
are essentially hydrophones picking up frequencies from specific tags that may be inserted into animals (e.g. fish
or seals). VEMCO tags transmit a burst (sequence) of pulses of a continuous-wave frequency, in this case, 180
kHz. The tag itself has a specific identification number so that you can pinpoint a specific detection to an individual
animal.
The receivers trialled in this study are relatively new in the field and therefore required range testing. The ranges
a tag can be detected within may be up to 200-300m, but detection range will be affected by flow and turbulence
rates, possibly also by the noise of the kite at minesto's site or other acoustic instruments. The objective of this
VEMCO range test was to test the feasibility of tagging fish in the future and releasing them in the vicinity of the
kite to collect real positional data for the collision risk model. The 180kHz HR2 Receiver is a submersible and
autonomous receiver capable of decoding traditional PPM (pulse position modulation) and the new HR
transmissions at the same time (Fig. 10).
Photo credit: Lilian Lieber Photo credit: Lilian Lieber
Figure 10. VEMCO V9 HR Range Test Tags (left) and custom-made bracket and frame for seabed deployment.
Deployment notes: Frame modified by Aidan Flaherty, Queen’s University Belfast (QUB) and Joel Hoy, Minesto.
Receiver bracket manufactured by Aidan Flaherty (QUB). Tag brackets for deployment onto barge/mooring
chains manufactured by Joel Hoy.
15 D6.2 Environmental Impact Report
For the range test (April – December 2018), the VEMCO range test tags were not attached to animals, but
attached to relatively stationary infrastructure, such as Minesto’s barge or submerged mooring chains. The two
available receivers were mounted onto modified seabed frames using custom-built brackets and deployed at
increasing distances to the tags over time. Each range was trialled for weeks at a time to cover a large variation
of meteorological and tidal conditions. Data will be analysed for detections of tags in the receiver data to assess
the effects of distance and environmental conditions.
3.7 Benthic survey
There are relatively few peer-reviewed, published articles which have direct relevance to the assessment of
environmental impacts from operational marine renewable devices, primarily because there has only been one
operational ‘full scale’ turbine to date, SeaGen (O’Carroll et al. 2017). It can be argued that the company Minesto
and their Deep Green technology (The Kite) have only tested scaled turbines in Strangford Lough, Northern
Ireland and therefore impact would be minimal. However, the site has had continuous activity over a four-year
period and includes infrastructure similar to that needed for a ‘full’ scale kite including; the foundation, sea-floor
cables, daily boating activity and noise of the kite either flown from the barge or seafloor. In effect the area has
been operational since 2012 with the testing of a 3-meter wing device.
This report presents analysis of benthic data which provides direct, scientifically sound, evidence of the impact
that testing has had on the immediate vicinity and nearby locations and their associated benthic communities. It
is important to reiterate how crucial the monitoring of environmentally sensitive habitat types and Special Area
of Conservation (SAC) such as Strangford Lough are. The need for long-term monitoring is imperative as it may
take time for detrimental ecological changes to manifest within the flora, fauna and the biological functionality of
the ecosystem. This report therefore is a continuation of D2.10 (Collection of Environmental Data Report) and
describes the results from an industry approved robust tested methodology carried out during the months of
July-August 2012 and replicated again in August 2017.
A D
B
Figure 11. Survey sites Ballyhenry Bay (A, B, D) are typified by a mixed shell cobble substrate and with current
speeds of approximately 1.5 m/s on spring tides (site B powerkite take-off installation)
16 D6.2 Environmental Impact Report 3.7.1 Results: shannon diversity indices In deliverable D2.10, methods employed for the benthic analsyis were a compass rose transect methodology at all sites (Fig. 11) and images were analysed using Coral Point Count© software with the Microsoft Excel© extension (CPCe©) where 100 random points were overlaid onto each individual image taken underwater. The imagery overlay points act as non-biased observation markers from which quantitative data on benthic disturbance could be assessed. The Shannon Diversity index represents a measure of the species diversity within a community and can be used as a quantifiable measurement of change. Typical values are generally between 1.5 and 3.5 in most ecological studies, and the index is rarely greater than 4. The lower an index score is the less species diverse the representative community. Therefore a Shannon index can be employed to measure environmental change overtime if baseline data exists. The index provided an excellent tool when the assessing any disturbance or detrimental impact to the benthos at the kite installation site. The Shannon Diversity Index at all sites over the five-year period can be considered low as no individual index was recorded above 1.50 (Fig. 12). These values are representative of similar energy dynamic habitats in other regions of the UK and Ireland (Connor et al. 2004). The two control sites of A and D revealed virtually no change in species diversity over the five year period. The kite installation site B however revealed a slight increase in species diversity (Fig. 12). Although variations existed in diversity index and survey year between the sites a PERMANOVA could not detect any significant difference F= 1.37, P> 0.3. Figure 12. Shannon Diversity comparison between all three survey sites (2012) pre and (2017) post Power Take Off system. (Sites A and D- control / site B installation) 3.7.2 Site specific community analysis simpson index In order to compare site specific differences between key species and substrate types, CPCe © was used to calculate the Simpson Index for each site and year. This was a combination of a direct estimate of species richness (the total number of species in the community, S) with a measure of species dominance. Key species within taxonomic groups and substrate surface features were selected from Joint Nature Conservation Committee (JNCC) biotope descriptions for sites with similar hydrodynamics within the UK as per Connor et al. (2004). The CPCe© analysis revealed a similar level of species richness and dominance at both control sites A and D (Fig. 13). However, site B showed an increase in the Simpson Index from seven of the 11 categories (Fig. 14). Additional multivariate analysis using PERMANOVA however did not reveal any significant differences in species richness or species dominance F= 3.04, P> 0.5. 17
D6.2 Environmental Impact Report Figure 13. Data comparison between years of CPCe species codes and substrate type. Categories match those listed in the Figure 14 18
D6.2 Environmental Impact Report Figure 14. Variations in component % in the Simpson Index within groups and substrate features. 19
D6.2 Environmental Impact Report
3.7.3 Discussion
A major concern for habitat managers in regards to subsea construction is the effect that non-natural
topographical additions and their assemblages will have on the existing benthic environment. The introduction of
a manmade hard substrate into a sensitive marine environment has the potential to change the surrounding
ecological characteristics significantly as the newly introduced structure has the capability to act as an ‘artificial
reef. Previous research into the impact of offshore subsea construction has shown these anthropogenic artificial
reefs may alter local hydrodynamics, sediment transport patterns and the indigenous flora and fauna. This was a
particular concern within the designated Marine Conservation Zone of Strangford Lough which is home to several
unique biotopes and endemic species. Site selection and installation of the kite system was therefore subject to
strict legislation.
The recent 2017 subtidal environmental impact survey of the Minesto site recorded images of the anchor
foundation footings (Fig. 15). It is evident within the images that the structure has now become integrated and
homogenised into the surrounding environment with no species barren periphery or boundaries recorded.
Photo credit: Louise Kregting Photo credit: David Smyth
Figure 15. Sub-sea anchor points for kite mooring 2017.
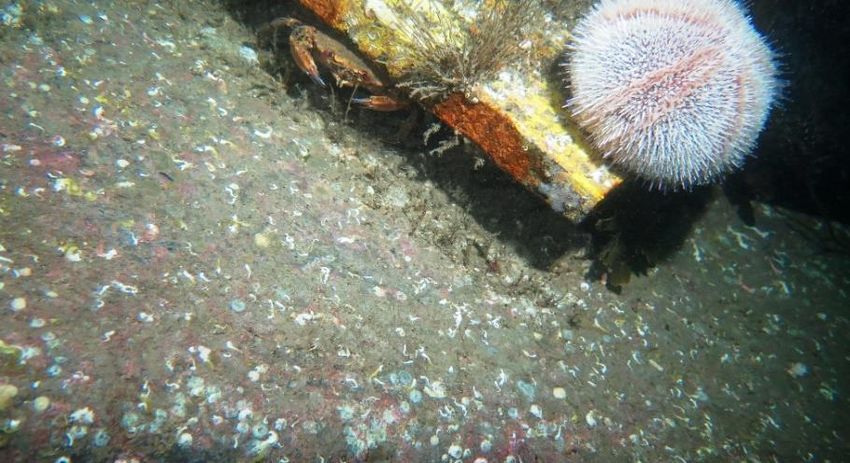
Furthermore a comparison of images recorded during 2012 (Fig. 16 & 18) and 2017 (Fig. 17 & 19) revealed no
differences in indigenous species make-up which was reflected in Figures 12 and 13 and the subsequent
PERMANOVA’s. Although not statistically significant, comparisons of the imagery data collected at the kite site
(B) indicate a slight increase in species richness and diversity.
20 D6.2 Environmental Impact Report
Photo credit: David Smyth Photo credit: David Smyth
Figure 16. Barge site B 2012 pre- Powerkite installation
Photo credit: David Smyth Photo credit: David Smyth
Figure 17. Barge site B 2017 post-kite installation
Photo credit Louise Kregting Photo credit Louise Kregting
Figure 18. Control site A 2012 pre-kite installation
Photo credit: David Smyth Photo credit: David Smyth
Figure 19. Control site A post-kite installation
21 D6.2 Environmental Impact Report The study also showed no specific species dominance, which is a good indicator of a stable benthic community and suggests that no detrimental impacts have been instigated by the commercial activity at the site. Indeed, the analysis would suggest that the installation has actually augmented the biodiversity at site B over the five years it has been in-situ. It is possible that this observation may be linked to differences in substrate and surface feature rugosity. The importance of long-term environmental monitoring of these assemblies however cannot be underestimated as recent research from Sweden׳s Lysekil wave energy site, highlights. Long-term monitoring of the site revealed newly established high concentrations of predators and settled suspension feeding bivalves around its foundations where previously none had existed. As this reported change is a relatively recent occurrence. It is still unclear what effect this will have on the benthic biological functionality of the site and ultimately whether this artificial reef scenario at Lysekil is beneficial to existing flora and fauna or not (Leijon et al. 2008). It is therefore recommended that the environmental survey of the Powerkite site is continued for at least another 10 years. This information would be extremely beneficial to any similar projects in the future as a 15 year successional colonization dataset could be used as a phased monitoring baseline to predict potential environmental impacts of other marine renewable sites. 3.7.4 Conclusion In conclusion, the operation and deployment of the infrastructure associated with kite had no resulting impact on benthic communities in the general locale. If anything, a trend towards increasing species richness and overall biodiversity was observed. 22
D6.2 Environmental Impact Report 4. Outputs Conference Oral Presentations Lieber L, Nilsen T, Zambrano C, Kregting L. Optimising multiple multibeam sonars to assess marine life interactions with an underwater kite. 12th European Wave and Tidal Energy Conference (EWTEC), Cork, Ireland, 2017. Lieber L, Nilsen T, Zambrano C, Kregting L. Assessing the effectiveness of multibeam sonar: Marine life interactions with a subsea kite in a tidal channel. European Cetatcean Society (ECS) conference, Middelfart, Denmark, 2017. Lieber L, Nimmo-Smith WAM, Waggitt JJ, Nilsen T, Kregting L. Advancing multi-scale hydroacoustic monitoring in highly energetic environments: From fine-scale target tracking to top predator occupancy patterns in a tidal channel. Environmental Interactions of Marine Energy Technologies (EIMR) conference, Orkney, 2018 Culloch R, Schmitt P, Horne N, Lieber L, Molander S, Hammar L, Kregting L. Integrating empirical data with probability distributions from a numerical 4-D model to assess marine mammal collision risk with marine renewable energy devices. Environmental Interactions of Marine Energy Technologies (EIMR) conference, Orkney, 2018 Conference Posters Lieber L, Nilsen T, Zambrano C, Kregting L. Assessing marine life interactions with a subsea kite in a tidal channel using active acoustics. 21st European Elasmobranch Association (EEA) conference, Amsterdam, the Netherlands, 2017. Culloch R, Schmitt P, Lieber L, Kregting L. Integrating empirical data with probability distributions from a numerical 4-D model to assess marine mammal collision risk with a novel marine renewable energy device. European Cetatcean Society (ECS) conference, Denmark, 2017. Schmitt P, Culloch R, Lieber L, Kregting L. A numerical 4D Collision Risk Model. European Geosciences Union (EGU), Austria, 2017. Lieber L, Nilsen T, Glynn F, Kregting L, Advancing Hydroacoustic Monitoring in Highly Energetic Environments: Novel Insight into Multi-Scale, Top Predator Dynamics in a Tidal Channel. Ocean Sciences Meeting, Portland, OR, USA, 2018 Horne N, Schmitt P, Culloch R, Lieber L, Kregting L. Blender: Utilising a game engine to investigate environmental interactions of marine renewables. Environmental Interactions of Marine Renewables (EIMR) conference, Orkney, 2018 Lieber L, Nimmo-Smith WAM, Waggitt JJ, Kregting L. Localised anthropogenic wake generates a predictable foraging oasis for top predators. Frontiers and Horizons in Ecology conference, Queen’s University Belfast, 2018 Publications Kregting L, Schmitt P, Culloch R, Lieber L. 2016. D2.4 Environmental monitoring baseline report of the H2020 project Powerkite. Queen’s University Belfast, Northern Ireland, UK. Lieber L, Nilsen T, Zambrano C, Kregting L. 2017. Optimising multiple multibeam sonars to assess marine life interactions with an underwater kite. 12th European Wave and Tidal Energy Conference (EWTEC) conference proceedings, Cork, Ireland, 2017. 23
D6.2 Environmental Impact Report Schmitt P, Culloch R, Lieber L, Molander S, Hammar L, Kregting L. 2017. A tool for simulating collision probabilities of animals with marine renewable energy devices. PLoS One, 12(11), [e0188780]. DOI: 10.1371/journal.pone.0188780 Lieber L, Nimmo-Smith WAM, Waggitt JJ, Kregting L. 2018. Fine-scale hydrodynamic metrics underlying predator occupancy patterns in tidal stream environments. Ecological Indicators. 94, 397–408. doi: 10.1016/j.ecolind.2018.06.071. Schmitt P, Pine M, Culloch R, Lieber L, Kregting L. 2018. Noise characterisation of a sub-sea kite. The Journal of the Acoustical Society of America Express Letters. 144, 5. DOI: 10.1121/1.5080268 Kregting L, Schmitt P, Lieber L, Culloch R, Horne N, Smyth D. 2018. D2.10 Collection of environmental data report of the H2020 project PowerKite. Queen’s University Belfast, Northern Ireland, UK. Culloch R, Horne N, Kregting L. 2018. A review of Northern Ireland seal count data 1992-2017: Investigating population trends and recommendations for future monitoring. Available: https://www.daera- ni.gov.uk/publications/review-northern-ireland-seal-count-data-1992-2017-investigating-population-trends-and Lieber L, Nimmo-Smith WAM, Waggitt JJ, Kregting L. Localised anthropogenic wake generates a predictable foraging oasis for top predators (under review). Pine M, Schmitt P, Culloch R, Lieber L, Kregting L. Providing ecological context to anthropogenic subsea noise: assessing listening space reductions of marine mammals from tidal energy devices. Bryden 2018 Special Issue in Renewable & Sustainable Energy Reviews (Accepted). Smyth D, Kregting L. The detrimental environmental impact of sub-sea renewables is an unwarranted fear (In prep). Kregting L, Schmitt P, Lieber L, Culloch R, Horne N, Smyth D. 2018. D6.2 Environmental Impact Report of the H2020 project PowerKite. Queen’s University Belfast, Northern Ireland, UK. 24
D6.2 Environmental Impact Report 5. Conclusion This report is a deliverable of the Powerkite project, a Horizon 2020 project funded by the European Union’s Horizon 2020 research and innovation programme. It includes a description of the results of the environmental data collected during the Powerkite project over a 36 month period. The report details information on the approaches taken to collect ambient noise and PTO-noise associated data, develop the CRM for the kite, develop the Sonar System to understand animal movement and to carry out the benthic survey. The report also describes several field campaigns carried out that were not part of the deliverables of WP6, but were identified during the project as general knowledge gaps including the use of EK80’s and ADCP’s alongside the sonar to capture fine- scale animal movement, how seals are associated with fine-scale physical structures in high flow environments, range testing of VEMCO acoustic telemetry in high flow environments and the impacts of anthropogenically- generated wakes on top predators. This report and the earlier D2.10 report has highlighted the challenges in monitoring and mitigating in the near-field of operational tidal MRE devices, which are naturally located/placed in highly energetic environments. Nonetheless, considerable progress has been made in all three of the principle aspects the report has focused on; namely1) assessing and/or monitoring of noise, 2) collision risk and 3) benthic communities. To address these monitoring challenges, the latest technologies including SoundTrap 300 STD hydrophones and Kongsberg Mesotech M3 multibeam sonar heads, as well as modelling software including Blender and Matlab, have been used. While the project officially ends (M36), there are a number of outputs in various stages of preparation that will be finalised after the project. 25
D6.2 Environmental Impact Report
6. References
ABPmer (ABP Marine Environmental Research Ltd). 2010. Collision risk of fish with wave and tidal devices.
Commissioned by RPS Group plc on behalf of the Welsh Assembly Government, R/3836/01. Published by
ABP Marine Environmental Research Ltd, Southampton, UK. Pp. 106.
Bassett C, Thomson J, Polagye B. 2013. Sediment-generated noise and bed stress in a tidal channel. Journal of
Geophysical Research: Oceans, 118:2249–65. doi:10.1002/jgrc.20169
Broadhurst M, Barr S. 2011. Short term temporal behavioural responses in pollack, Pollachius pollachius to marine
tidal turbine devices; a combined video and ADCP Doppler Approach. Paper Presented at the European
Wave and Tidal Energy Conference, Southampton, United Kingdom.
Connor DW, Allen JH, Golding N, Howell KL, Lieberknecht LM, Northen KO, Reker JB. 2004. The marine
habitat classification for Britain and Ireland. Version 04.05 JNCC, Peterborough.
Copping A, Sather N, Hanna L, Whiting J, Zydlewski G, Staines G, Gill A, Hutchison I, O’Hagan A, Simas T, Bald
J, Sparling C, Wood J, Masden E. 2016. Annex IV 2016 State of the science report: environmental effects
of marine renewable energy development around the world.
Cotter E, Matzner S, Horne J, Murphy Cotter P, Polagye BE. 2016. Benchmarking sensor fusion capabilities of an
integrated monitoring package. Paper Presented at the 4th Marine Energy Technology Symposium (METS),
Washington DC, USA.
Culloch R, Schmitt P, Lieber L, Kregting L. 2017. Integrating empirical data with probability distributions from a
numerical 4-D model to assess marine mammal collision risk with a novel marine renewable energy device.
European Cetatcean Society (ECS) conference, Denmark.
Deines KL, (1999) Backscatter estimation using Broadband acoustic Doppler current profilers Proceedings of the
IEEE Sixth Work. Conference Current Measurements (Cat. No.99CH36331), pp. 1–5.
Francisco F, Sundberg J. 2015. Sonar for environmental monitoring: understanding the functionality of active
acoustics as a method for monitoring marine renewable energy devices. Proceedings of the 11th European
Wave and Tidal Energy Conference 6-11th Sept 2015, Nantes, France.
Fraser S, Nikora V, Williamson BJ, Scott BE. 2017. Automatic active acoustic target detection in turbulent aquatic
environments, Limnology and Oceanography Methods, 15, 2017, 184–19.
Hammar L, Andersson S, Eggertsen L, Haglund J, Gullström M, Ehnberg J, Molander S. 2013. Hydrokinetic turbine
effects on fish swimming behaviour. PLoS ONE 8(12): e84141. doi:10.1371/journal.pone.0084141.
Hammar L, Eggertsen L, Andersson S, Ehnberg J, Arvidsson R, Gullström M, Molander S. 2015. A probabilistic
model for hydrokinetic turbine collision risks: exploring impacts on fish. PLoS ONE 10(3): e0117756.
doi:10.1371/journal.pone.0117756
Hutchison I, Copping A. 2016. A coordinated action plan for addressing collision risk for marine mammals and
tidal turbines. http://tethys.pnnl.gov/events/annex-iv-workshop-collision-risk-marine-mammals-and-tidal-
turbines.
Lieber L, Williamson B, Jones CS, Noble LR, Brierley A, Miller P, Scott BE. 2014. Introducing novel uses of
multibeam sonar to study basking sharks in the light of marine renewable energy extraction. Proceedings
of the 2nd International Conference on Environmental Interactions of Marine Renewable Energy
Technologies, (EIMR2014), 28 April–02 May, Stornoway, Isle of Lewis, Outer Hebrides, Scotland
Lieber L, Nilsen T, Zambrano C, Kregting L. 2017. Optimising multiple multibeam sonars to assess marine life
interactions with an underwater kite. European Wave and Tidal Energy Conference, Cork.
Lieber L, Nimmo-Smith WAM, Waggitt JJ, Kregting L. 2018. Fine-scale hydrodynamic metrics underlying predator
occupancy patterns in tidal stream environment. Ecological Indicators, 94, 397–408. doi:
10.1016/j.ecolind.2018.06.071.
Leijon M, Boström C, Danielsson O, Gustafsson S, Haikonen K, Langhamer O, Strömstedt E, Stålberg M,
Sundberg J, Svensson O, Tyrberg S, Waters R. 2008. Wave energy from the North Sea: experiences from
the Lysekil Research Site. Surveys in Geophysics, 29, 221–240.
Lossent J, Lejart M, Folegot T, Clorennec D, Di Iorio L, Gervaise C. 2018. Underwater operational noise level
emitted by a tidal current turbine and its potential impact on marine fauna. Marine Pollution Bulletin,
131:323–34.
26You can also read