Design of a Low-Cost Air Quality Monitoring System Using Arduino and ThingSpeak
←
→
Page content transcription
If your browser does not render page correctly, please read the page content below
Computers, Materials & Continua                                                                 Tech Science Press
DOI:10.32604/cmc.2022.019431
Article

       Design of a Low-Cost Air Quality Monitoring System Using Arduino and
                                   ThingSpeak
       Anabi Hilary Kelechi1, Mohammed H. Alsharif 2 , Chidumebi Agbaetuo3, Osichinaka Ubadike1
              Alex Aligbe1 , Peerapong Uthansakul4, * , Raju Kannadasan5 and Ayman A. Aly6

   1
     Department of Aerospace Engineering, College of Engineering, AirForce Institute of Technology, Kaduna, Nigeria
       2
         Department of Electrical Engineering, College of Electronics and Information Engineering, Sejong University,
                                                     Seoul, 05006, Korea
   3
     Department of Electrical Engineering and Information Engineering, College of Engineering, Covenant University,
                                        Canaanland, Ota, P.M.B 1023, Ogun, Nigeria
     4
       School of Telecommunication Engineering, Suranaree University of Technology, Nakhon Ratchasima, Thailand
5
  Department of Electrical and Electronics Engineering, Sri Venkateswara College of Engineering, Chennai, 602117, India
         6
           Department of Mechanical Engineering, College of Engineering, Taif University, Taif, 21944, Saudi Arabia
                        *
                          Corresponding Author: Peerapong Uthansakul. Email: uthansakul@sut.ac.th
                                       Received: 13 April 2021; Accepted: 14 May 2021

                 Abstract: The impact of daily emissions of gaseous and particulate pollu-
                 tants of machines and industries on human health and the environment has
                 attracted increasing concerns. This impact has significantly led to a notable
                 increase in mortality in the highly industrialized zones. Therefore, monitoring
                 air quality and creating public awareness are important for a safer future,
                 which led the governments globally to invest multi-billion in policymaking and
                 solution stratification to address the problem. This study aims to design a real-
                 time Internet of Things low-cost air quality monitoring system. The system
                 utilizes air quality and carbon monoxide sensors for monitoring gaseous pol-
                 lutants. Moreover, the system utilizes an Arduino Nano development board
                 equipped with a WiFi module to effectively send readings to a ThingSpeak
                 online channel platform for instantaneous and real-time display of air quality.
                 The ThingSpeak uses HTTP protocols to send emails in raising awareness of
                 poor air quality. The level of concentration is monitored graphically through
                 channels with the help of ThingSpeak to aid remote communication. A thresh-
                 old value is set. Thus, when pollutants have become unhealthy and harmful,
                 the system trips off an alarm, and e-mail notifications are sent to the officials.
                 The results have shown that the work was successfully implemented a design
                 of a low-cost air quality monitoring system using Arduino and ThingSpeak,
                 showing that an air quality system can be implemented using a low-cost
                 technology, Arduino and ThingSpeak.

                  Keywords: IoT; air quality; MQ 135 sensor; MQ-7 sensor; air pollution

                      This work is licensed under a Creative Commons Attribution 4.0 International License,
                      which permits unrestricted use, distribution, and reproduction in any medium, provided
                      the original work is properly cited.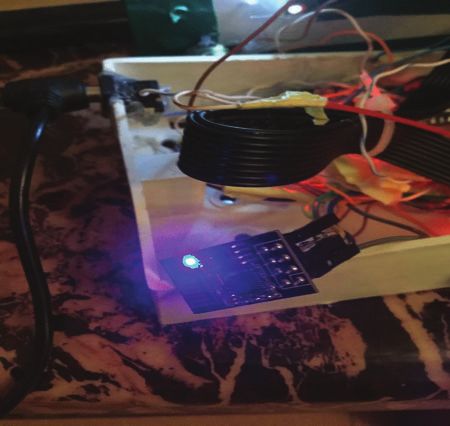
152                                                                           CMC, 2022, vol.70, no.1

1 Introduction
     Maintaining adequate air quality possesses a global challenge to governments and citizens.
The deteriorating air quality has essentially caused governments globally to invest in multi-billion
sums in policymaking and solution stratification to address the problem. Air pollution is caused
by particulate matter emitted from industries, cars, machinery, waste recycling, industrial practices,
and household. Some of the notable pollutants are the dust of heavy metals, carbon monoxide,
ozone, carbon dioxide, nitrogen dioxide, suspended particulate matter, hydrogen fluoride oxides
of sulfur, and others. These pollutants get into the atmosphere and cause severe health and
environmental effects. In a survey conducted in 2016, the World Health Organization (WHO)
stated that air pollution, specifically of the ambient (outdoor) origin, is the estimated cause of
4.2 million premature deaths annually worldwide [1]. This value is a reflection of the population
living in rural and urban areas. The map in Fig. 1 shows the density and intensity of air pollution
globally.

                      Figure 1: PM 2.5 concentrations around the world [1]

     Air pollution impacts our lives and generations yet born; hence, we should be cautious
and control harmful emissions of particulate matter into the atmosphere. A step in achieving
this goal is by designing a cheap real-time air quality monitoring system. Internet of Things
(IoT) is a game-changing innovation in the technology, policy, industry, and engineering circles
that can enable air quality monitoring [2]. IoT allows the connection of a network of objects
by incorporating intelligent sensing systems, such as radio-frequency identification, sensors, and
two-dimensional codes into a “physical entity,” to obtain information about the purpose at any
time [3]. IoT connects a range of devices through the Internet to communicate and exchange data
and utilize such interconnection to conduct highly beneficial functions.
     Borghi et al. [4] noted that the significant problems faced by the traditional air monitoring
system are the relatively sophisticated hardware innovation, unsafe operation, high cost, and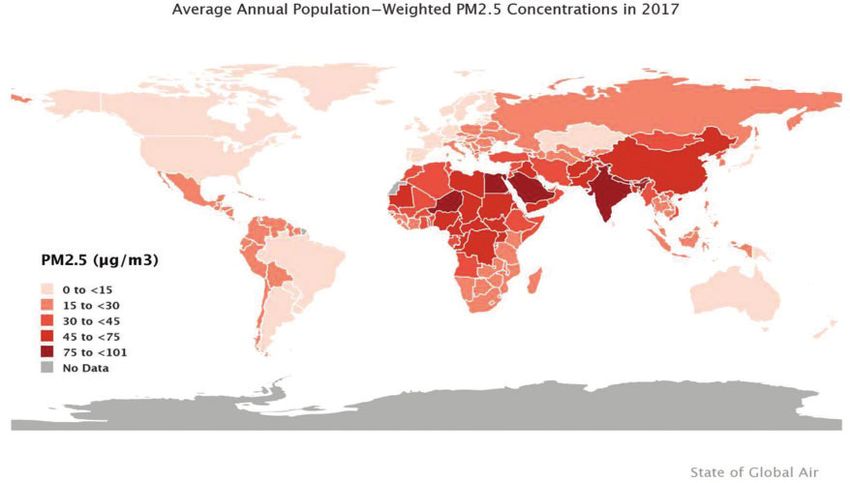
CMC, 2022, vol.70, no.1                                                                           153

bulky instruments (Fig. 2). Furthermore, for the equipment to provide accurate precision and
performance, sophisticated statistical methods aided with devices, such as sensors, filters, humidity,
and temperature monitors, are necessary. However, these methods require an excessive amount of
energy from the massive and expensive equipment [5]. Hence, they are not energy-efficient and
sustainable. The conventional techniques do not make the system efficient for remote monitoring
and cause inadequacy in detecting the rise in pollution concentration [6]. Ideally, sensors that are
efficient, cheap, and of relative size are the best choice for monitoring the ambient air. These
devices are employed in industries but are partly used in environmental monitoring due to the
inefficiency to measure massive data of specific gas pollutants under ambient cases. Hence, low-
cost sensors will have to be analyzed using the traditional monitoring equipment to compare their
efficiency [7]. To date, detailed and comprehensively distributed estimates comparing productivity
are generally uncommon, particularly for diagnostic advancements, which are now being used [8].

                          Figure 2: Traditional air quality monitoring device

    The study aims to develop a low-cost, convenient, high-precision, portable air pollution
monitoring device that is capable of measuring the concentration of various types of particulate
matter pollutants in the air under real-time architecture using the IoT platform. The system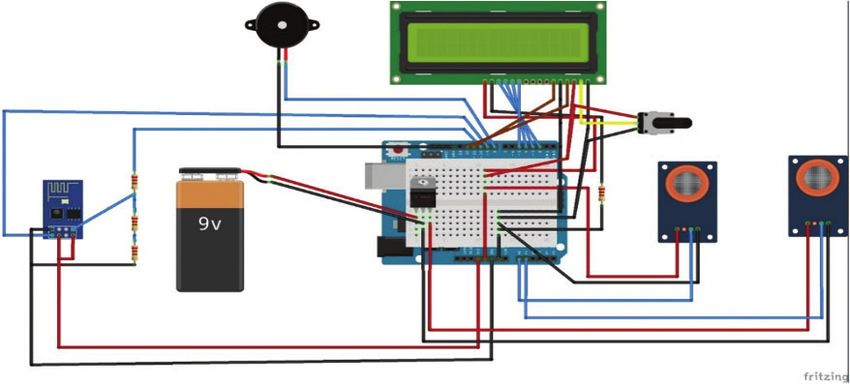
154                                                                         CMC, 2022, vol.70, no.1

working principle was subdivided into sub-routine/objectives and tested to ensure that the system
is efficiently functioning. The goals set out to achieve are the following:
      • Design a web server system that measures air quality index (AQI) in the environment.
      • Interface the system with a liquid crystal display (LCD) module that displays the AQI of
        the situation.
      • Integrate the system with an IoT platform to enable remote monitoring of the AQI.
    This paper is further organized as follows. Section 2 details a standard and structured review
of past work in this area of study, drawing parallels between them and highlighting weaknesses
and strengths. Section 3 introduces the methodologies used in this system design, explaining the
methods and the reasons for using such methods. Then, Section 4 presents the actual design and
implementation. Section 5 provides the results and discussions. Finally, Section 6 concludes the
study.

2 Literature Review
    The AQI is a numerical value representation system created by the Environmental Protection
Agency (EPA) to make a logical way of reporting daily air quality concerning the environment
and human health. The AQI focuses on the negative impacts that people may experience on their
health while breathing polluted air over a few hours or days. An increase in the AQI represents
a subsequent increase in air pollution and human health threats [9]. The AQI is calculated for
the six major pollutants stated under the Clean Air Act by the EPA in 1970: nitrogen oxides,
particulate matter (PM 10, PM 2.5), carbon monoxide, sulfur dioxide, and ground-level ozone.
Recent advances in technology have led to creating innovations and opportunities, such as the
IoT, whereby embedded systems connected to the Internet can interact and be controlled through
the Internet. For instance, researchers deployed IoT technology to monitor the water quality of a
lake [10]. Numerous research projects on wireless sensory networks or IoT to detect and monitor
the AQI has been performed [11]. These concluded projects measured various air pollutants with
the use of mobile or stationary sensors.
     The proposed system evaluates the Waspmote platform created by Libelium, which offers
various radio technologies, sensors, application programming interface (API), and open-source
software development kits to improve neural networks [12]. This study evaluates the power
consumption of wireless sensor networks, identified analytical functions, and then created a frame-
work with utilization parameters. Reference [13] proposed a system using a wireless monitoring
system to measure concentrations of pollutants. The proposed system was implemented on an IoT
platform using sensory nodes connected to the Internet via a network gateway. The researchers
used sensory nodes to ascertain the concentration of carbon dioxide and carbon monoxide in the
environment.
     This proposed system employs mobile sensors placed on city buses to symbolize a smart
air pollution system named “OpenSense” [14]. In this project, the researchers deployed trams as
mobile platforms for conveying sensors. The sensors communicate to the cloud through a radio
device cloud platform. Then, [15] proposed a system that monitors outdoor air parameters. The
system consists of a PIC18F87K22 microcontroller interface with infrared gas and aerometry
sensors. The researchers strategically placed the nodes embedded with the neural network at some
locations in the town. This paper proposed the utilization of the IEEE/ISO/IEC 21451 standard
to monitor air quality [16]. The system uses infrared and electrochemical sensors to measure
NO2 , CO, SO2 , and CO2 concentration. The results were relayed and stored on a data server.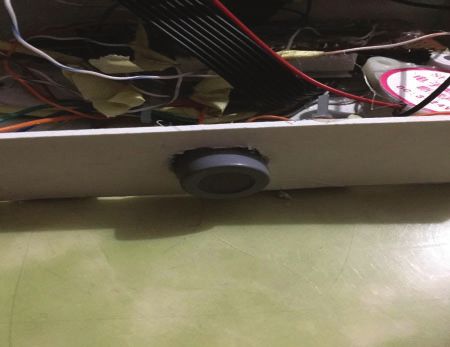
CMC, 2022, vol.70, no.1                                                                          155

Then, [17] implemented a system to create awareness of the effects of pollutants, gases, and toxins
on air quality. The proposed system analyzes meteorological data, traffic data, and contaminants
using an intelligent business engine called “APA.” The system detects the trends in air pollution
and reports human activities that influence the decline in air quality. Meanwhile, [18] proposed a
framework for observing environmental air quality. The system consists of a low-cost raspberry pi
module used in establishing the system. The proposed system monitored air pollution parameters,
such as CO2 , CO, pressure, and temperature, but did not consider PM, making it incomplete for
its function. Reference [19] also proposed a system driven by a neural network that used nodes to
measure concentrations. The authors used temperature and humidity sensors to make the system
more accurate. From another perspective, [20] examined vehicular GPRS-aided air sensors using a
smartphone monitoring platform to measure concentrations of PM 2.5. Moreover, [21] proposed a
smartphone monitoring platform and air quality surveillance system using sensory arrays and an
IoT mobile platform to enable users to receive concentration readings. Similarly, an environmental
monitoring system was used to measure ambient air data by utilizing a smartphone monitoring
platform with complex architecture sensor network models and mobile API systems.

3 Materials and Methods
    This section describes an IoT-based air quality monitoring system comprising the hardware
components and the software platforms. Some of the tasks performed include design specification,
design concept, and materials and method.

3.1 Design Specification
     The air quality monitoring system comprises five units as shown in Tab. 1. The first unit is a
power supply unit, which consists of a DC jack and a regulator. The second unit is the sensing
unit, which consists of an air quality sensor and a carbon monoxide sensor. Then, the third unit
is the control unit, which consists of the Arduino Uno atmega microcontroller. The fourth unit is
the communication unit, which consists of a WiFi module used to transfer the air quality status
from the control unit to the IoT platform. Finally, the fifth unit is the output unit, which consists
of an LCD, a buzzer, and a ThinkSpeak IoT platform.

                                   Table 1: Design components
S/N     Units                             Components
1       Power supply unit                 DC Jack, 5 V voltage regulator LM7805, resistors
2       Sensing unit                      MQ135 air quality monitor sensor, MQ7 CO sensor
3       Microcontroller unit (MCU)        Arduino Uno Atmega microcontroller
4       Communication unit                ESP8266 WiFi module
5       Output unit                       16 × 2 LCD monitor, Buzzer, ThinkSpeak IoT platform

3.2 Design Concept and System Flowchart
    Fig. 3 depicts the proposal’s design concept, whereas Fig. 4 shows the flowchart of the system
with the description highlighted as follows.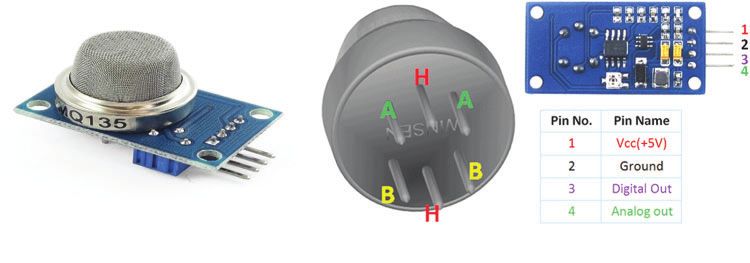
156                                                                         CMC, 2022, vol.70, no.1

                             Figure 3: Block diagram of the system

    (i) A DC jack supplies power to the system. The DC jack is connected to the MCU, which
        controls the sub-units.
   (ii) An MQ135 air quality sensor is used to measure the concentration of air pollutants in
        the atmosphere. An MQ-7 sensor is designed for measuring the concentration of carbon
        monoxide in the atmosphere.
  (iii) A programmed Arduino Uno microcontroller is the brain of the system that conducts the
        needed mathematical operations regarding the comparison between the received analogue
        signals from the sensors and the preset value. This microcontroller also synchronizes tasks
        relating to other components in the system.
  (iv) An ESP8266 WiFi module is used as the gateway to allow the Arduino Uno microcon-
        troller to interact with the ThinkSpeak IoT platform to write data to its channels.
   (v) A 16 × 2 LCD monitor is used to display the level of concentration of air pollutants in
        the atmosphere.
  (vi) The Thinkspeak IoT platform shows a virtual representation of the written data in its
        channel, which also enables the values to be remotely accessed.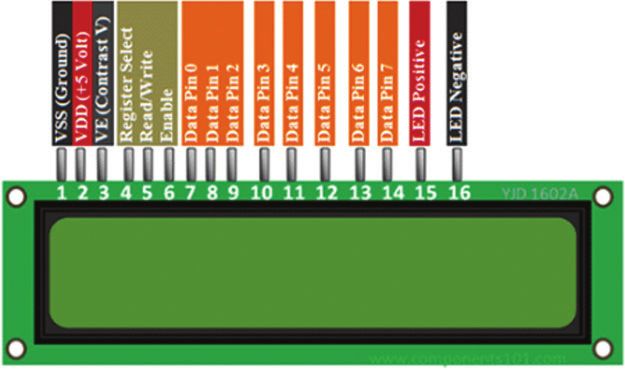
CMC, 2022, vol.70, no.1                                                                                  157

                                                    5V DC external
                                                    power supply

                                                                                        MQ-135 sensor
                                                                                          Module
                                                      Microcontroller
                                                         (MCU)
                   MCU goes back reading sensors

                                                                                         MQ-7 sensor
                                                                                          Module
                                                      MCU compares
                                                       and contrasts
                                                         using IF
                                                        statements
                                                                                              Alarm
                                                                                              Buzzes

                        Buzzer is off                Else
                       and Green LED                                    MCU triggers
                         remains on                                      alert notice

                                                                                            Red LED
                                                                                              blinks
                                                                                            constantly

                                                   Figure 4: Flowchart of the project

3.3 Hardware Design
    The air quality monitoring system design is divided into two interdependent sections, that is,
the software and the hardware. This section briefly describes the hardware design of the system.

3.3.1 Choice of the Microcontroller
     The project uses two harmful gas concentration sensors, namely, MQ-135 and MQ-7. These
two sensors have a maximum of four IO (input–output) pins. Each is powered by a working mode
at constant 5 V. Using analog read protocols is best for the readings of these sensors. Hence, our
microcontroller choice was from the Arduino nano-board, which has an on-board Atmega328P
IC, 28 pins, and works on 5 V. Tab. 2 presents the summarized microcontroller pin requirement.

3.3.2 Arduino Nano-Board
     The nano-board offers excellent flexibility and compartment and is also a low-cost develop-
ment board. Tab. 3 shows the technical specification according to the datasheet.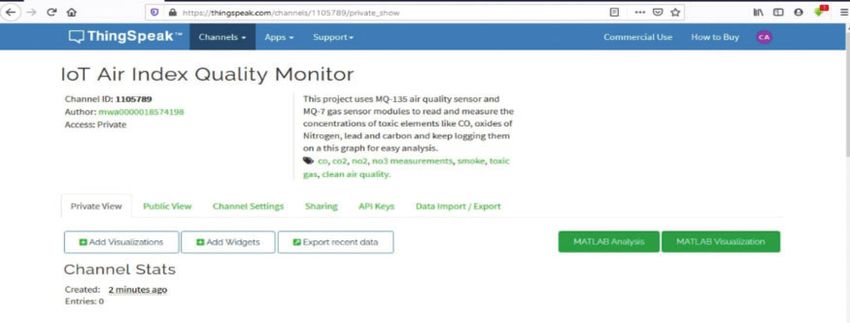
158                                                                         CMC, 2022, vol.70, no.1

                     Table 2: Microcontroller pin requirement calculations
                     Components                            Pin requirement
                     MQ135 pins                            2
                     MQ7 pins                              2
                     Internet access module (UART)         3
                     LED indicators                        2
                     Buzzer                                1
                     Total required pins                   10

                       Table 3: Technical specification of the nano-board
Components                                      Specifications
Microcontroller                                 ATmega328P—8-bit AVR family microcontroller
Operating voltage                               5V
Recommended input voltage for Vin               7–12 V
Analog input pins                               6 (A0–A5)
Digital I/O pins                                14 (of which, 6 provide PWM output)
DC current on I/O pins                          40 mA
DC current on 3.3 V pins                        50 mA
Flash memory                                    32 KB (2 KB is used for bootloader)
SRAM                                            2 KB
EEPROM                                          1 KB
Frequency (clock speed)                         16 MHz
Communication module                            IIC, SPL, USART

3.3.3 Air Quality Sensor
     This gas sensor is susceptible to tin oxide compound (SnO2), which has lower conductivity
in clean air. Fig. 5a illustrates a typical air quality sensor, whereas Fig. 5b depicts the MQ
135 sensor. Thus, the gas sensor works; when the target combustible gas exists within its range
of sensory field, the sensor will change its electrical conductivity, which can be used with a
microcontroller to map out a range of threshold values. Moreover, the sensor can convert the
change of conductivity to correspond output signal of gas concentration. This MQ135 gas sensor
module has a high sensitivity to ammonia, sulfide, and benzene steam. Furthermore, the MQ135
gas sensor can be used in sensitive nature to detect NO2 .

3.3.4 Carbon Monoxide Sensor
     The MQ-7 gas sensor measures carbon monoxide and smoke in the atmosphere, as shown in
Fig. 6. This sensor has the potential to detect different harmful gases and other concentrations
of dangerous combustible gases. The MQ-7 gas sensor can operate at a temperature between −20
and 50◦ C. This sensor can consume less than 150 mA current at 5 V rating and has the accuracy
of detecting gas concentrations between 100 and 10,000 ppm. The module version of this sensor
makes it very easy for the connection. Although this sensor is more expensive, the project design
was more accurate in taking air quality measurements to determine the module version’s toxic gas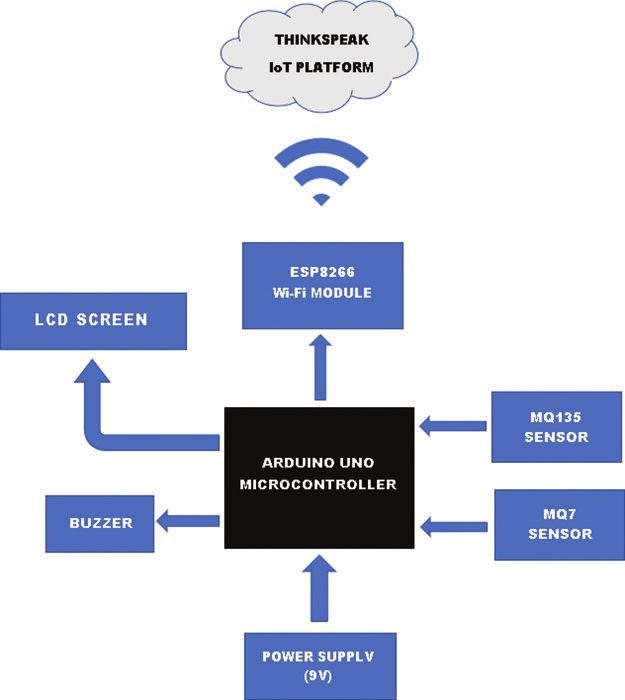
CMC, 2022, vol.70, no.1                                                                        159

concentration level. Two options may be used: either getting a digital output (DOUT) or analog
output (AOUT). The technical specifications are as follows:

Figure 5: Typical air quality sensor. (a) Air quality sensor (b) Configuration of the MQ 135 sensor

                               Figure 6: Carbon monoxide sensor

    • Operating voltage is +5 V.
    • The sensor can be used to measure or detect LPG, alcohol, propane, hydrogen, CO, and
      even methane.
    • Analog output voltage is from 0 to 5 V.
    • Digital output voltage is from 0 or 5 V (TTL Logic).
    • Preheat duration is 20 s.
    • The sensor can be used in digital or analog.
    • The sensitivity of the digital pin can be varied using a potentiometer.

3.3.5 ESP8266 WiFi Module
     The ESP8266 ESP-01 is a WiFi module that can allow MCUs to access a WiFi network, as
shown in Fig. 7. The module comes with a system on chip configuration, which means that this
module does not need a microcontroller to manipulate input and output pins. Thus, the ESP-01
is provided with properties to act like a small computer. The ESP8266 has nine GPIOs (General
Purpose Input Output). With the ESP8266 module acting as a module, we can have Internet access
once connected to a WiFi network as the module is connected to the MCU in Station (STA)
mode. The ESP8266 WiFi module is a module that can connect to the Internet. Thus, in this
IoT project, the user has the option to check the level of noise or air quality via web or mobile
phones visible on an IoT dashboard. The module has two modes of operation.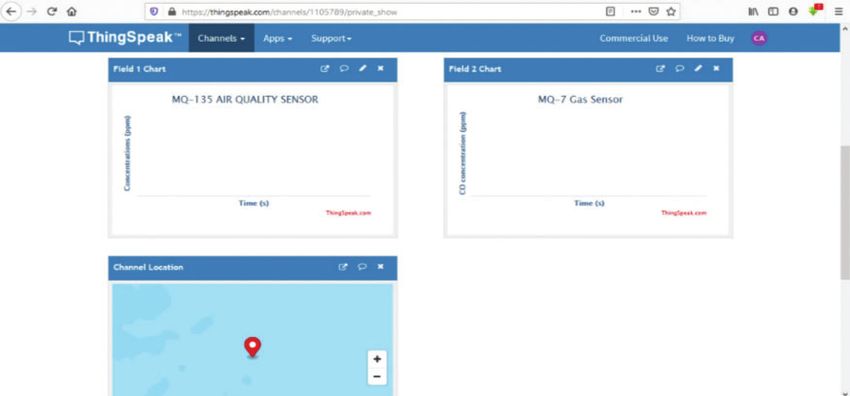
160                                                                         CMC, 2022, vol.70, no.1

                                      Figure 7: ESP8266 module

   Mode 1: Station mode. In this mode, the module allows the microcontroller to connect to
WiFi networks (as a client).
    Mode 2: Access point mode. In this mode, the module acts as the WiFi host and supplies
Internet access to the devices (as a host).
      Technical features of an ESP8266 module as follows:
      • Memory: The module consists of a 64 Kb RAM used for instruction and 96 Kb used for
        data and also has a flash memory of 1MB.
      • WiFi: The module has a TCP/IP protocol integrated and also uses an 802.11 b/g/n, which
        is a single band protocol that can deliver 2.4 GHz speed.
      • CPU: The module consists of a 32-bit RISC CPU and a 32-bit application CPU.

3.3.6 16 × 2 LCD Display
     The LCD module is used for displaying the readings and the status of the design. The pixel
size of the LCD screen is 1602 (16 by 2), and the display color is BLUE. In this device, the LCD
screen shows the welcome message and also displays the level of concentrations of each gas we are
measuring. Fig. 8 depicts the 16 × 2 LCD deployed for this project. The command register stores
the commands sent to the display, whereas the data displayed are stored in the data register. The
data of the intended image are stored in the data register and the instructions in the command
register to control the display. The contrast of the display is adjusted by using a potentiometer
connected across the VEE pin. The technical specifications are as follows:
      •   Makes a 5 × 8 and 5 × 10 dot matrix possible on its surface.
      •   Supports a low-power operation: 2.7 to 5.5 V.
      •   Corresponds to the high-speed micro processing unit bus interface at 2 MHz.
      •   Operates at a 5-V logic level.
      •   Can display 16 characters in two lines.

3.4 Arduino Integrated Development Environment
    Fig. 9 shows the Arduino Integrated Development Environment (IDE). IDE is an open-
source application. In the IDE, programs are called a sketch, and its extension, when saved, is
an .ino file. The programming language used in writing a sketch is C language. The Arduino
IDE consists of an editor for code writing, a text console, toolbars that contains a button with
functions and a series of menus, a message area for displaying status and errors, and a series of
CMC, 2022, vol.70, no.1 161
menus. The toolbar button allows for the saving of sketch, code verification, serial monitoring,
and program upload. When a sketch is uploaded, the Arduino’s bootstrap is utilized, which is
a stacked program to the board, supporting the program to be loaded without any additional
hardware.
Figure 8: LCD module
Figure 9: Arduino integrated development environment (IDE)
3.4.1 ThingSpeak IoT Platform
ThingSpeak is an open-source IoT-based API used to retrieve and store data from IoT-based
devices through the HTTP protocol over the Internet or via a Local Area Network. ThingSpeak
allows users to analyze and store in clouds without the need of configuring servers. This platform
also allows creating event-based status alerts that trigger based on the incoming data from
connected devices. Thingspeak is an IoT platform supported by the numerical computing software162 CMC, 2022, vol.70, no.1
known as Matlab, which allows its users to analyze and visualize data uploaded to it, thereby
linking IoT devices, such as temperature, pressure, and level sensors or microcontrollers Node
MCU, Arduino, Raspberry Pi, and others. The main element that worked when using Thingspeak
is the channels containing data field, location field, and status field, which can be written to,
processed, and viewed with Matlab code. The processed data could also be used to trigger actions,
such as sending tweets and other forms of alert.
4 Implementation
This section contains a detailed description of the implementation and testing of an IoT-based
air quality monitoring system. The working operation of the project at all levels is explained in
detail. For a system to meet the stated requirements, each subunit’s proper functioning that makes
up the system is required because a fault in one unit can affect the functionality of the entire
system. Therefore, each subunit was tested to eliminate errors in the implementation and design
that may occur during the circuit implementation.
4.1 Implementation Using Fritzing
Fritzing is an open-source initiative that is used for schematic and printed circuit board (PCB)
hardware simulation and design. The system circuitry framework, schematic, and PCB layout were
executed using the Fritzing software. Fritzing was the preferred option because of its extensive
library, which contains all the components used in the system. The simulation was conducted to
ensure that the system operation was working properly before the commencement of the system
development. Fig. 10 shows the breadboard pin connection view.
Figure 10: Pin connection of the entire system (modeled with Fritzing)
4.2 Hardware Implementation
This section focuses on the actual hardware implementation of a low-cost air quality mon-
itoring system using the Arduino microcontroller. The design’s hardware component consists of
the ESP8266 WiFi module, LCD module, and the MQ135 and MQ-7 sensors.CMC, 2022, vol.70, no.1 163
4.2.1 ESP8266 WiFi Module
The ESP8266 WiFi module is the communication module and provides the necessary commu-
nication protocols to enable the IoT implementation as shown in Fig. 11. The module comprises
eight pins, which are Ground, Tx, GPIO-2, GPIO-0, CH_PD, Reset, Rx, and VCC. The CH_PD
and the VCC pins are connected to the 3V3 pin of the Arduino nano. Then, the transmission
pin is connected to digital pin 10 and the receiver pin to digital pin 11 of the MCU. For
this implementation, the module is set to operate as a client. Therefore, the module is set to
station mode and finally connected to a WiFi network. The module was programmed to retrieve
concentration readings of the sensors and update it on the ThingSpeak platform. The Tx pin is
connected to pin 10 of the Arduino, and the Rx pin is connected to pin 9 of the Arduino.
Figure 11: Implemented WiFi module
4.2.2 LCD Module
The LCD module consists of 16 pins that control its operation. This module has two operat-
ing modes, which are the 8-bit and 4-bit modes. In the former, all the data line pins are used for
transmitting and receiving data, whereas in the latter, only pins 4–7 of the data line pins are used.
The LCD module was implemented in the 4-bit mode to reduce the microcontroller’s number
of connections. The LCD module was programmed to display the concentration values from the
sensors and the WiFi module’s connection status. The LCD is connected to the microcontroller
through a connector cable. The register select connection is connected to digital pin 9. The
potentiometer’s wiper is connected to Vo, and the potentiometer was set to vary the contrast
of the display. The Enable (E) pin is connected to digital pin 9 on the Uno board. Then, the
4-bit data pins (D4 through D7) are connected to digital pins 7–5 and finally digital pin 4. The
read/write is grounded. Fig. 12 shows the fully implemented LCD module.
4.2.3 MQ135 and MQ-7 Sensors
The first step in operating the MQ135 and MQ-7 sensors is to calibrate the sensors for fresh
air and create a conversion for the voltage readings obtained from the sensor to standard PPM164 CMC, 2022, vol.70, no.1
values. Fig. 13 depicts the fully connected settings, and the steps in configuring the sensors are as
follows:
• Step 1: The VCC of the air quality sensors is connected to the 5 V pin of the MCU, and
the ground pin is connected to the ground of the MCU. Then, the AOUT pin is connected
to the Analog pins of the MCU. The microcontroller reads the gas module with the use of
analog to digital converter pins.
• Step 2: The sensors are first connected for a preheating period to find the value of fresh.
• Step 3: The microcontroller was then programmed to check for the threshold value where
the gas concentration should exceed. Then, the buzzer alarm and the LED would go off,
notifying nearby people that the air is unsafe to breathe.
Figure 12: Implemented LCD module
Figure 13: Diagram of the implemented air quality sensor
4.3 Software Implementation
The software implementation of this project was conducted using the Arduino IDE and
ThingSpeak platform. The former provides an enabling environment for the microprocessor con-
figuration, whereas the latter is responsible for the real-time implementation of the IoT of the
project.
4.3.1 Arduino IDE Programming
The Arduino IDE is used for coding, setting up, and testing the components. The version
used is version 1.8.13. The steps for setting up the software are listed as follows.CMC, 2022, vol.70, no.1 165
(1) Download and install the Arduino IDE.
(2) Install the board on the IDE, which is conducted by accessing the tools menu and setting
the board option to nano.
(3) Load the libraries into the IDE, from the library function in the sketch tab; the needed
libraries are loaded and installed.
(4) Writ the code on the coding area, which is then uploaded to the board through the upload
function.
4.3.2 ThingSpeak Platform
The ThingSpeak platform is for displaying the value of the concentration on its channels as
shown in Figs. 14 and 15. Two channels were created to publish the data, where one channel is for
the air quality concentrations and the other is for carbon monoxide concentration. The channel is
set as a continuous line graph that updates every 30 s. The graph is constructed as concentration
against time.
Figure 14: Setting up the ThingSpeak channels
Figure 15: ThingSpeak channels166 CMC, 2022, vol.70, no.1
5 Results and Discussions
Several different tests were conducted to ensure that the proposed system meets the require-
ments. The system components were tested individually to ensure continuity and their power
ratings through the use of a multi-meter. The test was done before integrating into the system to
ensure their functionality. This type of testing is referred to as unit testing. Afterward, sub-unit
testing was implemented. Each sub-unit was tested to ensure its functionality before integrating
it into the proposed system. In this stage, the sensors and modules were tested to ensure that
they interacted with the microcontroller. The components were placed correctly to determine the
current and voltage consumption. Moreover, system testing involving the entire air monitoring
testing was performed. In this stage, the proposed system was tested completely with all the
sub-units and components connected, as shown in the diagrams. During the testing, the system
was supplied with power, and the system worked perfectly. Then, the system was packaged and
enclosed in a green physical case. To ensure that the design satisfies the design goals and objectives,
an acceptance test was implemented. In this stage, the code for the system program was debugged
and compiled to ensure that all errors were fixed. This stage also ensures that the program codes
meet all the system functions.
The proposed system was connected to a power supply and tested to ensure that the system
meets the requirement. The MCU reads the sensor’s values and transmits them through the WiFi
module when connected to a WiFi network. The transmitted data are observed on the ThingSpeak
platform for 30 s. When the concentrations become harmful, the system initiates a buzzer and
blinks the LED. The data are also displayed on the LCD, which also displays the functionality
of the other components. Fig. 16 shows that the MQ-135 sensor registered the quality of air in
a particular area. Evidently, the quality of air is not good. When the AQI is good, the AQI
category starts at 0 and ends at 50. This category is symbolized in green color. Air quality
is deemed to be good, and air pollution presents nearly no effect or hazard. However, AQI is
considered moderate. That is, the AQI category starts at 51 and ends at 100. This category is
symbolized with a yellow color. Air quality in this category is deemed tolerable. However, harmful
pollutants still exist, which will likely affect the health of a limited set of individuals. For instance,
individuals sensitive to ozone encounter respiratory defects. This case is another class when the
AQI is considered unhealthy for sensitive groups: This AQI category starts at 101 and ends at 150,
which is symbolized in orange color. This category is not likely to affect the general health of the
public. Moreover, people with lung diseases, older patients, and children are at higher risk from
exposure to ozone. Furthermore, those with heart and lung diseases, older patients, and children
are at a higher risk of particles’ exposure in the air. The AQI is termed unhealthy at 151 and
ends at 200. This category is symbolized in red color. In this category, individuals start noticing
serious health challenges. Older adults and children may encounter health challenges, particularly
individuals with lung or heart diseases. This category is symbolized in purple color. This AQI
category triggers health alerts stating that every individual may experience severe health impacts.
Among them, the most dangerous is when the AQI is considered hazardous. This case occurs
when the AQI is greater than 300. This category is symbolized in a maroon color. Health warnings
are indicated, and awareness is created as air pollution at this level has become life-threatening.
The CO is an odorless and colorless gas developed during incomplete incineration of fuels,
such as coal, wood, or natural gas. CO is a very toxic gas that is fatal when inhaled in large
quantities. Fig. 17 highlights the performance of the air quality system using the CO gas. The
biggest sources of CO are automobiles and machinery that combust fossil fuels. CO cannot be
identified by the human senses considering that this gas has no odor, taste, or color. This notionCMC, 2022, vol.70, no.1 167
means that harmful concentrations can develop indoors, and humans do not have a way to detect
it. When humans are exposed to CO gas, the CO gets into the bloodstream, where it displaces
and reduces the amount of oxygen that is transported to vital organs, such as the brain and heart.
The study proposed a similar project, that is, the system “N-SMARTS.” However, different from
the fact that the proposed system consists of more than one sensor, the system collected data
on air pollutants by interfacing GPS-enabled mobile phones with sensors. The system provided a
simple and accessible system for detecting air pollutants using low-cost sensors.
Figure 16: Results of the MQ 135 channel
Figure 17: CO level consideration
6 Conclusion
This work successfully implemented a design of a low-cost air quality monitoring system using
Arduino and ThingSpeak, showing that an air quality system can be implemented using a low-
cost technology, Arduino and ThingSpeak. The executed project was tested using various testing
categories, namely, unit, sub-unit, system, acceptance, and program testing. The system performs
credibly well in all testing parameters. With this system, a mobile app that can be easily deployed
to monitor the air quality across the spectrum can be developed, thereby improving the health of
the populace.
Funding Statement: This work was supported by SUT Research and Development Funds and by
Thailand Science Research and Innovation (TSRI). In addition, this work supported by the Taif168 CMC, 2022, vol.70, no.1
University Researchers Supporting Project number (TURSP-2020/77), Taif University, Taif, Saudi
Arabia.
Conflicts of Interest: The authors declare that they have no conflicts of interest to report regarding
the present study.
References
[1] S. T. Odonkor and T. Mahami, “Knowledge, attitudes, and perceptions of air pollution in Accra,
Ghana: A critical survey,” Journal of Environmental and Public Health, vol. 2020, no. 9, pp. 1–8, 2020.
[2] P. Mehndiratta, A. Jain, S. Srivastava and J. E. Gupta, “Environmental pollution and nanotechnology,”
Environment and Pollution, vol. 2, no. 2, pp. 49–54, 2013.
[3] Y. Huang, Q. Zhao, Q. Zhou and I. A. Jiang, “Air quality forecast monitoring and its impact on brain
health based on big data and the internet of things,” IEEE Access, vol. 6, no. 5, pp. 78678–78688,
2018.
[4] K. Bianchini, R. Alvo, D. C.Tozer and M. L. Mallory, “The legacy of regional industrial activity: Is
loon productivity still negatively affected by acid rain,” Biological Conservation, vol. 255, no. 3, pp.
108977–108997, 2021.
[5] D. Rickerby, M. J. S. Morrison and T. O. Aly, “Materials, nanotechnology and the environment:
A European perspective,” Science and Technology of Advanced Materials, vol. 8, no. 2, pp. 19–30, 2007.
[6] D. E. Williams, G. S. Henshaw, M. Bart, G. Laing, J. Wagner et al., “Validation of low-cost ozone
measurement instruments suitable for use in an air-quality monitoring network,” Measurement Science
and Technology, vol. 24, no. 6, pp. 65803–65823, 2013.
[7] A. C. Lewis, J. D. Lee, P. M. Edwards, M. D. Shaw, M. J. Evans et al., “Evaluating the performance of
low cost chemical sensors for air pollution research,” Faraday Discussions, vol. 189, no. 5, pp. 85–103,
2016.
[8] P. Arroyo, F. Meléndez, J. Suárez, J. Herrero, S. Rodríguez et al., “Electronic nose with digital gas
sensors connected via bluetooth to a smartphone for air quality measurements,” Sensors, vol. 20, no.
3, pp. 786–806, 2020.
[9] B. Bishoi, A. Prakash and V. J. A. Jain, “A comparative study of air quality index based on factor
analysis and US-EPA methods for an urban environment,” Aerosol and Air Quality Research, vol. 9, no.
1, pp. 1–17, 2009.
[10] M. Ansah, R. Sowah, J. Melià-Seguí, F. Katsriku, X. Vilajosana et al., “Characterising foliage influence
on LoRaWAN pathloss in a tropical vegetative environment,” IET Wireless Sensor Systems, vol. 10, no.
5, pp. 198–207, 2020.
[11] S. Kaivonen and E. Ngai, “Real-time air pollution monitoring with sensors on city bus,” Digital
Communications and Networks, vol. 6, no. 1, pp. 23, 2020.
[12] V. Vinod, V. Mekala, S. Abinaya, A. Srinivas and S. Arun, “A customizable cartographic air pollution
monitoring system,” International Journal of Scientific and Technology, vol. 9, no. 4, pp. 1675–1678, 2020.
[13] R. Dhanusha and S. Rathi, “A survey on air pollution monitoring using internet of things,” Interna-
tional Journal of Scientific Research in Science, Engineering and Technology, vol. 7, no. 3, pp. 350–355,
2020.
[14] P. Souza, A. Anjomshoaa, F. Duarte, R. Kahn and C. Ratti, “Air quality monitoring using mobile low-
cost sensors mounted on trash-trucks: Methods development and lessons learned,” Sustainable Cities
and Society, vol. 60, no. 3, pp. 102239– 102248, 2020.
[15] N. Motlagh, E. Lagerspetz, P. Nurmi, X. Li, S. Varjonen et al., “Toward massive scale air quality
monitoring,” IEEE Communications Magazine, vol. 58, no. 2, pp. 54–59, 2020.
[16] K. Zheng, S. Zhao, Z. Yang, X. Xiong and W. Xiang, “Design and implementation of LPWA-based
air quality monitoring system,” IEEE Access, vol. 4, no. 2, pp. 3238–3245, 2016.CMC, 2022, vol.70, no.1 169
[17] H. Fan, C. Zhao and Y. Yang, “A comprehensive analysis of the spatio-temporal variation of urban air
pollution in China during 2014–2018,” Atmospheric Environment, vol. 220, no. 5, pp. 117066–117086,
2020.
[18] V. Masson, A. Lemonsu, J. Hidalgo and J. Voogt, “Urban climates and climate change,” Annual Review
of Environment and Resources, vol. 45, no. 3, pp. 411–444, 2020.
[19] O. A. Postolache, J. D. Pereira and P. Girao, “Smart sensors network for air quality monitoring
applications,” IEEE Transactions on Instrumentation and Measurement, vol. 58, no. 9, pp. 3253–3262,
2009.
[20] N. Kularatna and B. H. Sudantha, “An environmental air pollution monitoring system based on the
IEEE, 1451 standard for low cost requirements,” IEEE Sensors Journal, vol. 8, no. 4, pp. 415–422, 2008.
[21] M. Taştan and A. S. Gökozan, “Real-time monitoring of indoor air quality with internet of things-
based E-nose,” Applied Sciences, vol. 9, no. 16, pp. 3435–3455, 2019.You can also read