Designing ICTs for Users with Mild Cognitive Impairment: A Usability Study - MDPI
←
→
Page content transcription
If your browser does not render page correctly, please read the page content below
International Journal of
           Environmental Research
           and Public Health

Article
Designing ICTs for Users with Mild Cognitive
Impairment: A Usability Study
Diana Castilla 1,2, * , Carlos Suso-Ribera 3 , Irene Zaragoza 2 , Azucena Garcia-Palacios 3
and Cristina Botella 3
 1    Department of Personality, Evaluation and Psychological Treatment, University of Valencia,
      46010 Valencia, Spain
 2    CIBER of Physiopathology of Obesity and Nutrition (CIBEROBN), ISCIII CB06/03/0052 Instituto Salud
      Carlos III, 28029 Madrid, Spain; izaragoz@uji.es
 3    Department of Basic Psychology, Clinical Psychology and Psychobiology, Universitat Jaume I,
      12071 Castellón, Spain; susor@uji.es (C.S.-R.); azucena@uji.es (A.G.-P.); botella@uji.es (C.B.)
 *    Correspondence: Diana.Castilla@uv.es; Tel.: +34-9-6386-4394

 Received: 14 June 2020; Accepted: 14 July 2020; Published: 17 July 2020

 Abstract: Background: Research has supported the cost-effectiveness of cognitive training tools enhanced
 by information and communication technologies (ICT) in several populations, including individuals with
 mild cognitive impairment (MCI) and age-related cognitive decline. The implementation of ICTs in this
 population, however, is sometimes challenging to their cognitive and age characteristics. Ultimately, this
 might compromise the effectiveness of ICT-enhanced therapies in this population. The aim of this study
 is to test the usability and acceptability of a Eur opean project prototype for elderly care, in an attempt
 to explore the ICT design needs of users with MCI. Methods: Participants were 28 individuals
 aged 58–95 years and with a diagnosis of MCI. Results: The results showed a low perception of
 peripheral elements and the need to place main interaction elements in the centre of the screen.
 The correlation between the general level of autonomy (daily life activities) and the ICT autonomy
 level was significant and positive. The speed of audio help had a significant impact on performance.
 Conclusion: The present work contributes to the literature on ICT usability needs of users with MCI.
 Some usability recommendations for designing interfaces for this type of user are provided in the text.

 Keywords: usability; speech interfaces; cognitive impairment; ICT; elderly; cognitive decline

1. Introduction

1.1. Demographic Changes and Mild Cognitive Impairment
      The age profile is expected to change globally in the coming decades. According to the U.S.
Census Bureau’s latest ageing report, the population will be much older in 2050. Specifically, in the
next 35 years it is expected that the increase in the number of older individuals will be considerably
greater than that of the younger population [1]. Consequently, with the ageing of the population,
the possibility of an increase in the number of cognitively impaired individuals will also rise.
      According to a World Health Organization report dementia and cognitive impairment lead the
list of chronic diseases contributing to disability and dependence among older people worldwide.
Forty-seven million people suffered from dementia in the world in 2015, and due to the ageing of
the population globally, this number is expected to be tripled by 2050. These demographic changes
not only have a strong impact on the daily lives of patients and their relatives, but also they have
substantial consequences for public finances. Specifically, the estimated global cost of dementia care in
2010 was US$604 billion, and it is projected that its worldwide cost in 2030 could be US$1.2 trillion or
more [2].

Int. J. Environ. Res. Public Health 2020, 17, 5153; doi:10.3390/ijerph17145153   www.mdpi.com/journal/ijerph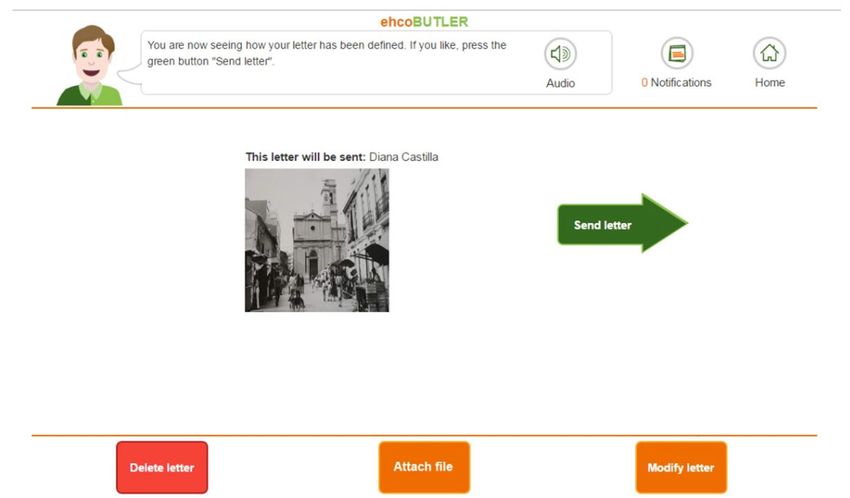
Int. J. Environ. Res. Public Health 2020, 17, 5153                                                   2 of 21

      In the previous paragraph, we have presented the global impact of dementia, which is often
characterized by an important cognitive impairment. However, dementia and its associated cognitive
impairment do not start abruptly. Conversely, dementia is a dimensional construct that begins with
small changes in the brain and symptomatology. In this sense, mild cognitive impairment (MCI) is the
clinical syndrome that describes the transitional zone between normal cognitive status and dementia
and it is estimated that approximately 10% to 15% of individuals with MCI will develop dementia [3].
Therefore, an important societal goal is to delay the transition between MCI and dementia or at least to
reduce the speed of the cognitive decline in patients with MCI. Cognitive training is the most frequently
reported form of cognition-focused intervention. It contains sessions involving practice on tasks
that target aspects of cognition such as attention, memory, and language [4]. There is now sufficient
support for the effectiveness of such training in individuals with MCI [5,6]. However, traditional
face-to-face interventions may not always be accessible to the older individuals on a large scale because
of accessibility reasons (e.g., having to travel long distances to specialized treatment centres) and
limited public economic resources. For this reason, interest in the development of technological
applications for the cognitive treatment in older adults is increasing [7]. Several studies have provided
evidence about the efficiency of cognitive training tools based on information and communication
technologies (ICT) when applied as an adjunct therapy for recovering or improving performance on
cognitive skills and self-confidence, as well as for an early intervention in individuals with MCI and
age-related cognitive decline [8–12].
      In particular, reminiscence therapy appears to be an important therapy in MCI and Alzheimer’s
disease. Reminiscence therapy is a non-pharmacological intervention used to prompt past memories
with music and old photographs, which also facilitates social interactions and increases self-esteem.
The use of ICT seems to be particularly appropriate in this kind of intervention. For example,
some studies demonstrate the feasibility of using readily available technology (digital video, images,
and music) to produce personalized multimedia biographies that hold special meaning for individuals
with Alzheimer’s disease and MCI and their families [13–16].

1.2. Information and Communication Technologies (ICTs) and Cognitive Decline
      Rapid technological advances offer an excellent opportunity to face the challenge of promoting
independence, strengthening social connectedness, and preventing isolation in older individuals [17,18].
Furthermore, a recent meta-analysis that using computers for leisure produced an overall significant
reduction in the risk of dementia [19].
      In addition to its recreational role, a systematic review of technology-supported reminiscence
therapy also supported the benefits of using technology in the elderly, this time for therapeutic
purposes [20]. Some of these benefits include access to rich and engaging multimedia reminiscence
materials, opportunities for people with dementia to participate in social interactions and take
ownership of conversations, and a reduction in barriers due to motor deficits during interactions
with media. Reminiscence therapy interventions based on ICT have also showed their efficacy in
depression treatment in the elderly [21]. This is important because several studies have pointed out
that depression, social isolation, and loneliness can negatively impact cognitive impairment [22–26].
In a similar line of supporting the benefits of using technology in the elderly, another study suggested
that interventions with tailored social networks and social contacts are also needed to increase social
contact in the elderly and to help them to delay and cope with cognitive impairment [23].
      Cognitive decline in capabilities, such as memory, attention, perceptual speed, or spatial abilities,
is part of normal ageing [27], and for this reason, the new age demography brings new challenges
related to the way to improve the independence and quality of life of elderly people and, especially,
promote their well-being in different ways [28]. New technologies can help to face these challenges,
but their utilization in the elderly and specifically in persons with MCI might have some associated
challenges. Although technology is increasingly present in everyday life, the elderly usually face
usability problems related to the unsuitable design of central features, such as the graphic user interface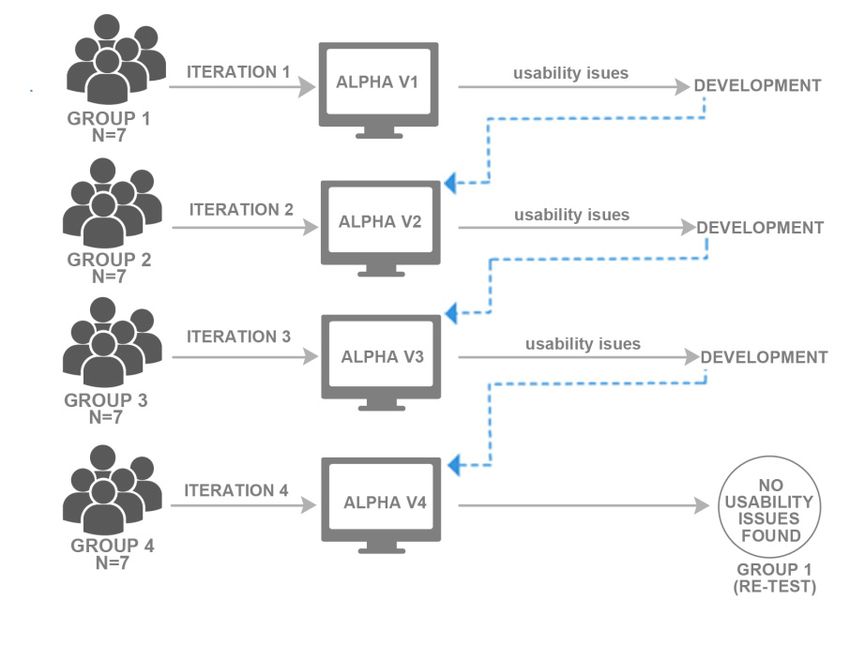
Int. J. Environ. Res. Public Health 2020, 17, 5153                                                        3 of 21

design and input device choices, to name some examples. On usability tests, elderly users face a
greater number of usability problems than young users [29–31], and their ICT experience differs not
only in terms of their success rate, but also in terms of emotional factors that should be included as
an important part of their experience [32–35]. Often these negative experiences of older users are
consolidated into what has been called a technophobia, that is a computer avoidance due to fear or
phobia of interacting with computers [36].
      Indeed, research has shown that the majority of non-ICT seniors feel “intimidated” and “anxious”
about using technology and anticipate that the Internet is difficult to use and to understand [37,38].
In this scenario, a few studies have explored the possible benefits of improving usability by using
embodied conversational agents as a form of assistive technology for users with cognitive impairment
and the results so far are promising [39]. Nowadays, the technological barrier for elderly users goes
far beyond the application design or the individual’s fear of technologies. In this sense, usability for
this type of user has to be conceptualized as a more complex problem in which related but different
constructs such as web usability and web accessibility should be taken into consideration altogether
when designing technological solutions.
      Tim Berners-Lee, inventor of the World Wide Web and Director of the World Wide Web Consortium
(W3C) states that “the power of the Web is in its universality. Access by everyone regardless of disability is an
essential aspect” [40]. In this sense, the European Commission defines web accessibility as a policy of
e-inclusion that aims “to allow everyone, including people with disabilities, to perceive, understand, navigate
and interact with the Internet” [41]. In fact, the European Commission went a step further with the
development of the Directive (EU) 2016/2102, an important document whose purpose is to ensure
digital inclusion and web accessibility by indicating specific standards in the design of websites and
mobile apps [42].
      Other important contribution that aimed to make webs more accessible to people with disabilities
was the Web Content Accessibility Guideline developed by the World Wide Web Consortium (W3C) [43].
The Accessibility Fundamentals summarized by the W3C revealed four relevant issues for older users,
namely hearing loss, vision decline, physical decline, and cognitive decline. This important document
highlighted that the cognitive decline can affect navigation, comprehension, and task completion due
to difficulties with concentration and coping with information overload, distraction from movement or
irrelevant material, and short-term memory limitations [44]. In 2019, the W3C developed a more specific
section with accessibility standards for users with cognitive or learning disabilities. These include,
to name some examples, the need to present content in different ways, make texts easily readable,
and provide enough time to read and use content [45].
      One key aspect of technology is its connectivity through the Internet. However, the technological
characteristics of the Internet (mainly its undefined structure) can be barrier for accessibility and
usability of technologies in the elderly. For instance, a meta-analysis [41] revealed negative age effects
on spatial abilities, so that time is likely to play an important role in ICT usability. This problem has an
important impact when using technologies because the use of the Internet requires spatial abilities
due to hypertext characteristics where the user must build the structure of the information or tasks
during navigation (e.g., Where was I before? Where should I go now? In which order should I do the
required steps?). As a consequence of the previous and the lack of ICT experience, elderly users show
better performance on systems with linear navigation [32,46,47]. Another aspect that adds up to the
complexity of usability in the elderly lies in the fact that the characteristics of elderly users are not
static and vary over time because there are changes due to age-related decline [48].
      The aforementioned barriers refer to the elderly in general. Not surprisingly, cognitive impairment
in this population makes it even more difficult to use technology. For example, users with cognitive
impairment make more mistakes and need more time to use web platforms due to their difficulties in
orientation [49]. Thus, it has been suggested that people with mild to moderate cognitive impairment
should be offered with simple technologies [50]. In addition to this, visual attention and control of visual
short-term memory decline as a result of neurodegenerative processes that occur with ageing, MCI,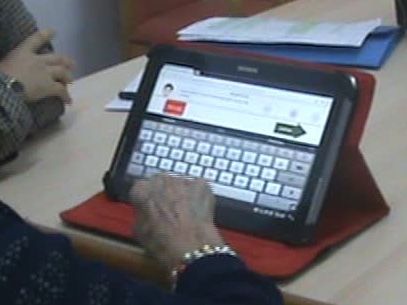
Int. J. Environ. Res. Public Health 2020, 17, 5153                                                   4 of 21

and AD [51–53], which reduces the individual’s ability to respond on a visually dynamic real-world
task [54]. Ultimately, this means that, when interacting with computers, users do not behave the way
the designers planned [55]. A popular related concept is change blindness, which is defined as the
inability to detect changes in visual scenes, in the sense that users focus their attention on an image
using visual short-term memory to store relevant information [53]. Because of this decrease in visual
attention and control of visual short-term memory, change blindness may be much greater in people
with cognitive impairment. Program designers, especially those of young ages, are not likely to be
familiar with these characteristics and needs of elderly users. This poses important limitations in the
design of technology for this population because taking into account the mental model of individuals
with MCI is crucial for the adequate design and testing of user-friendly ICT-based applications and
services [56].
     Considering the previous, this study aims to analyse the ICT usability needs of users with
MCI. Specifically, the purpose of the study is to provide some usability recommendations to design
technologies for these users. To carry out this investigation we have used an application named the
ehcoBUTLER project, a ground-breaking and comprehensive service solution designed to improve
the quality of life of older people by promoting a healthy lifestyle and active ageing through the use
of tools that enhance positive emotions and cognitive training [57]. This project has been developed
with the support of the European Union’s Horizon 2020 research and innovation programme [58].
The system has been developed following the guidelines of a software that has proven its usability
with elderly users using linear navigation [32,46,59]. The study was performed in four iterative cycles
to obtain more robust usability recommendations for ICT developments in MCI users.

2. Materials and Methods

2.1. Design
      The study consisted of a classic usability test [60], where the first prototype of the ehcoButler
system was used in a controlled environment. The assessment method used was a task analysis [61],
applied individually, where the user performed several predefined tasks in order to obtain quantitative
data. To carry out this study, only one group was defined. This included users with a diagnosis of
cognitive impairment (mild and moderate) made by a physician (neurologist or geriatrician).
      The study included performance measures during the test and measurements at pre-test and
post-test. The main task consisted of writing an email to a specific recipient and attaching a picture
facilitated by the experimenter. As a secondary task, qualitative information was collected about
user preferences, iconography, appearance of the avatar, and reality judgments about the synthetic
avatar voice.

2.2. Participants
      The inclusion criteria were: age around 60 years old or more, MCI diagnosed by a geriatrician or
neurologist, as well as conserving enough cognitive ability to have a conversation, sufficient hearing
capacity, and sufficient visual and motor abilities to interact with the system or with the professional.
      The Spanish health care system is universal (all citizens are covered), free of charge, and organized
in 17 autonomous communities that apply the General Health Act [62]. The Spanish Ministry of
Health, Social Services, and Equality approved the country’s first National Health System strategy
for Neurodegenerative Diseases in 2016. It includes early diagnosis strategies and a personalized
social and health care plan for each patient [63]. Nursing homes have protocols for cognitive
impairment assessment and interventions that are aligned with this national strategy. The users were
assessed on cognitive functions (executive functions, episodic memory, visuospatial ability, naming
ability, and verbal fluency), functionality (impairment in daily activities), neuropsychiatric symptoms,
and biomarkers, by a neurologist or geriatrician, following the guidelines of the “Mild cognitive
impairment in the elderly Consensus document” [64].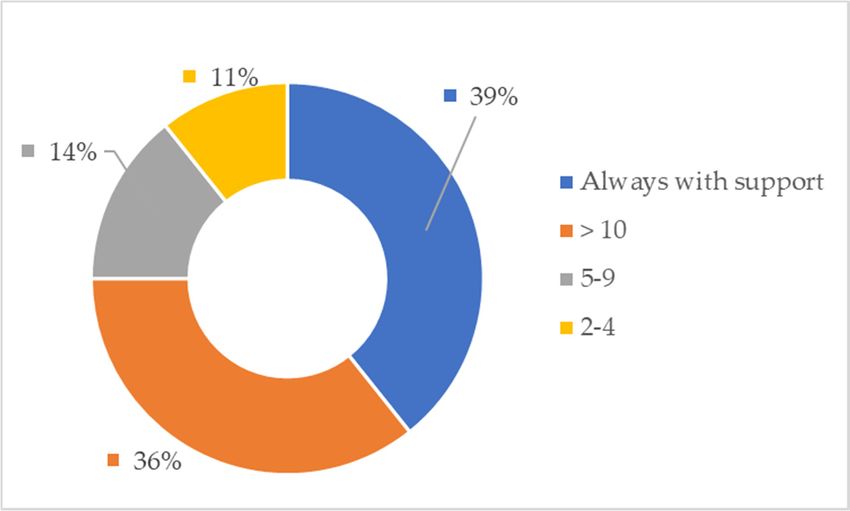
Int. J. Environ. Res. Public Health 2020, 17, 5153                                                  5 of 21

      The final sample consisted of 28 participants with a MCI diagnosis from two nursing homes: 50%
men and 50% women, aged between 58 and 95 years, with an average of 76.98 years (SD = 9.56).
      The literacy level was mostly very basic because 84.6% of the sample only went to school up
to the age of 14 (see Table A1). The average age when the sample left school was 11.27 (SD = 5.07),
with a mean of 5.92 years of school attendance (SD = 3.67). Three participants never attended school,
even though they could all read and write because they learned at home. Two participants did not recall
going to school. This educational level (low or none) is representative of people from 65 to 85 years of
age in small cities or towns in rural areas, given that the country had great economic difficulties during
the 1940s and 1950s as a result of the Spanish civil war (1936 to 1939). At that moment, most of them
left school and went to work at an early age to help their families.
      Regarding their previous experience using ICTs, 82.1% had never used a personal computer or a
tablet before this study, and only 7.1% of them had used a personal computer or a tablet more than
10 times.
      The participants were randomly divided into four groups of seven participants each in order to
test the system in four iterations.
      Apart from the end-users, three professional caregivers (working at the recruitment centres) took
part in the experiment as observers.

2.3. Materials

2.3.1. Main Software
      The first ehcoBUTLER [58] functional prototype was the main software used for the study.
The prototype was developed following all the usability characteristics of the BUTLER system,
an emotional and social platform designed for elderly people with low digital literacy skills that has
proven its usability and acceptability with elderly people without cognitive impairment [21,46,59,65].
      The most important design feature of ehcoBUTLER is the navigation system, which follows a
linear structure (i.e., like a step-by-step system) [46]. First, in the main menu, the user selects the
application to use. Then, on each step, a human-looking avatar explains where they are and what they
can do next. The avatar is “the butler” and its goal is to help them to decide what to do in every step of
the system. The avatar is represented graphically as a young man and provides the help through audio
(a synthetic voice) and text. The buttons have different colors depending on the type of action they
allow: green is for buttons whose actions allow the user to continue with a task; red allows to interrupt
a task (i.e., delete data or undo a concluded step); and orange represents secondary actions. Because
all the system applications follow the same design principles, the email application was selected for
the usability test. A complete description of the email task will be facilitated in the procedure section.

2.3.2. Variables and Measuring Instruments
     As we described in more detail below, the assessment protocol consisted of three parts, namely
user information (collected before the task), an evaluation of task-related information (performance
and user’s opinion), and effectiveness of the task as reported by professional caregivers.

User Profile
     The user profile data were collected before the usability test. It included demographic data such
as sex and educational level. In addition, we evaluated the user’s experience with computers and
the Internet, as well as whether the user had an e-mail account and had taken any computer training
courses previously.
     The level of autonomy in daily life activities was measured based on the professional’s clinical
judgement after an interview with the participant. The following item was then responded: “The user
can perform his/her daily routines entirely unassisted” with a 5-point Likert scale with response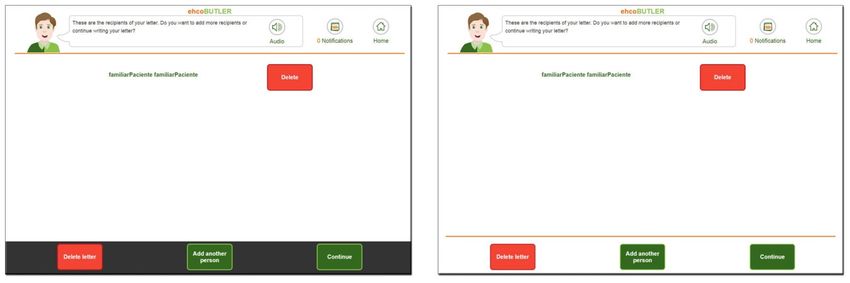
Int. J. Environ. Res. Public Health 2020, 17, 5153                                                    6 of 21

labels: (0) strongly disagree, (1) somewhat disagree, (2) neither disagree nor agree, (3) somewhat agree,
and (4) strongly agree.

Measures Based on User Performance
     Success rate. The success rate was determined in absolute values: 0 (did not successfully perform
the task); 1 (successfully performed the task).
     Assistance received. The experimenter was not allowed to help the user solve the task. However,
participants could be reminded that they could review the avatar’s help, which counted as a new
attempt. They could also be reminded about the name of the email recipient or on how to find a letter
on the keyboard. Any help was annotated.
     Number of attempts. The number of attempts was recorded, based on the number of times the
experimenter had to show the user how to review the avatar instructions to find out how to continue.

Instruments Measuring the User’s Opinion
      Post-test questionnaire for the user: face scales [66] can help to evaluate the mood state in patients
with cognitive impairment [67,68]. This questionnaire assesses the user’s opinion of the system, with
all the items using a 5-point face scale, rated from left to right with the following labels: strongly
disagree, disagree, neither agree nor disagree, agree, and strongly agree. The variables measured
were perceived ease of use, learnability and controllability, self-efficacy, flexibility, clear and easy to
understand, usefulness, and intention to use.
      Finally, a single item using a 5-point face scale to explore the feelings during the test was rated
from left to right with the following labels: very bad, bad, neither bad nor good, good, very good.
      All the items were obtained from a previous usability study with elderly users (see [32]).

Measures Regarding Professional’s Judgment
     The NASA Task Load Index–TLX [69] was filled in by the professional caregivers to evaluate the
perceived workload. This is done to obtain a measure of the effectiveness of a task. This questionnaire
provides an overall workload score based on six subscales: mental demand, physical demand, temporal
demand, performance, effort, and frustration. Each scale is divided into 21 degrees from very low to
very high. The experimenter trained the professional caregivers before the user test on how to fill in
the NASA-TLX properly.

2.3.3. Hardware
     Two set-ups were tested for this study. First, a 10”tablet (Samsung Galaxy tablet Tab2) was used
because this was originally expected to be a suitable set-up due to its portability and affordable price.
However, this was ruled out at the beginning of the study due to additional usability difficulties
resulting from the use of the logical keyboard of the device, which hides half the screen during typing
processes (see Figure A1). The second set-up which was finally used in the study, was a personal
computer with a touch screen and physical keyboard, big keys in ABC order, and a normal keyboard
with QWERTY order (all in one MSI Model AE222-274 G3250 4GB 1TB W10 21.5 inches). A videocamera
with a tripod was used to record the sessions.
     In addition to the experimenter, the professional caregivers also assessed indicators of performance
on the task (whether the user completed the task or not, the number of attempts, the degree of assistance
needed during the test, and the technology used). They also reported their clinical judgment about
the difficulty of the task, feelings observed in the user, together with suggestions and recommended
improvements in the system. Finally, the professional assessed the ability of the user to use the system
in an autonomous way (i.e., without any kind of support), using a 5-point Likert scale with response
labels 0 = strongly disagree, 1 = somewhat disagree, 2 = neither disagree nor agree, 3 = somewhat
agree, and 4 = strongly agree.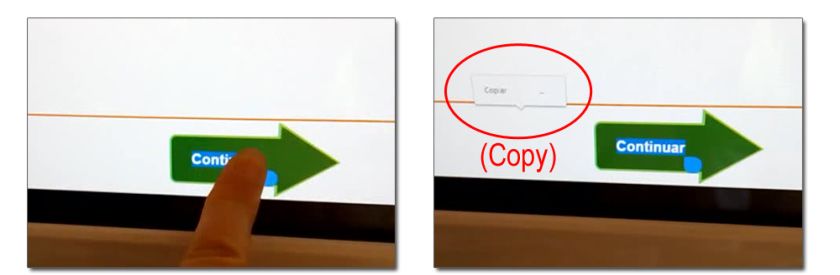
Int. J. Environ. Res. Public Health 2020, 17, 5153                                                   7 of 21

2.3.4. Statistical Software
     For data analysis, IBM SPSS 22.0 (IBM Corp., Armonk, NY, USA) was used. Descriptive statistics
were performed to explore the frequency and percentage of responses for all the variables and a
Spearman correlation analysis was conducted to explore the relationship between the user’s level of
general autonomy and the number of attempts, as well as the relationship between the user’s level of
general autonomy and the extent to which the user could use the system autonomously in the future.
A contingency table was created to explore the relationship between the user’s performance and feelings
during the task. This was done to explore whether the user’s feelings were related to performance.
To investigate whether the non-verbal language displayed by the users matched with their reported
feelings, we asked the professionals to rate the observed user’s feelings. Then both ratings were
correlated by Spearman analysis. Then, results were graphically represented with Microsoft Excel
(Microsoft Corporation, Redmond, WA, USA).

2.4. Procedure
     To carry out this study, several nursing homes and socio-health organizations dedicated to elderly
care in the region of Valencia (Spain) were contacted. We debriefed the managers of the organizations
about the objective of the project and the need to test the system with people with MCI diagnosed by
a physician (neurologist or geriatrician).
     Two collaboration agreements were finally signed between the Jaume I University and two nursing
homes from the Health Department of the Valencian Community (Spain). It took two months for the
study to be conducted, including the development phases.
     The medical staff of both nursing homes selected users with MCI as candidates for the study.
Due to the candidates’ cognitive state, the nursing homes contacted their families to obtain their
informed consent to participate and permission to video-tape the sessions. For users under the tutelage
of the local government (Health Counsel of the Valencian Community), an additional permit was
required to carry out the study. The research was conducted following the American Psychological
Association’s ethical principles and code of conduct [70]. The study was approved by the Ethics
Committee of the Gestión Sociosanitaria del Mediterráneo (GESMED, Socio-Sanitary Management of the
Mediterranean; REC number: CD643566/2017). The participants’ data confidentiality and anonymity
were ensured. Forty-six users were asked to participate in this study voluntarily. Of these, 33 agreed
to participate and 28 met the inclusion criteria and signed the data and recording confidentiality
agreement. The experimental session consisted of a usability test [60], where a task analysis was
carried out [61]. The experimenter took all the necessary hardware to be used in the study to the
nursing homes. The rooms used in the centres were big enough to place the equipment and facilitate
the movement of people with reduced mobility.
     The centre’s psychologists (the professional caregiver) accompanied the participants while the
expert in usability (the experimenter) conducted the tests. Next, the experimenter presented the task
and administered the pre-test assessment protocol (demographic data and previous experience with
computers and the Internet). Once the questionnaires were completed, the experimenter explained the
task to the user, gave them the instructions for the task on paper, and asked if they would prefer to use
a physical or a logical keyboard.
     The main task involved writing an email to a specific contact already registered in the address
book and attaching a specific picture using the ehcoBUTLER system. The user had the instructions on
paper, with the name of the contact in red, the text of the email, and the image to be attached, so that
they could follow the instructions as easily as possible and could effectively perform the task. Therefore,
the user did not have to memorize the instructions. The secondary task required the evaluation of the
avatar and the help voice from a qualitative point of view. We also asked the participants to explain
the reasons for their preferences. In order to obtain reliable data on task performance, the sessions
were video-taped. A usability expert reviewed the sessions.
Int. J. Environ. Res. Public Health 2020, 17, 5153 8 of 21
The role of the experimenter was to encourage the users to perform the task autonomously, without
providing additional instructions. If the users required assistance, the experimenter encouraged them
to interact with the avatar. Success meant that the user could complete the task without the help
of the experimenter. If any kind of help was needed to complete the task, this was noted as failure.
The number of attempts
Int. J. Environ. was 2020,
Res. Public Health recorded
17, x according to the number of times the experimenter had to21show
8 of
the user how to review the avatar instructions to find out how to continue. The experimenter stood
next to theInusers accordance
throughoutwith thetheIterative
usabilityUser
testInterface
(see FigureDesign
A2).[60], the study was divided into four
iterative cycles. This began with the first functional prototype of the system and included seven new
In accordance with the Iterative User Interface Design [60], the study was divided into four
users in every iteration. Usability issues were found in each iteration and the proposals for
iterative cycles. This began with the first functional prototype of the system and included seven
improvement were implemented by the development team. In each iteration the usability issues
new users
found in wereevery
fixed,iteration.
and after Usability
tested again,issues
untilwere found
arriving in each4,iteration
to iteration where noand the proposals
usability problems for
improvement
were found. were implemented
Finally, by the
a re-test was development
carried out with theteam.
usersIn each
from iteration
iteration theFigure
1 (see usability
A3).issues
Finally, found
were fixed, and after tested again, until arriving to iteration 4, where no usability
after finalizing the test, the post-test questionnaires were answered by the users with the problems were found.
Finally, a re-test wassupport
experimenter’s carried (their
out with the users
opinion aboutfrom iteration
the system and1 (see
howFigure A3).
they felt Finally,
during theafter
test).finalizing
The
professional’s
the test, the post-test clinical judgment was
questionnaires alsoanswered
were recorded by at this
the stage.
users Aswithnoted earlier, this included
the experimenter’s support
(their whether
opinion the aboutuserthecompleted
system and the how
task, they
the number of attempts,
felt during theThe
the test). assistance received,
professional’s the opinion
clinical judgment
about the system and the technology used, the workload experienced,
was also recorded at this stage. As noted earlier, this included whether the user completed the and suggestions and task,
recommended changes.
the number of attempts, the assistance received, the opinion about the system and the technology used,
the workload
3. Resultsexperienced, and suggestions and recommended changes.
3. Results
3.1. Main Usability Findings
3.1. Main
3.1.1.Usability Findings
Solved Through Behavior Program Changes
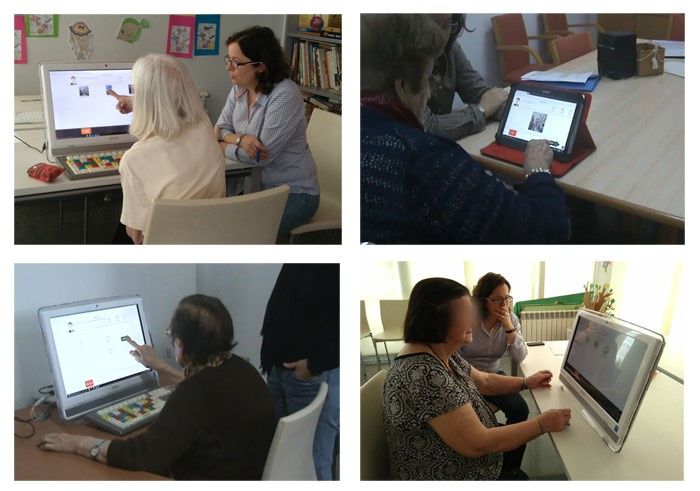
An important
3.1.1. Solved problem was
through Behavior relatedChanges
Program to the way in which users pressed on the screen. The users
performed very long pulsations (an average of 3–4 s pressing), which led to the following problems:
An important
instead problem
of clicking was button
on the main related(e.g.,
to the way inthe
continue), which usersbutton
secondary pressed oncopy)
(e.g., the screen. The users
was activated.
performed verytext
Thus, the long pulsations
label (ancopied,
button was average of 3–4 sinpressing),
as shown which
Figure 1, as led to
opposed to following
the following
to theproblems:
next
instead of clicking on the main button (e.g., continue), the secondary button (e.g., copy) was activated.
action.
Thus, the text label button was copied, as shown in Figure 1, as opposed to following to the next action.
(a) (b)
FigureFigure 1. Troubles
1. Troubles founddue
found dueto
to very
very long
longpulsations. (a) Text
pulsations. label label
(a) Text buttonbutton
selectedselected
due to very
duelong
to very
pulsation. (b) Secondary button activated (copy) instead clicking on the main action button
long pulsation. (b) Secondary button activated (copy) instead clicking on the main action button (the green
arrow).
(the green arrow).
This This problem was solved by writing a piece of code that overrides the behaviour in the web
problem was solved by writing a piece of code that overrides the behaviour in the web
browsers related to the right-click mouse events by converting these events to left-click mouse events.
browsers related to the right-click mouse events by converting these events to left-click mouse events.
Another usability issue observed was the user’s need to see what they are pressing while
Another usability issue observed was the user’s need to see what they are pressing while
interacting with the touch screen. As a result of this, they clicked outside buttons. To solve this
interacting with
problem, wethe touch screen.
programmed an As a result area
interaction of this, theythan
higher clicked
the outside buttons.
visual button Tothus
only, solve this problem,
preventing
we programmed an interaction
missclicking for this reason. area higher than the visual button only, thus preventing missclicking
for this reason.
Regarding the help audio facilitated by the avatar voice (a synthetic voice), we found problems
with standard
Regarding thespeech speed (around
help audio 3 words
facilitated by theperavatar
second). Some
voice (aparticipants had problems
synthetic voice), following
we found problems
the instructions
with standard speech because
speedthese were3too
(around fast for
words perthem. The speed
second). Somewas changed tohad
participants 2 words per second,
problems following
adding 8 spaces (2 s) between sentences in order to clearly separate the concepts in the instructions.
For example: “You are now viewing your letter (2 s of silence). If you like it (2 s of silence), press theInt. J. Environ. Res. Public Health 2020, 17, 5153 9 of 21
the instructions because these were too fast for them. The speed was changed to 2 words per second,
adding 8 spaces (2 s) between sentences in order to clearly separate the concepts in the instructions.
Int. J. Environ. Res. Public Health 2020, 17, x 9 of 21
For example: “You are now viewing your letter (2 s of silence). If you like it (2 s of silence), press the
green button
green buttonthatthatsays:
says:Send
Sendletter”. Afterchanging
letter”. After changingthe
the voice
voice speed,
speed, 92%92% of users
of the the users informed
informed that that
theythey
liked the voice and that it was easy
liked the voice and that it was easy understand.
Int. J. Environ. Res. Public Health 2020, 17, x
to understand. 9 of 21
3.1.2. Solved
3.1.2.
green through
Solved thatGraphical
through
button Send Changes
Graphical
says: Changes
letter”. After changing the voice speed, 92% of the users informed that
they liked the voice and that it was easy to understand.
TheThemainmain usabilityfinding
usability findingwe we encountered
encountered related
related totothethecognitive statestate
cognitive and and
mental modelmodel
mental of of
this
this type type of
of useruser had to do with their attentional capacity. A large number of users did not see the
3.1.2. Solvedhad to doGraphical
through with their attentional capacity. A large number of users did not see the
Changes
interaction buttons during the first usability iteration. Our first hypothesis was that maybe they suffer
interaction buttons during the first usability iteration. Our first hypothesis was that maybe they suffer
The main
some cognitive usabilitytofinding
blindness bottomwe encountered
elements, whichrelated
might tobethecaused
cognitive statedark
by the and grey
mental model
colour of of
the
some cognitive
this type blindness
of user had to
to bottom
do with elements,
their which
attentional might
capacity. A be caused
large number byofthe dark
users did grey
not colour
see the of the
graphic user interface (GUI). This is shown in Figure 2a. Because we anticipated that some users
graphic
might
user interface
interaction
perceivebuttons
(GUI).
that theduringThis
darkthe
is shown
first
grey
in Figure
usability
band wasiteration.
2a.
OurBecause
an external first wethe
anticipated
hypothesis
element,
thatinterface
was that user
graphic maybe some users
they suffer
was
might
perceive that
some the dark
cognitive grey
blindnessbandto was
bottom an external
elements, element,
which might the
be graphic
caused by user
the dark
redesigned and the dark grey colour was replaced by an orange line, following the upper design as interface
grey was
colour ofredesigned
the
and in
the graphic
dark2b.
Figure usercolour
grey interface
was(GUI). This isby
replaced shown in Figure
an orange 2a. following
line, Because wethe anticipated that some
upper design users
as in Figure 2b.
might perceive that the dark grey band was an external element, the graphic user interface was
redesigned and the dark grey colour was replaced by an orange line, following the upper design as
in Figure 2b.
(a) (b)
Figure 2. Graphic userinterface
interface (GUI)
(GUI) colour
colourchange inin
bottom interaction area.area.
Figure 2. Graphic user (a) change bottom (b) (a) Original
interaction design.design.
(a) Original
(b) Modified
(b) Modified design.
design.
Figure 2. Graphic user interface (GUI) colour change in bottom interaction area. (a) Original design.
(b) Modified
Despite design.users still did not see the elements at the bottom. The study of the sessions
Despite thisthis change,
change, users still did not see the elements at the bottom. The study of the sessions
revealed that the less autonomous users presented a very acute attentional focus towards the centre
revealed that the less autonomous
Despite this change, users still usersdid presented a very acute
not see the elements at the attentional focusoftowards
bottom. The study the centre
the sessions
of the screen, to the detriment of the interaction elements placed at the bottom or sides of the screen.
revealed
of the screen, tothat
thethe less autonomous
detriment users presented
of the interaction a very acute
elements placedattentional focus towards
at the bottom the of
or sides centre
the screen.
In order to solve this problem, the graphic user interface was redesigned again, placing the main
In orderofto
thesolve
screen,this
to the detrimentthe
problem, of the interaction
graphic user elements placed
interface was atredesigned
the bottom oragain,
sides ofplacing
the screen.
the main
interaction
In orderelements
to solve in thisthe central area,
problem, that is,user
the graphic within the attentional
interface focus of
was redesigned theseplacing
again, users (see
the Figure
main
interaction
3). With elements
this change, in the central area,
theininteraction thatwere
is, within the attentional focus of these users (see Figure 3).
interaction elements the central issues
area, that is, fully
withinresolved.
the attentional focus of these users (see Figure
With this
3).change,
With thisthe interaction
change, issuesissues
the interaction werewere
fullyfully
resolved.
resolved.
Figure 3. Final graphic user interface.
Figure
Figure 3.3.Final
Final graphic
graphic user
userinterface.
interface.Int. J. Environ. Res. Public Health 2020, 17, 5153 10 of 21
Int. J. Environ. Res. Public Health 2020, 17, x 10 of 21
3.2. Quantitative
3.2. Quantitative Results
Results
3.2.1. Task Performance
resultswere
Good results were obtained
obtained on performance.
on task task performance. Specifically,
Specifically, 89%
89% of the of the participants
participants successfully
successfullythe
completed completed the
task (even task (even
though though of
the majority thethem
majority of them
had no had ICT
previous no previous ICT experience).
experience).
3.2.2. Number of
3.2.2. Number of Attempts
Attempts
The number of
The number of attempts
attempts toto complete
complete thethe task
task varied
varied across
across participants
participants (range
(range 11 to
to 6).
6). However,
However,
50% of the users managed to complete it in just 1 or 2 attempts (median = 2.50, SD = 1.59).
50% of the users managed to complete it in just 1 or 2 attempts (median = 2.50, SD = 1.59). Comparing Comparing
the sum of
the sum of attempts
attempts during
during the
the study,
study, we
we observed
observed that
that there
there was
was aa higher
higher number
number of of attempts
attempts at the
at the
beginning
beginning ofof the study due
the study due to
to usability
usability problems
problems related
related toto the
the touch
touch interaction
interaction (long
(long pulsations
pulsations that
that
activate selecting text or the contextual menu). We conducted a Spearman correlation
activate selecting text or the contextual menu). We conducted a Spearman correlation analysis analysis between
the user’sthe
between general
user’slevel of autonomy,
general rated by the
level of autonomy, professional
rated caregivers, caregivers,
by the professional and the number of attempts.
and the number
The correlation
of attempts. Thewas not significant
correlation = 0.17, p =(r0.396).
(rssignificant
was not s = 0.17, p = 0.396).
3.2.3. Workload NASA
3.2.3. Workload NASA Task
Task Work
WorkLoad
LoadIndex)
Index)
The
The workload during the
workload during the task
task was
was low
low or
or very
very low
low on
on all
all subscales
subscales (see
(see Figure
Figure 4),
4), achieving
achieving aa
general 4.55 (SD =
general mean of 4.55 (SD = 5.65) and means on all scales below the central point of 11 (range 00 to
mean of 5.65) and means on all scales below the central point of 11 (range to 21,
21,
Very low demand = 0; Very high demand =
Very low demand = 0; Very high demand = 21).21).
Figure 4.
Figure 4. NASA
NASA task
task work
work load
load index
index results.
results.
3.3. Quantitative Results
3.3.1. Usability Variables
3.3.1. Usability Variables and
and User
User Opinion
Opinion
In general, the
In general, users’ opinion
the users’ opinion was good, as
was good, as all
all the
the usability
usability variables
variables were
were scored
scored on
on the
the positive
positive
side
side of the scale exceeding the midpoint (i.e., exceeding 2 points on a scale ranging from 00 to
of the scale exceeding the midpoint (i.e., exceeding 2 points on a scale ranging from to 4).
4).
Specifically, the users found the system easy to use and useful for their lives, they felt confident
Specifically, the users found the system easy to use and useful for their lives, they felt confident while while
using it, felt
using it, felt that
that they
they had
had control
control over
over the
the system,
system, found the button
found the size large
button size large enough
enough to to see
see it
it and
and
interact with it, and reported that they would like to use the system in the future (see
interact with it, and reported that they would like to use the system in the future (see Figure 5). Figure 5).
The
The variable
variable withwith the
the highest
highest average
average score
score was
was ease
ease of
of use,
use, with
with 3.07 (SD =
3.07 (SD 0.98), followed
= 0.98), followed by by
useful with 3.00 (SD =
useful with 3.00 (SD = 1.19). 1.19).Int. J. Environ. Res. Public Health 2020, 17, 5153 11 of 21
Int. J. Environ. Res. Public Health 2020, 17, x 11 of 21
Figure 5. Average
Average of usability variables.
their feelings
Regarding their feelings during
duringthe
thetest,
test,79%
79%ofofthe
theusers
usersfelt
felt from
from normal
normal to to very
very good.
good. A
A contingency
contingency table
table was
was createdtotoexplore
created explorethe
therelationship
relationshipbetween
between user
user performance
performance and feelings
during the task (see Table
Table 1).
1).
Table 1. User performance vs. feelings during the task: contingency table.
Table 1.
Task
Task Performance
Performance
TotalTotal
Fail
Fail Success
Success
Very bad
Very bad 00 0 0 0 0
Bad
Bad 22 1 1 3 3
User
User Felt
Felt Neutral
Neutral 11 4 4 5 5
Good 0 15 15
Good 0 15 15
Very good 0 5 5
Very good 0 5 5
Total 3 25 28
Total 3 25 28
Only three users (10%) referred to feeling bad during the experiment. They indicated that they
Only three users (10%) referred to feeling bad during the experiment. They indicated that they felt
felt nervous because of the test conditions (people looking at them and assessing what they were
nervous because of the test conditions (people looking at them and assessing what they were doing).
doing). The number of users who felt bad or failed the task were too low to perform a Chi-square
The number of users who felt bad or failed the task were too low to perform a Chi-square analysis.
analysis.
3.3.2. Intention to Use
3.3.2. Intention to Use
Regarding the intention to use the system in the future, 82% of the users expressed that they
would Regarding
like to usethe intention
it often in thetofuture
use the
(21%system in the
strongly future,
agree; 61%82% of the agree;
somewhat users expressed
7% neitherthat they
disagree
would like to use it often in the future (21% strongly
nor agree; 0% somewhat disagree, 11% strongly disagree). agree; 61% somewhat agree; 7% neither disagree
nor agree; 0% somewhat disagree, 11% strongly disagree).
3.3.3. Preferences about Avatar Appearance and Voice
3.3.3. Preferences about Avatar Appearance and Voice
From a graphic point of view, users indicated that they liked the age of the avatar (young),
From that
estimating a graphic point 30
it was about of years
view,old.
users indicated
Regarding thethat they
voice, liked
none theparticipants
of the age of the perceived
avatar (young),
that it
estimating that it was about 30 years old. Regarding the voice, none of the participants perceived
was a synthetic voice. Adjectives such as “nice”, “polite”, or “kind” were used the most to describe that
it.
it was a synthetic voice. Adjectives such as “nice”, “polite”, or “kind” were used the most to describe
3.4. Professional Opinion
it.
3.4.1.
3.4. Ability to Opinion
Professional Use the System in an Autonomous Way
Before the experiment, the professional caregivers rated the level of autonomy the users had in
3.4.1. Ability tolives
their everyday Use the System
while in an Autonomous
performing Way
any kind of task.
Before the experiment, the professional caregivers rated the level of autonomy the users had in
their everyday lives while performing any kind of task.Int. J. Environ. Res. Public Health 2020, 17, 5153 12 of 21
Int. J. Environ. Res. Public Health 2020, 17, x 12 of 21
After
After thethe usability
usability task,
task, the
the professional
professional caregivers
caregivers also also rated
rated their
their clinical
clinical judgment
judgment aboutabout the
the
level of user autonomy using the system, revealing that 46% of the users would
level of user autonomy using the system, revealing that 46% of the users would be able to be able to autonomously
use the system in
autonomously the
use future
the without
system in theany
futurekind of support.
without Onlyofinsupport.
any kind 14% of the
Onlycases did the
in 14% professional
of the cases did
caregivers describe that the users would need frequent support, but they felt
the professional caregivers describe that the users would need frequent support, but they felt that 39% of the sample
that
would always need support.
39% of the sample would always need support.
We
We conducted
conducted aa Spearman
Spearman correlation
correlation analysis
analysis between
between thethe user’s general level
user’s general level of
of autonomy,
autonomy,
rated by the professional caregivers and the extent to which they thought
rated by the professional caregivers and the extent to which they thought the user could the user could use the use
system
the
autonomously.
system autonomously. The correlation was significant
The correlation and positive
was significant s = 0.45; p
and(rpositive (rs==0.016).
0.45; pThis correlation
= 0.016). This
indicates
correlation that the professional
indicates that the caregivers
professional thought that users
caregivers with that
thought a high degree
users withof autonomy
a high degreein their
of
everyday lives could also use the system in a more autonomous way in the future,
autonomy in their everyday lives could also use the system in a more autonomous way in the future, whereas users with
low autonomy
whereas users in their
with lowroutines would
autonomy in also
theirhave low autonomy
routines would also in have
usinglow
the system.
autonomy It seems
in usinglogical
the
that if the user is not autonomous in his/her daily life, it would be very difficult
system. It seems logical that if the user is not autonomous in his/her daily life, it would be veryfor him/her to use the
system
difficultwithout assistance.
for him/her to use the system without assistance.
3.4.2. Sessions Needed
3.4.2. Sessions Needed to
to Learn
Learn toto Use
Use the
the System
System inin an
an Unassisted
Unassisted Manner
Manner
The
The following
following analysis
analysis evaluates
evaluates to
to which
which extent
extent the
the professionals
professionals believed
believed that
that the
the users
users would
would
be able to use the system on their own with some training. According to the professionals’
be able to use the system on their own with some training. According to the professionals’ opinion, opinion,
39%
39% of ofusers
userswould
wouldalways
always need
needsupport
supportto use the system.
to use The also
the system. The indicated that 36%
also indicated thatof36%
usersofwould
users
need more than 10 training sessions to use the system on their own. Finally, they
would need more than 10 training sessions to use the system on their own. Finally, they reportedreported that 14%
that
of them would need between 5 and 10 training sessions to use the system autonomously
14% of them would need between 5 and 10 training sessions to use the system autonomously and and 11% of
them would only need 2 to 4 training sessions (see Figure 6).
11% of them would only need 2 to 4 training sessions (see Figure 6).
Figure 6. Estimated
Figure 6. Estimated number
number of
of training
training sessions
sessions to
to use
use the
the system in an
system in an autonomous
autonomous way.
way.
3.4.3. Professional Opinion about the Users’ Feelings
The professionals also rated
rated how
how they
they thought
thought the
the users
usersfeltfeltduring
duringthe
thetest.
test.We
Weconducted
conducteda
aSpearman
Spearmancorrelation
correlationanalysis
analysisbetween
betweenfeeling
feelingscores
scoresgiven
givenby bythe
the user
user and
and those
those given
given by the
professional. The
The correlation
correlation was significant and positive (r (rss =
= 0.59; pp =
= 0.001), indicating a large
agreement between the experienced user feeling and the professional caregiver’s
agreement between the experienced user feeling and the professional caregiver’s impression about
impression the
about
user’s feeling.
the user’s feeling.
4. Discussion
The present study aimed to test the usability of a prototype system designed for users with MCI
and make adaptations to it based on the results. For this purpose, a functional prototype email system
was designed based on the usability design principles of the Butler system (i.e., the design followedInt. J. Environ. Res. Public Health 2020, 17, 5153 13 of 21
4. Discussion
The present study aimed to test the usability of a prototype system designed for users with
MCI and make adaptations to it based on the results. For this purpose, a functional prototype email
system was designed based on the usability design principles of the Butler system (i.e., the design
followed the National Institute on Aging checklist [71] and added linear navigation and audio and
text help through an avatar) [59]. The system was tested in two nursing homes of the Health Council
of the Valencian Community (Spain). The results showed differences between the present study and
the findings obtained from previous research with the same web design but a different population
(i.e., people without cognitive impairment) [32,46]. The main usability issues revealed in the present
study compared with those of users without MCI were the following:
• Related to spatial abilities and attention. The results showed a low perception of peripheral elements
and the need to place the main interaction elements (e.g., continue the action in the step-by-step
navigation) in the center of the screen because less autonomous users showed an attentional focus
on this central part of the screen and attentional blindness to the peripheral graphical elements.
• Related programming interaction. Given that users expect a real time change in buttons (such as
sinking down when pressed), the interaction with the buttons was performed by pressing them
for a long time, causing an unexpected interaction result (copying text or activating the secondary
browser menu). On the other hand, we observed the user’s need to see what they were pressing
while touching the buttons. This explains why they clicked outside the buttons.
• Related audio help. The standard speed of synthetic speech (3 words per second) was too fast,
and most of the users were not able to follow the instructions.
Our findings raise some novel questions about the design of interfaces for MCI users. For example,
several studies point out that the use of audio and text support can benefit both novel and experienced
older users [72]. However, audio interfaces also could represent a new usability barrier because they
force the user to work with memory and mental agility. These new interfaces allow us to avoid the
keyboard and present a user interface with less text, but the audio interface adds other difficulties such
as having to understand and retain information while making interaction decisions. It is well known
that, because speech is linearized, audio instructions as a unimodal strategy impose difficulties in the
elderly [73]. In the case of cognitively impaired users, this effort could become another step in the
technological barrier stairway. If we take into account that one of the handicaps in MCI is memory
loss and a decrease in mental agility, we could encounter a real barrier that goes beyond usability and
could become a serious accessibility problem for this kind of user.
Regarding the audio interface to support the interaction, previous studies with elderly users
without cognitive impairment suggest that speed adjustment is not necessary [72]. However, our
findings showed that it is likely to be necessary to adjust the speed of the speech, as well to add a
short time separation between phrases for users with MCI, probably because they need more time to
process information. Our study revealed positive results from adjusting the speech speed to 2 words
per second and adding 2 s of silence between short sentences, which was done to clearly separate the
concepts of the instructions and to give the user time to understand them. At this point, we think it
is important to differentiate between input and output audios. Our study only explores this feature
as an output of an application, that is, when the user receives information passively (in our case as a
complement of the text help). We cannot extrapolate our conclusions to audio inputs, that is, when the
user gives audio instructions to the system.
In addition to the findings with the audio interface, our results showed usability difficulties
related to the graphic design. A metaphor in this context is how we represent an interaction with the
system in an understandable way. For example, a metaphor in a graphic interface could be represented
by the buttons and other visual elements like the avatar or the space to write. The commonly used
metaphors represented in the technology do not correspond to the previous experience of users with
a low technological profile and according literature this can be a barrier [59,74]. This might be theYou can also read