DESMAN - City of York Strategic Plan for the Positive Economic Impact - City of York, PA
←
→
Page content transcription
If your browser does not render page correctly, please read the page content below

Strategic Plan for the
   City of York
   Parking System for
Positive Economic Impact

       FINAL REPORT

                DESMANDesign Management
                 50 Public Square Suite
                     626 Cleveland, OH
                                 44113
                         216.736.7110

                           March ϮϬϭϳ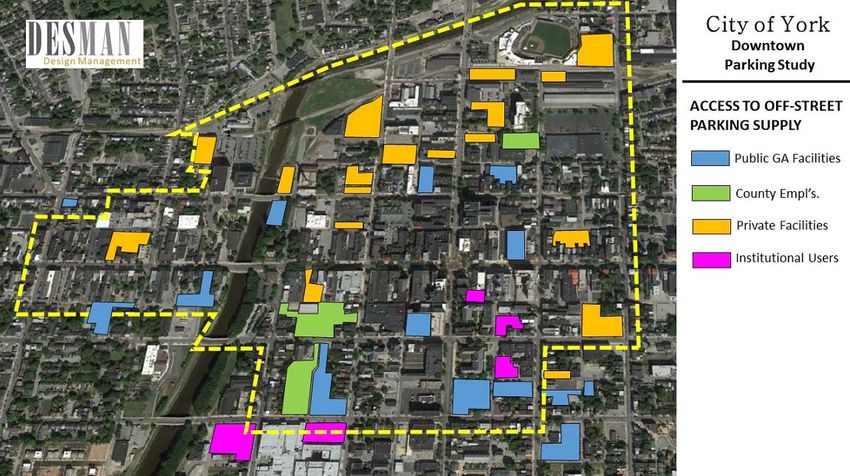
City of York
Parking System Strategic Plan
City of York, PA
Parking System Strategic Plan
EXECUTIVE SUMMARY
The City of York, PA, through the General Authority, retained DESMAN to undertake a comprehensive
assessment of the City’s municipal parking system, with the goal of producing a parking system master
plan for the off‐street parking garages and surface lots, as well as the on‐street parking meters. The scope
of the assessment covered the physical condition, utilization and general adequacy of the supply of
parking presently available to serve the downtown area and the surrounding neighborhoods. The
efficiency and effectiveness of parking enforcement, property maintenance, revenue collection, and the
overall management of the City’s parking program were also examined as part of the assessment.
At the outset of the assessment, DESMAN interviewed front line City operations staff, supervisors, and
department heads that had direct and indirect association with the parking system and related programs.
Officials with the local Board of Education and County Government were interviewed, as were numerous
community stakeholders representing a broad array of interests and perspectives. These interviews
exposed a commonly held view among the participants that the current organization and administration
of the parking system was failing to serve and complement the positive changes occurring and being
promoted in downtown. However, there were many different viewpoints on the causes and extent of the
system’s problems, as well as ideas about how to rectify the problems.
The key findings from the assessment of the existing parking system include the following:
The City controls the parking market – The City’s system of on‐ and off‐street parking assets
constitutes nearly 85% of the downtown public parking supply. Most privately owned parking
facilities provide no public parking or only provide public parking on a monthly lease basis. There
are only two private parking facilities that offer daily pay parking to downtown visitors.
There is a misconception that more parking is needed in downtown – The City’s off‐street
parking assets are underutilized. Additionally, the turnover of the most desirable on‐street
spaces is insufficient and a significant portion of the on‐street meter system covers geographical
areas where metered parking is no longer warranted due to declining parking demand.
The City’s parking garages are in good physical condition, but the City’s meter system and off‐
street lots are in fair and poor condition, respectively – The City’s parking lots would benefit
from better signage, asphalt resurfacing, striping and, in some cases, better lighting. A significant
proportion of the meter system is controlled by 20+ year‐old meters, which have been costly and
difficult to maintain and keep operational.
Technology upgrades are warranted in several key areas – The most of the on‐street meter
City of York
Parking System Strategic Plan
inventory is outdates and nearing the end of its useful life. The parking access and revenue
control system at the City garages is unreliable and exposes the City to potential revenue
leakage. The enforcement technology also needs to be upgraded.
Current parking rates and regulations are uncomplimentary and, in some instances, do not
promote the desired parking behaviors – Short‐term rates at the City’s three parking garages
are twice as high as the short‐term rates at on‐street parking meters in downtown. Combined
with a two‐hour parking time limit for all on‐street metered parking, this results in a significant
imbalance between short‐ and long‐term utilization of the City’s parking assets.
The current administrative organization and daily oversight of the parking system is unfocused
and misaligned with the fundamental mission of the program – The present organizational
structure charged with operating and overseeing the City’s parking system is fragmented and
unfocused. There is not an individual at the City who has overall day‐to‐day accountability for
parking, despite the fact that the parking system, together with the parking enforcement
program, generated in excess of $3.1 million in revenue for the City in 2015.
To address these existing shortcomings, DESMAN has formulated a collection of recommendations for
consideration by the City and the General Authority. Implementing these recommendations will optimize
the utilization and level of service of the system, reduce operating costs, streamline back office
management, and improve the financial and operational performance of the system.
1. Make Changes to Parking Meter Rates and Parking Time Limits
2. Eliminate Parking Time Limit Restrictions in Low Demand Areas
3. Reduce the Inventory of Underutilized, Older Meters
4. Establish a Three‐Tiered Structure for Meter Parking Rates
5. Introduce Pay‐by‐Phone Payment Service for On‐Street Meter Parking
6. Enact Pay‐by‐Plate Platform for Parking at On‐Street Meters
7. Transfer Parking Enforcement Program Oversight to the General Authority
8. Acquire and Implement License Plate Recognition Technology for Parking Enforcement
9. Reduce Hourly Rates for Short‐Term Parking in the Downtown Garages
10. Expand the Operating Hours of the Parking Garages
11. Devise and Implement Plans to Convert the Garages to Fully Automated Facilities
12. Acquire and Install New Access and Revenue Control Equipment for the Garages
13. Create Single Point of Administrative Accountability for the Parking System
City of York
                                                                                                         Parking System Strategic Plan

                                                   TABLE OF CONTENTS
                                                                                                                                           Page

INTRODUCTION & BACKGROUND ................................................................................................. 1
  Study Area .................................................................................................................................... 1

PARKING SUPPLY/DEMAND AND DEMOGRAPHIC STUDY ........................................................... 3
  On‐Street Spaces.......................................................................................................................... 3
  Off‐Street Parking Facilities ......................................................................................................... 5

PARKING UTILIZATION SURVEY FINDINGS .................................................................................... 9
  On‐ and Off‐Street Parking Utilization ......................................................................................... 9
  On‐Street Parking Space Turnover & Duration of Stay.............................................................. 18
  Existing Supply & Demand Conclusions ..................................................................................... 24

FUTURE SUPPLY/DEMAND BASED ON ECONOMIC DEVELOPMENT PLANS ............................... 24
  Impacts of Planned and Proposed Developments on the Parking System ............................... 24

EVALUATION OF CURRENT ASSETS.............................................................................................. 27
  Parking Garage Condition Assessments .................................................................................... 27
  Parking Lot Condition Assessments ........................................................................................... 31

PARKING SYSTEM TECHNOLOGY ASSESSMENT .......................................................................... 32
  Parking Access and Revenue Control System Technology Assessment .................................... 32
  Parking Meter System Technology Assessment ........................................................................ 35
  Parking Meter System Enforcement Technology Assessment .................................................. 36
PARKING SYSTEM MANAGEMENT REVIEW................................................................................. 36
  Parking System Organizational and Administrative Oversight .................................................. 36

PARKING SYSTEM FINANCIAL PERFORMANCE REVIEW.............................................................. 39
  System Financial Performance................................................................................................... 39
PARKING SYSTEM POLICY & PROGRAM REVIEW ........................................................................ 41
  Parking System Rate Analysis .................................................................................................... 41
  Parking Enforcement & Meter Collections ................................................................................ 44
  Parking Garage Operations ........................................................................................................ 46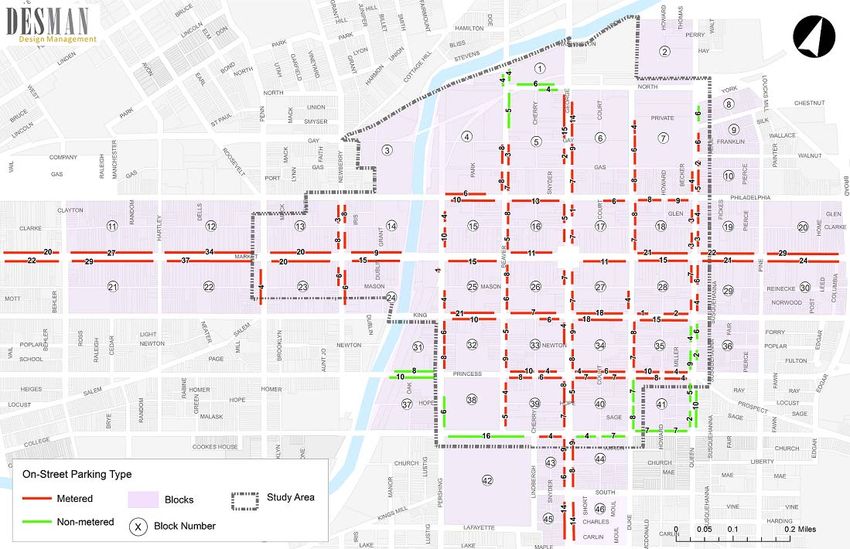
City of York
                                                                                                  Parking System Strategic Plan

                                        TABLE OF CONTENTS continued
                                                                                                                                 Page

PARKING SYSTEM STRATEGIC PLAN RECOMMENDATIONS ....................................................... 51
  Recommended Parking Meter System Policy, Program & Rates Changes ................................ 51
  Recommended Parking Enforcement Program Enhancement .................................................. 56
  Recommended Operational Enhancements for the Parking Garages....................................... 57
  Recommended Organizational Improvements for the General Authority ............................... 68

PARKING SYSTEM STRATEGIC PLAN BUDGET ESTIMATES .......................................................... 70
  Parking Meter System Project Budgets ..................................................................................... 70
  Parking Garage Project Budget .................................................................................................. 71

PARKING SYSTEM STRATEGIC PLAN IMPLEMENTATION PHASING ............................................ 74
  Phase I (Year 1 Action Plan) ....................................................................................................... 75
  Phase II (Year 2 Action Plan) ...................................................................................................... 76
  Phase III (Year 3 Action Plan) ..................................................................................................... 76

APPENDIX
City of York
                                                                              Parking System Strategic Plan

Introduction & Background
DESMAN was retained by the City of York (City) and the City of York General Authority (GA) to conduct a
comprehensive analysis of the City’s Parking System and formulate a PARKING SYSTEM STRATEGIC PLAN
(the PSSP) for the economic benefit of the municipality. In 1995, the GA acquired certain assets
constituting the City of York Parking System and is currently responsible for the management, operations
and maintenance of the assets. This Parking System is comprised of 3 high‐rise parking garages in the
downtown business district, 16 surface parking lots throughout the City and over 600 parking meters in
the core business district and surrounding commercial and neighborhood districts. Recently, the GA
launched a 30‐day pilot program intended to maximize the capabilities of the technology within the
parking system and discovered a need for a comprehensive plan to guide its decision‐making regarding
the long‐term operations and management of the system. The City’s desire was for the PS S P to:
document existing and future parking market conditions, review the physical conditions of the assets,
evaluate the operational effectiveness of the System, and identify ways and means to enhance the
financial performance and level of service the System provides to the City and its constituencies.

At the outset of this undertaking, the DESMAN project team conducted interviews with key City officials
and a host of local stakeholders representing other government entities, public‐sector institutions, a wide
range of business enterprises, entertainment/visitor attractions, and real estate developers and investors.
The purpose of these stakeholder interviews was two‐fold: first, they were used as a source of information
about the goals and objectives of the study undertaking and, secondly, they provided firsthand knowledge
of how various factions from the community view the present accommodations and operating
circumstances of the public parking system.

DESMAN also collected and reviewed an extensive amount of data and information relating to the City’s
Parking System and to the downtown area in general. The next steps in our study process involved
verification of the existing inventory of public parking, a survey of the typical utilization of the parking
supply and an investigation of how the System is currently being operated and managed.

The results of DESMAN’s analysis were consolidated and used as the basis for the recommendations
contained within the PSSP. It is DESMAN’s intent that this document can be used as a roadmap for the
City as it seeks to improve its Parking System, provide a higher level of service to its residents, employees
and visitors, and put the System on firm financial ground.

Study Area
The study area, which was defined by the City, is congruent with the Business Improvement District (BID)
boundary. The study area depicted on Exhibit 1 generally encompasses the City blocks bounded by the
Codorus Creek to the north, Queen Street to the east, College Street to the south, and both Pershing
Street and Penn Street to the west. DESMAN assigned a number to each city block within this study area.
These same block numbers are included on most of the subsequent maps and tables in the PSSP to provide

                                                                                                      Page 1
City of York
                                Parking System Strategic Plan

Exhibit 1 Study Area Boundary

DESMAN

                                                        Page 2
City of York
Parking System Strategic Plan
the reader with geographical context when describing variances in the supply and usage of the public
parking system.
Parking Supply/Demand and Demographic Study
On‐Street Spaces
Exhibit 2 depicts the locations and counts of the metered and non‐metered on‐street parking spaces by
city block face within the downtown study area boundary. Within the Central Business District (CBD) study
area boundary there are 792 on‐street parking spaces, comprised of 679 metered spaces and 113 non‐
metered spaces.
The same exhibit also shows the locations of most of the metered and non‐metered on‐street parking
spaces outside the CBD study area boundary. These spaces are located along segments of Market Street,
George Street, College Street, and Queen Street, which are beyond the CBD study area boundary. The City
requested that DESMAN examine whether or not the continued use of parking meters is the most effective
way to control and regulate parking activity in areas outside the CBD.
The count of on‐street parking spaces along each of these street segments are listed below:
245 Meters on West Market Street, from Penn Street to Carisle Avenue (not shown)
96 Meters on East Market, from Queen Street to Broad Street
57 Meters on South George Street, from College Avenue to Maple Street
17 Non‐Meter Spaces on Queen Street, from Princess Street to College Street
14 Non‐Meter Spaces on College Street, from Duke Street to Queen Street
Table 1 On‐Street Parking Supply Summary
On‐Street Parking Supply
679 Metered Spaces
113 Non‐Metered Spaces
792 On‐Street Spaces within CBD Study Area
426 Metered Spaces
31 Non‐Metered Spaces
457 On‐Street Spaces outside CBD Study Area
1,249 TOTAL ON‐STREET SUPPLY SUBJECT TO ANALYSIS
Page 3
City of York
                                                                                                                        Parking System Strategic Plan

                                               th
The North2 Metro
 Exhibit         Rail of
           Inventory  Line and Eastlake
                         On‐Street      at 124
                                   Parking  SpacesStation (Eastlake
                                                     by City Block inStation) will open
                                                                       Downtown     Yorkin
                                                                                         PA2018. The Eastlake Station is expected to be the end of the

 DESMAN

                                                                                                                                               Page 4
City of York
                                                                                 Parking System Strategic Plan

Off‐Street Parking Facilities
Exhibit 3 depicts the locations of all the City‐controlled off‐street parking facilities located within and in
close proximity to the CBD study area. The list includes 14 lots and 3 garages which are managed by the
City of York’s General Authority (GA) and one garage and 3 lots which are owned by the City of York’s
Redevelopment Authority (RDA). The collection of off‐street facilities controlled by the GA, along with
Lots 12, 18 and 20 owned by the RDA, constitute the public parking system of the City of York. Though
the RDA owns parking garage located at the Susquehanna Commerce Center, the garage leased to a
condominium association that which manages the commercial complex.

It is significant to note that the GA and the RDA own several off‐street parking facilities which are not
shown on Exhibit 3 (denoted in the table with an *). These other parking facilities have been omitted from
the facility location map because they are located well beyond the CBD parking study area.

Table 2 Off‐Street Parking Supply Summary
                         Off‐Street Parking Supply
                        Lot ‐ 1 100 Block of E. Gas Ave.                          44
                        Lot ‐ 2 300 W. King St.                                   81
                        Lot ‐ 3 143 S. Duke St.                                   64
                        Lot ‐ 4 Howard & Newton                                   32
                        Lot ‐ 7 600 W. Mason Ave.                                 39
                        Lot ‐ 8 Lafayette Plaza                                   75
                        Lot ‐ 9 200 Block between E. King/ E. Princess           128
                        Lot ‐ 11 100 Block E. Princess                           110
                        Lot ‐ 13 Kings Mill & Manor *                             21
                        Lot ‐ 14 St. Paul & Penn*                                 95
                        Lot ‐ 15 300 W. Princess *                                10
                        Lot ‐ 17 200 W. Mason Ave                                 68
                        City Hall West Lot (CHW)                                  75
                        City Hall East Lot (CHE)                                  60
                        Market Garage (MG)                                       438
                        Philadelphia Garage (PG)                                 281
                        King Garage (KG)                                         541
                        Subtotal GA‐Operated Off‐Street Parking Supply          2,162
                        RDA Garage ‐ Susquahenna Center                          314
                        RDA Lot ‐ 12 700 E. Mason *                               50
                        RDA Lot ‐ 18 Northwest Triangle N. Beaver                 74
                        RDA Lot ‐ 20 376 W. Philadelphia                          13
                        Subtotal RDA‐Owned Off‐Street Parking Supply             451
                         Total City‐Owned Off‐Street Parking Supply             2,613
                        * Denotes park ing facilties not shown on Exhibit 3 .

                                                                                                       Page 5
City of York
Parking System Strategic Plan
Exhibit 3 Inventory of Off‐ Street Parking in Downtown York. PA
DESMAN
Page 6City of York
Parking System Strategic Plan
Exhibit 4 depicts the locations of the downtown parking facilities that are accessible by the general public.
Aside from the GA and RDA parking facilities, the exhibit shows the off‐street facilities that are privately‐
operated, used by institutions (i.e. schools, churches, non‐profits, etc.) and those that are exclusively used
by York County employees and visitors.
The following is a list of the privately‐operated and licensed parking facilities, including two of the RDA
facilities (#11 and #12 in the list), that offer daily or monthly parking to the public. Collectively, these 19
privately operated facilities account for nearly 30% of all off‐street parking spaces accessible to the
general public in the CBD. These off‐street facilities were not included in the parking occupancy survey
conducted by DESMAN.
Table 3 Off‐Street Parking Facilities Licensed by the City in 2016
2016 City Licensed Pay Parking Facilities in the CBD
1 135 North George Street 16
2 34 North Beaver Street 20
3 223 N. George Street ‐ Elks Lodge 213 36
4 135 N. Beaver Street 131
5 34 W. Philadelphia Street 101
6 135 S. Duke Street 24
7 140 W. Market Street 22
8 132 N. George Street ‐ Rodeway Inn 15
9 130 North Duke Street 100
10 40 N. Queen Street 11
11 376 W. Philadelphia Street ‐ RDA Lot 20 13
12 200 Block N. Beaver Street ‐ RDA Lot 18 74
13 Central Market Street Garage (Lower Level) 90
14 221 West Philadelphia Street ‐ Susquehanna Ctr. 318
15 East King St. and South Queen St. 134
16 Beaver St. ‐ York Co. Human Svcs Ctr Lot 158
17 Parklane Plaza ‐ York Co. Leased Portion of GA Lot 9 156
18 Thomas Somerville Lot ‐ York Revolution 50
19 221 North Duke St 25
None‐City Operated Public Parking Supply 1494
Page 7City of York
Parking System Strategic Plan
Exhibit 4 Inventory of Off‐Street Parking in Downtown York, PA
DESMAN
Page 8City of York
Parking System Strategic Plan
Parking Utilization Survey Findings
On‐ and Off‐Street Parking Utilization
DESMAN surveyed the prevailing utilization of selected on‐street parking spaces and public off‐street
parking facilities within and abutting the Central Business District study area boundary on two different
days. The surveys were conducted on Thursday, March 31, 2016, between the hours of 9:00am and
5:00pm and on Friday, April 1, 2016, between the hours of 10:00am and 7:00pm. During these
timeframes, the survey team documented the hour‐to‐hour occupancy of all on‐street spaces and in all
public parking lots and garages. The occupancy of the privately controlled RDA garage and the Central
Market Garage was documented along with all of the GA’s parking lots and garages.
The series of data tables and exhibits on the following pages reveal that there does not appear to be a
parking supply deficit in the downtown area. The following are the highlights of the parking survey:
1. Overall on‐street parking space occupancy in the CBD never exceeded 57%
2. Overall off‐street parking space occupancy in the lots and garage never exceeded 45%
3. On‐ and off‐street parking occupancy generally peaked between the hours 12:00pm and 2:00pm
4. Occupancy at the King Garage peaked at approximately 57%
5. Occupancy at the Market Garage peaked at approximately 29%
6. Occupancy at the Philadelphia Garage peaked at approximately 49%
7. The highest and most consistent utilization of on‐street parking spaces was observed in the
following areas:
Market Street between Beaver and Duke
George Street between Gas and King
Philadelphia Street between Pershing and George
Page 9City of York
Parking System Strategic Plan
Exhibit 5 Summary of Hourly On‐Street Parking Utilization in Downtown York, PA
Exhibit 6 Summary of Hourly Off‐Street Parking Utilization in Downtown York, PA
Page 10City of York
Parking System Strategic Plan
Exhibit 7 Occupancy of On‐ Street Parking Spaces at Peak Hour on Thursday, March 31, 2016 (12:00pm)
DESMAN
Page 11City of York
Parking System Strategic Plan
Exhibit 8 Occupancy of On‐ Street Parking Spaces at Peak Hour on Friday, April 1, 2016 (1:00 pm)
DESMAN
Page 12City of York
Parking System Strategic Plan
Table 4 On‐Street Parking Space Occupancy by Street on Thursday, March 31, 2016
SIDE OF All Mech. Smart Non‐
STREET NAME FROM TO 9 AM 10 AM 11 AM 12 PM 2 PM 3 PM 4 PM 5 PM
STREET Spaces Type Type Meter
Beaver E North College 89 40 26 23 65% 66% 72% 81% 72% 64% 64% 54%
College S Pershing George 20 0 0 20 95% 90% 95% 90% 85% 85% 55% 50%
Duke E North College 67 52 0 15 45% 46% 43% 48% 48% 42% 48% 12%
George W North College 124 22 102 0 48% 48% 48% 60% 48% 39% 34% 25%
King N River Queen 98 98 0 0 47% 40% 32% 46% 42% 41% 35% 17%
Market N Penn Queen 137 64 73 0 42% 39% 37% 63% 61% 49% 42% 20%
Newberry W Philadelphia King 30 30 0 0 23% 37% 30% 43% 53% 23% 27% 30%
North N Beaver George 10 0 0 10 60% 60% 70% 70% 80% 90% 30% 30%
Pershing E Gay College 41 35 0 6 39% 44% 34% 44% 56% 63% 68% 68%
Philadelphia N River Queen 52 39 13 0 54% 60% 71% 79% 56% 40% 42% 48%
Princess N Beaver Cherry 92 52 0 40 33% 36% 38% 35% 28% 27% 26% 10%
Queen N North Princess 76 49 0 27 55% 59% 57% 46% 37% 37% 53% 36%
TOTALS 836 481 214 141 43% 48% 48% 57% 51% 45% 43% 29%
Table 5 On‐Street Parking Space Occupancy by Street on Friday, April 1, 2016
SIDE OF All Mech. Smart Non‐
STREET NAME FROM TO 10 AM 11 AM 12 PM 1 PM 2 PM 4 PM 5 PM 6 PM 7 PM
STREET Spaces Type Type Meter
Beaver E North College 89 40 26 23 58% 47% 61% 58% 55% 58% 58% 53% 55%
College S Pershing George 20 0 0 20 80% 70% 85% 75% 65% 65% 35% 20% 20%
Duke E North College 67 52 0 15 45% 57% 49% 55% 43% 39% 27% 43% 36%
George W North College 124 22 102 0 45% 48% 58% 62% 52% 47% 59% 34% 27%
King N River Queen 98 98 0 0 38% 41% 47% 37% 45% 38% 38% 36% 39%
Market N Penn Queen 137 64 73 0 42% 45% 48% 58% 53% 47% 50% 61% 53%
Newberry W Philadelphia King 30 30 0 0 37% 17% 20% 27% 20% 10% 13% 37% 37%
North N Beaver George 10 0 0 10 60% 60% 60% 60% 80% 40% 40% 0% 0%
Pershing E Gay College 41 35 0 6 49% 54% 54% 41% 27% 44% 78% 73% 73%
Philadelphia N River Queen 52 39 13 0 40% 48% 56% 73% 60% 67% 85% 37% 37%
Princess N Beaver Cherry 92 52 0 40 34% 36% 36% 30% 43% 36% 25% 20% 11%
Queen N North Princess 76 49 0 27 59% 0% 0% 0% 43% 41% 39% 51% 36%
TOTALS 836 481 214 141 39% 34% 38% 38% 39% 37% 39% 33% 29%
0% to 60 81% to 90%
61% to 80% 91% to 100%
Page 13City of York
Parking System Strategic Plan
Exhibit 9 Peak Hour Occupancy of Off‐Street Parking Facilities on Thursday, March 31, 2016 (2:00 pm)
DESMAN
Page 14City of York
Parking System Strategic Plan
Exhibit 10 Peak Hour Occupancy of Off‐Street Parking Facilities on Friday, April 1, 2016 (5:00 pm)
DESMAN
Page 15City of York
Parking System Strategic Plan
Table 6 Hourly Occupancy at Selected Off‐Street Parking Facilities on Thursday, March 31, 2016
Space Block
OFF‐STREET LOTS / GARAGES 9 AM 10 AM 11 AM 12 PM 1 PM 2 PM 3 PM 4 PM 5 PM
Count #
CITY HALL WEST 75 34 24 45 45 40 34 36 36 25
CITY HALL EAST 60 34 38 41 47 41 38 36 38 33
Subtotal City Hall Lot Occupancy 135 62 86 92 81 72 72 74 58
% Occupied 46% 64% 68% 60% 53% 53% 55% 43%
LOT 2 81 23 13 25 21 16 21 27 24 8
LOT 3 64 35 4 3 3 3 4 3 4 2
LOT 4 32 35 0 0 0 0 0 0 1 1
LOT 8 75 14 9 16 13 12 18 18 14 11
LOT 9 128 32 66 62 64 63 62 48 31 24
LOT 11 110 41 13 12 10 10 14 9 11 9
LOT 17 68 24 18 19 18 20 19 17 16 6
LOT 20 13 13 3 2 3 3 3 2 3 2
Subtotal GA Lot Occupancy 571 126 139 132 127 141 124 104 63
% Occupied 22% 24% 23% 22% 25% 22% 18% 11%
MARKET GARAGE 438 17 134 123 130 130 114 68 70 84
PHILADELPHIA GARAGE 281 5 76 117 123 120 139 135 121 84
KING GARAGE 541 26 284 299 288 282 310 257 186 98
Subtotal GA Garage Occupancy 1260 494 539 541 532 563 460 377 266
% Occupied 39% 43% 43% 42% 45% 37% 30% 21%
RDA GARAGE 314 3 213 237 242 240 264 283 202 111
Central Mkt Garage Lower Level 90 4 53 81 86 85 70 39 38 30
Central Mkt Garage Upper Level 72 4 2 5 11 24 6 2 2 0
Subtotal Private Garage Occupancy 476 268 323 339 349 340 324 242 141
% Occupied 56% 68% 71% 73% 71% 68% 51% 30%
Exhibit 11 GA Parking Garage Occupancy on Thursday, March 31, 2016
Downtown Parking Garage Occupancy
Thursday, March 31, 2016
350
300
250
200
150
100
50
0
9 AM 10 AM 11 AM 12 PM 2 PM 3 PM 4 PM 5 PM
MARKET GARAGE 438 PHILADELPHIA GARAGE 281 KING GARAGE 541
Page 16City of York
Parking System Strategic Plan
Table 7 Hourly Occupancy at Selected Off‐Street Parking Facilities on Friday, April 1, 2016
Space Block
OFF‐STREET LOTS / GARAGES 10 AM 11 AM 12 PM 1 PM 2 PM 3 PM 4 PM 5 PM 6 PM 7 PM
Count #
CITY HALL WEST 75 34 37 47 48 36 36 27 14 15 33
CITY HALL EAST 60 34 52 45 31 34 36 29 22 17 18
Subtotal City Hall Lot Occupancy 135 89 92 79 70 72 56 36 32 51
% Occupied 66% 68% 59% 52% 53% 41% 27% 24% 38%
LOT 2 81 23 23 19 29 25 25 12 9 6 5
LOT 3 64 35 4 4 3 3 3 3 23 0 2
LOT 4 32 35 1 2 1 1 1 2 1 0 2
LOT 8 75 14 8 11 12 11 11 11 59 75 73
LOT 9 128 32 61 62 58 56 56 42 15 13 14
LOT 11 110 41 7 12 8 11 11 12 10 16 16
LOT 17 68 24 22 22 18 16 16 11 3 5 3
LOT 20 13 13 3 3 4 4 4 2 1 3 2
Subtotal GA Lot Occupancy 571 129 135 133 127 127 95 121 118 117
% Occupied 23% 24% 23% 22% 22% 17% 21% 21% 20%
MARKET GARAGE 438 17 138 134 123 130 130 110 64 62 84
PHILADELPHIA GARAGE 281 5 110 103 105 115 142 130 189 281 267
KING GARAGE 541 26 304 294 282 278 274 236 144 115 115
Subtotal GA Garage Occupancy 1260 552 531 510 523 546 476 397 458 466
% Occupied 44% 42% 40% 42% 43% 38% 32% 36% 37%
RDA GARAGE 314 3 227 217 226 235 236 121 219 91 73
Central Mkt Garage Lower Level 90 4 48 51 60 56 55 85 90 94 95
Central Mkt Garage Upper Level 72 4 1 4 5 4 5 22 72 72 72
Subtotal Private Garage Occupancy 476 276 272 291 295 296 228 381 257 240
% Occupied 58% 57% 61% 62% 62% 48% 80% 54% 50%
Exhibit 12 GA Parking Garage Occupancy on Friday, April 1, 2016
Downtown Parking Garage Occupancy
Friday, April 1, 2016
350
300
250
200
150
100
50
0
10 AM 11 AM 12 PM 1 PM 3 PM 4 PM 5 PM 6 PM 7 PM
MARKET GARAGE 438 PHILADELPHIA GARAGE 281 KING GARAGE 541
Page 17City of York
Parking System Strategic Plan
On‐Street Parking Space Turnover & Duration of Stay
DESMAN’s survey team also documented the turnover of parking spaces and duration of stay for parkers
at all metered and non‐metered spaces on‐street within the CBD area. This was accomplished by recording
the license plates of each vehicle found parked at each on‐street space every hour. This documentation
allowed the team to determine how long each vehicle remained parked at each space and how many
different vehicles parked at each space throughout the day‐long survey period. Since the current parking
regulations throughout the downtown area restrict on‐street parking to a limit of two hours, theoretically,
no vehicle should have occupied any on‐street parking space for more than two hours. The degree to
which on‐street parking spaces turnover during a typical weekday is a reflection of the scope of the
prevailing short‐term parking demand.
This type of survey normally can provide an indication of whether or not the two‐hour parking time limit
regulation is or is not being adhered to by on‐street parkers. However, because the City has issued 189
all‐day, on‐street parking permits to downtown residents, many of the parkers found to be parking longer
than two hours were do so legally, rather than violating the time limit restriction. Nevertheless, the team
was able to document both the day‐long count of different vehicles occupying on‐street spaces and the
count of total vehicles, by block, that parked for 1, 2, 3, etc. hours in the same on‐street space.
Exhibits 13 and 14 depict the total volume of different vehicles that parked in each city block during the
two survey days. By dividing the total count of vehicles parked by the count of on‐street parking spaces
on each block, the space turnover ratio for each block was determined. The on‐street space turnover on
most blocks was below three turns, meaning that, on average, fewer than three different vehicles parked
in each space throughout the course of the survey period. The on‐street space turnover and total vehicle
count volumes were highest in the blocks bounded by Philadelphia, King, Beaver, and Duke Street, which
happens to be where the three GA parking garages are located.
Page 18City of York
Parking System Strategic Plan
Exhibit 13 Parking Supply Turnover by City Block on Thursday, March 31, 2016
DESMAN
Page 19City of York
Parking System Strategic Plan
Exhibit 14 Parking Supply Turnover by City Block on Friday, April 1, 2016
DESMAN
Page 20City of York
Parking System Strategic Plan
Tables 8 and 9 provide a block‐by‐block tabulation of the on‐street parking space occupancy, duration of
stay and space turnover.
On Thursday, March 31st a total of 1,882 different vehicles parked on‐street in the CBD study area. Of the
total, 69% (1,304 vehicles) parked for one hour, 17% (315 vehicles) parked for two hours, and 14% (263
vehicles) parked for more than two hours in the same space.
On Friday, April 1st a total of 1,665 different vehicles parked on‐street in the CBD study area. Of the total,
61% (1,011 vehicles) parked for one hour, 28% (458 vehicles) parked for two hours, and 12% (196
vehicles) parked for more than two hours in the same space.
Page 21City of York
Parking System Strategic Plan
Table 8 Occupancy & Vehicle Duration of Stay at On‐Street Spaces on Thursday, March 31, 2016
Hour‐to‐Hour On‐Street Space Occupancy Parked Vehicle's Duration of Stay
Total Turnover
Block Space Veh. Ratio
9 AM 10 AM 11 AM 12 PM 2 PM 3 PM 4 PM 5 PM 1 Hr 2 Hrs 3 Hrs 4 Hrs 5 Hrs 6 Hrs 7 Hrs 8 Hrs 9 Hrs
# Count
1 10 9 9 9 9 10 10 5 4 2 0 0 0 0 0 6 3 2 13 1.3
90% 90% 90% 90% 100% 100% 50% 40% 15% 0% 0% 0% 0% 0% 46% 23% 15%
4 26 11 12 20 25 14 14 10 9 53 7 1 4 1 2 0 2 0 70 2.7
42% 46% 77% 96% 54% 54% 38% 35% 76% 10% 1% 6% 1% 3% 0% 3% 0%
5 36 15 17 22 21 17 17 8 20 56 6 8 4 1 0 0 3 0 78 2.2
42% 47% 61% 58% 47% 47% 22% 56% 72% 8% 10% 5% 1% 0% 0% 4% 0%
6 30 19 14 13 18 13 9 7 11 67 11 8 0 0 0 1 0 0 87 2.9
63% 47% 43% 60% 43% 30% 23% 37% 77% 13% 9% 0% 0% 0% 1% 0% 0%
7 18 2 6 4 10 4 5 1 5 37 0 1 1 0 0 0 0 0 39 2.2
11% 33% 22% 56% 22% 28% 6% 28% 95% 0% 3% 3% 0% 0% 0% 0% 0%
13 34 20 14 9 16 13 7 18 9 51 21 4 3 1 0 0 0 0 80 2.4
59% 41% 26% 47% 38% 21% 53% 26% 64% 26% 5% 4% 1% 0% 0% 0% 0%
14 19 0 6 1 9 5 2 2 3 28 0 0 0 0 0 0 0 0 28 1.5
0% 32% 5% 47% 26% 11% 11% 16% 100% 0% 0% 0% 0% 0% 0% 0% 0%
15 26 8 16 11 12 8 13 14 15 32 16 6 2 1 0 0 2 0 59 2.3
31% 62% 42% 46% 31% 50% 54% 58% 54% 27% 10% 3% 2% 0% 0% 3% 0%
16 46 29 38 15 40 42 28 32 14 146 29 3 3 3 0 2 1 0 187 4.1
63% 83% 33% 87% 91% 61% 70% 30% 78% 16% 2% 2% 2% 0% 1% 1% 0%
17 7 7 4 0 5 7 3 4 0 29 0 1 1 0 0 0 0 0 31 4.4
100% 57% 0% 71% 100% 43% 57% 0% 94% 0% 3% 3% 0% 0% 0% 0% 0%
18 53 26 12 32 35 34 26 30 10 120 15 4 5 2 0 0 2 0 148 2.8
49% 23% 60% 66% 64% 49% 57% 19% 81% 10% 3% 3% 1% 0% 0% 1% 0%
23 26 5 3 3 3 12 7 5 8 38 6 2 0 0 0 0 0 0 46 1.8
19% 12% 12% 12% 46% 27% 19% 31% 83% 13% 4% 0% 0% 0% 0% 0% 0%
24 22 0 14 13 14 11 9 7 15 44 21 0 0 0 0 0 0 0 65 3.0
0% 64% 59% 64% 50% 41% 32% 68% 68% 32% 0% 0% 0% 0% 0% 0% 0%
25 40 23 23 4 24 29 29 29 12 99 20 7 4 5 0 0 0 0 135 3.4
58% 58% 10% 60% 73% 73% 73% 30% 73% 15% 5% 3% 4% 0% 0% 0% 0%
26 28 14 11 19 21 23 25 21 19 71 25 8 2 4 0 0 0 0 110 3.9
50% 39% 68% 75% 82% 89% 75% 68% 65% 23% 7% 2% 4% 0% 0% 0% 0%
27 46 32 22 31 34 27 23 4 5 119 9 14 2 2 0 0 0 0 146 3.2
70% 48% 67% 74% 59% 50% 9% 11% 82% 6% 10% 1% 1% 0% 0% 0% 0%
28 18 10 5 15 15 15 9 10 0 39 5 0 1 1 0 1 2 0 49 2.7
56% 28% 83% 83% 83% 50% 56% 0% 80% 10% 0% 2% 2% 0% 2% 4% 0%
31 8 7 8 7 7 5 6 3 6 8 2 3 2 1 0 2 1 0 19 2.4
88% 100% 88% 88% 63% 75% 38% 75% 42% 11% 16% 11% 5% 0% 11% 5% 0%
32 24 9 7 8 8 12 14 16 11 35 14 9 4 0 0 0 0 0 62 2.6
38% 29% 33% 33% 50% 58% 67% 46% 56% 23% 15% 6% 0% 0% 0% 0% 0%
33 38 16 13 20 19 12 9 12 14 44 20 3 2 2 2 1 0 0 74 1.9
42% 34% 53% 50% 32% 24% 32% 37% 59% 27% 4% 3% 3% 3% 1% 0% 0%
34 45 15 22 16 20 14 12 9 3 58 16 1 2 1 0 4 0 0 82 1.8
33% 49% 36% 44% 31% 27% 20% 7% 71% 20% 1% 2% 1% 0% 5% 0% 0%
35 44 18 17 17 12 12 10 20 0 36 15 0 1 2 1 5 0 0 60 1.4
41% 39% 39% 27% 27% 23% 45% 0% 60% 25% 0% 2% 3% 2% 8% 0% 0%
37 10 8 7 9 8 6 5 6 2 8 5 2 0 0 0 1 4 0 20 2.0
80% 70% 90% 80% 60% 50% 60% 20% 40% 25% 10% 0% 0% 0% 5% 20% 0%
38 6 6 6 6 6 6 6 4 6 3 2 1 0 1 0 0 4 0 11 1.8
100% 100% 100% 100% 100% 100% 67% 100% 27% 18% 9% 0% 9% 0% 0% 36% 0%
39 38 11 13 11 11 14 11 13 5 20 8 2 2 2 0 4 3 0 41 1.1
29% 34% 29% 29% 37% 29% 34% 13% 49% 20% 5% 5% 5% 0% 10% 7% 0%
40 19 6 5 8 6 5 4 7 0 15 9 0 1 1 0 1 0 0 27 1.4
32% 26% 42% 32% 26% 21% 37% 0% 56% 33% 0% 4% 4% 0% 4% 0% 0%
41 23 13 17 14 12 12 15 10 0 18 18 1 3 4 0 5 0 0 49 2.1
57% 74% 61% 52% 52% 65% 43% 0% 37% 37% 2% 6% 8% 0% 10% 0% 0%
42 16 16 16 16 16 15 15 9 8 3 7 1 0 2 0 0 14 0 27 1.7
100% 100% 100% 100% 94% 94% 56% 50% 11% 26% 4% 0% 7% 0% 0% 52% 0%
43 19 7 7 11 7 4 7 12 2 20 4 0 0 2 0 2 2 0 30 1.6
37% 37% 58% 37% 21% 37% 63% 11% 67% 13% 0% 0% 7% 0% 7% 7% 0%
44 17 0 0 3 3 0 2 4 0 5 4 0 0 0 0 0 0 0 9 0.5
0% 0% 18% 18% 0% 12% 24% 0% 56% 44% 0% 0% 0% 0% 0% 0% 0%
792 362 364 367 446 401 352 332 216 1304 315 90 49 39 5 35 43 2 1882 2.4
46% 46% 46% 56% 51% 44% 42% 27% 69% 17% 5% 3% 2% 0% 2% 2% 0%
Page 22City of York
Parking System Strategic Plan
Table 9 Occupancy & Vehicle Duration of Stay at On‐Street Spaces on Friday, April 1, 2016
Hour‐to‐Hour On‐Street Space Occupancy Parked Vehicle's Duration of Stay Total Turnover
Block Space Veh. Ratio
10 AM 11 AM 12 PM 1 PM 2 PM 4 PM 5 PM 6 PM 7 PM 1 Hr 2 Hrs 3 Hrs 4 Hrs 5 Hrs 6 Hrs 7 Hrs 8 Hrs 9 Hrs
# Count
1 10 9 7 7 7 7 6 4 0 0 5 1 0 0 0 3 2 2 0 13 1.3
90% 70% 70% 70% 70% 60% 40% 0% 0% 38% 8% 0% 0% 0% 23% 15% 15% 0%
4 26 15 12 16 19 14 15 22 18 18 24 22 2 0 0 2 1 4 0 55 2.1
58% 46% 62% 73% 54% 58% 85% 69% 69% 44% 40% 4% 0% 0% 4% 2% 7% 0%
5 36 13 15 19 18 17 16 23 0 0 18 19 4 0 0 1 1 6 0 49 1.4
36% 42% 53% 50% 47% 44% 64% 0% 0% 37% 39% 8% 0% 0% 2% 2% 12% 0%
6 30 12 16 21 21 16 10 20 0 0 37 26 2 1 0 3 1 1 0 71 2.4
40% 53% 70% 70% 53% 33% 67% 0% 0% 52% 37% 3% 1% 0% 4% 1% 1% 0%
7 18 10 10 11 11 7 6 1 0 0 5 27 0 2 0 0 0 0 0 34 1.9
56% 56% 61% 61% 39% 33% 6% 0% 0% 15% 79% 0% 6% 0% 0% 0% 0% 0%
13 34 12 14 21 21 11 9 18 17 10 25 28 1 4 1 0 0 0 1 60 1.8
35% 41% 62% 62% 32% 26% 53% 50% 29% 42% 47% 2% 7% 2% 0% 0% 0% 2%
14 19 0 0 0 0 0 2 0 0 0 2 0 0 0 0 0 0 0 0 2 0.1
0% 0% 0% 0% 0% 11% 0% 0% 0% 100% 0% 0% 0% 0% 0% 0% 0% 0%
15 26 11 11 14 14 10 11 24 15 15 36 15 7 1 1 1 1 0 0 62 2.4
42% 42% 54% 54% 38% 42% 92% 58% 58% 58% 24% 11% 2% 2% 2% 2% 0% 0%
16 46 40 41 35 39 35 39 36 45 44 132 49 6 4 7 0 1 1 0 200 4.3
87% 89% 76% 85% 76% 85% 78% 98% 96% 66% 25% 3% 2% 4% 0% 1% 1% 0%
17 7 6 6 4 7 6 7 4 7 6 13 6 2 0 2 0 0 0 0 23 3.3
86% 86% 57% 100% 86% 100% 57% 100% 86% 57% 26% 9% 0% 9% 0% 0% 0% 0%
18 53 4 27 24 30 32 35 27 15 12 130 17 4 1 2 1 2 0 0 157 3.0
8% 51% 45% 57% 60% 66% 51% 28% 23% 83% 11% 3% 1% 1% 1% 1% 0% 0%
23 26 6 2 5 9 8 2 9 21 20 23 10 0 0 0 0 0 0 0 33 1.3
23% 8% 19% 35% 31% 8% 35% 81% 77% 70% 30% 0% 0% 0% 0% 0% 0% 0%
24 22 7 5 7 9 6 6 6 18 17 28 9 1 0 0 0 0 0 0 38 1.7
32% 23% 32% 41% 27% 27% 27% 82% 77% 74% 24% 3% 0% 0% 0% 0% 0% 0%
25 40 20 16 16 17 21 14 21 27 27 80 17 0 0 1 0 0 1 0 99 2.5
50% 40% 40% 43% 53% 35% 53% 68% 68% 81% 17% 0% 0% 1% 0% 0% 1% 0%
26 28 13 11 20 15 18 18 20 20 27 44 23 2 0 1 2 1 0 0 73 2.6
46% 39% 71% 54% 64% 64% 71% 71% 96% 60% 32% 3% 0% 1% 3% 1% 0% 0%
27 46 31 25 32 38 36 31 24 24 22 106 55 1 2 1 1 1 1 0 168 3.7
67% 54% 70% 83% 78% 67% 52% 52% 48% 63% 33% 1% 1% 1% 1% 1% 1% 0%
28 18 12 13 12 11 11 11 7 0 0 41 17 3 1 1 0 0 0 0 63 3.5
67% 72% 67% 61% 61% 61% 39% 0% 0% 65% 27% 5% 2% 2% 0% 0% 0% 0%
31 8 7 7 5 3 5 7 4 4 2 10 5 1 0 0 1 2 0 0 19 2.4
88% 88% 63% 38% 63% 88% 50% 50% 25% 53% 26% 5% 0% 0% 5% 11% 0% 0%
32 24 15 15 14 11 5 17 19 21 18 21 29 3 1 1 0 0 0 0 55 2.3
63% 63% 58% 46% 21% 71% 79% 88% 75% 38% 53% 5% 2% 2% 0% 0% 0% 0%
33 38 6 3 10 9 14 5 8 15 15 31 9 0 0 2 0 0 0 0 42 1.1
16% 8% 26% 24% 37% 13% 21% 39% 39% 74% 21% 0% 0% 5% 0% 0% 0% 0%
34 45 14 12 17 18 21 17 13 9 7 62 22 2 3 0 1 0 0 0 90 2.0
31% 27% 38% 40% 47% 38% 29% 20% 16% 69% 24% 2% 3% 0% 1% 0% 0% 0%
35 44 17 21 12 14 16 14 14 12 13 50 22 4 3 0 0 0 1 0 80 1.8
39% 48% 27% 32% 36% 32% 32% 27% 30% 63% 28% 5% 4% 0% 0% 0% 1% 0%
37 10 7 5 8 7 8 8 3 2 2 8 0 2 0 1 0 5 0 0 16 1.6
70% 50% 80% 70% 80% 80% 30% 20% 20% 50% 0% 13% 0% 6% 0% 31% 0% 0%
38 6 6 6 6 5 4 2 3 2 2 13 1 4 0 0 0 1 0 0 19 3.2
100% 100% 100% 83% 67% 33% 50% 33% 33% 68% 5% 21% 0% 0% 0% 5% 0% 0%
39 38 9 12 10 7 6 9 6 4 2 10 6 4 0 3 0 1 0 0 24 0.6
24% 32% 26% 18% 16% 24% 16% 11% 5% 42% 25% 17% 0% 13% 0% 4% 0% 0%
40 19 3 4 9 6 8 3 10 10 6 17 1 3 1 0 0 2 0 0 24 1.3
16% 21% 47% 32% 42% 16% 53% 53% 32% 71% 4% 13% 4% 0% 0% 8% 0% 0%
41 23 17 16 12 13 14 11 9 9 3 15 11 3 3 5 0 1 2 0 40 1.7
74% 70% 52% 57% 61% 48% 39% 39% 13% 38% 28% 8% 8% 13% 0% 3% 5% 0%
42 16 14 12 14 12 10 10 4 1 1 6 7 6 3 3 0 1 2 0 28 1.8
88% 75% 88% 75% 63% 63% 25% 6% 6% 21% 25% 21% 11% 11% 0% 4% 7% 0%
43 19 7 9 10 8 5 6 8 6 4 8 0 0 0 1 2 2 0 0 13 0.7
37% 47% 53% 42% 26% 32% 42% 32% 21% 62% 0% 0% 0% 8% 15% 15% 0% 0%
44 17 3 6 2 1 4 0 3 4 1 11 4 0 0 0 0 0 0 0 15 0.9
18% 35% 12% 6% 24% 0% 18% 24% 6% 73% 27% 0% 0% 0% 0% 0% 0% 0%
792 346 359 393 400 375 347 370 326 294 1011 458 67 30 33 18 26 21 1 1665 2.1
44% 45% 50% 51% 47% 44% 47% 41% 37% 61% 28% 4% 2% 2% 1% 2% 1% 0%
Page 23City of York
Parking System Strategic Plan
Existing Supply & Demand Conclusions
The preceding analysis dispels the common perception that downtown York has an inadequate supply of
public parking. The reality is that there are plenty of available on‐street parking spaces at the periphery
of the downtown core area and ample space in the City’s garages, given the observed peak occupancies
ranging from 29% to 57% of capacity.
The following have been identified as the key contributors to the prevailing misperception about the lack
of available parking in downtown:
1) The majority of the most convenient on‐street parking spaces in the high traffic areas of downtown
are quickly consumed early in the day and remain heavily occupied throughout the busiest hours of
day. Many of these spaces are being consumed by downtown residents who have permits which allow
them to park long‐term at meters, while the standard time limit for all other users is 2‐hours.
2) Generally, short‐term parkers prefer parking on‐street where their final destination is within view of
their parking space, which means that potential parkers will cruise in search of a vacant space near
their destination, rather than park in a more remote on‐street space or in an off‐street facility.
3) Short‐term parkers generally prefer parking on‐street or in surface parking lots rather than inside a
parking garage. When they do choose to park in one of the City garages, they can only find vacant
spaces on the uppermost levels of garages because all of the most convenient spaces on the lower
levels are either reserved for, or occupied early in the day by, monthly parkers and rarely turnover
throughout the day.
4) Unfamiliar visitors to downtown are usually frustrated by the current design of the way‐finding
signage scheme, the network of one‐way streets and the prohibition against certain left turn
movements. All of these conditions make it difficult to follow a logical and direct path to the entrances
of the parking garages.
5) Regular visitors to downtown are well aware that it is less costly to park for 2 hours or less at an on‐
street meter than inside in one of the City’s garages, resulting in greater demand for those spaces.
Future Supply/Demand based on Economic Development Plans
Impacts of Planned and Proposed Developments on the Parking System
DESMAN met with and interviewed numerous individuals representing organizations and private sector
entities engaged in the planning and implementation of various downtown projects that have the
potential to alter the supply of and demand for public parking in the future. Some of the project specifics
that were sought during these interviews included estimates of the degree to which a project might add
to the existing peak period population of employees, residents and/or visitors and business patrons in the
downtown area and whether or not the projects included new parking inventory or would likely eliminate
existing parking spaces.
Page 24City of York
Parking System Strategic Plan
Because the likelihood that all of the planned development projects becoming a reality within the
foreseeable future was uncertain, DESMAN relied on the staff of the City’s Economic Development
Department to reduce the list of potential developments down to only those projects destined for
completion or those that had strong potential to be undertaken within the next few years. The future
development projects in and around downtown York that were deemed to become a reality between
2017 and 2020 are listed in Table 10 and located on the map labelled Exhibit 15.
Table 10 Planned and Proposed Downtown Development Projects 2017‐2020
Existing / ITE (3rd Edition)
Map Block Project Project Name/ Location/ Project Project Total Project Approx. Net
# #
To Be Peak Pkg. Demand
Completion Description Address Description Land‐uses Density Parking Need
Added Spaces Gen. Factors
Rest. = 12 spaces
Restaurant with commercial 2 floors Restaurant 20,000 sf Per 1,000 GSF
1 5 2016 ROCKFISH RESTAURANT 110 N. George St.
office space above 2 floors Com. Office 20,000 sf
0
Off. = 2.4 spaces
0
Per 1,000 GSF
Apartments with Resid. = 1.3 spaces
2 5 2016 PULLMAN APARTMENTS 238 N. George St. 22 Market Rate Apartments Units
Restaurant
15,000 SFT 0
Per Unit
25 spaces
Resid. = 1.3 spaces
3 17 2016 CITIZEN'S BUILDING 15 N. George St. 14 Market Rate Apartments 25,356 0
Per Unit
18 spaces
Residential/ Resid. = 1.3 spaces
4 16 2016 ONE WEST 1 W. Marketway 45 Market Rate Apartments
Commercial
50,000 sq ft. 100
Per Unit
65 spaces
Resid. = 1.2 spaces
WEST MARKET
Per Unit
REVITALIZATION PROJECT Resid. = 9 spaces
Restauant Retail/ Rest. = 12 spaces
5 26 2017 Weinbrom Jewelers Bldg 54‐56 W. Market St. Entertainment, Retail, Housing
Residential
26,222 SFT 2 spaces
Per 1,000 GSF
Rest. = 15 spaces
F.W. Woolworth Store 44‐50 W. Market St. 7 retail space and 1 restaurant Retail = 35 spaces
Retail = 2.0 spaces
Zakies Building 25‐27 W. Market St. 8 one bedroom apartments Per 1,000 GSF
YORK ACADEMY High School to occupy
HIGH SCHOOL Penn‐Supreme Dairy School = 1 space
6 NC 2017
Expanded to
2 N. Hamilton Ave.
Factory across River in 2017
High School 70,741 sq. ft. 70 spaces on site
per employee
0 spaces
include 7th‐12th 70 Employees
Resid. = 1.2 spaces
UNITED FIBER & DATA Office/ Retail 55,000 SF Total Per Unit
Resid. = 8 spaces
(lot of uncertainty Recording Studios/ 6 Residential Retail = 3.4 spaces
7 8 2017
about redevelopment)
210 York St.
Apartments Apartments
16,200 SF Occupied 15 spaces
Per 1,000 GSF
Off. = 60 spaces
Retail = 14 spaces
2016 Fiber Line 20 Employees 37,800 SF Unoccupied Off. = 2.4 spaces
Technology Park Per 1,000 GSF
to be finished
YORK COUNTY
121 N. Pershing Ave.
HISTORY CENTER Consolidation of
Historical Center/ 100 spaces Museum = 2.0 spaces
8 4 2017‐18 Metropolitan Edison 3 museum locations
Green Space
N/A
existing on site Per 1,000 GSF
0 spaces
Steam Plant Bldg. 31 Employees
timetable 2018‐2020
TIME GROUP RESIDENTIAL 200 Block of 130‐150 residential mixed use single/ Resid. = 1.7 spaces
9 4 2018
DEVELOPMENT PROJECT N. Beaver St. apartment units multifamily and retail
182,000 sq ft. 0 spaces
Per Unit
250 spaces
Bicycling and Walking Trail to run Biking and walking Lot 8 at Lafayette
RAIL TRAIL PARKWAY
along Northampton Street and N. trail to run from York Plaza could be
10 4 2018 DEVELOPMENT/CODORAS
3rd Street. The trail follows the College to Revolution
N/A
eliminated as part of
N/A
CREEK COORIDOR
Bushkill Creek to N. 13th Street. Stadium. green space project.
School = .25 spaces
York College Hospitality School of
11 17 2018 LAFAYETTE CLUB 59 E. Market St.
Mgmt. Ctr. Hospitality/Events
7,144 sq. ft 0 per Employee/ 20 spaces
Faculty
KID'S SPACE CENTER Kids Play 580+ spaces Museum = 2.0 spaces
12 NC 2018 York Armory Bldg (Army to 369 N George St Kids play center
Center Museum
30000 sq. ft.
at Smalls Field Per 1,000 GSF
0 spaces
Relocate)
120 room hotel (90 rooms in Needed Parking
Restaurant Ballroom/
YORKTOWN HOTEL/ active use) with ballroom and Accommodated in Hotel = .9 spaces
45 E. Market St. Conference Room/ 12,000 Sq.Ft. 90 spaces
OFFICE TOWER & GARAGE ground floor restaurant and Market Street Per Guest Room
110 Guest Rooms
unusable valet only garage Garage
13 27 2020
ANONYMOUS
Corporate Office Off. = 2.4 spaces
CORPORATE S. Duke St. Corporate Office 85,000 SF 0 spaces 200 spaces
240 Employees Per 1,000 GSF
HDQTRS.
Estimate of Potential Future Peak Period Parking Demand ±800 Spaces
NC = Denotes proposed and planned projects that are located outside the downtown parking study area.
Page 25City of York
Parking System Strategic Plan
Exhibit 15 Planned and Proposed Downtown Development Projects 2017‐2020
Map Block Project Project Name/ Approx. Net
# # Completion Description Parking Need
1 5 2016 ROCKFISH RESTAURANT 0
2 5 2016 PULLMAN APARTMENTS 25 spaces
3 17 2016 CITIZEN'S BUILDING 18 spaces
4 16 2016 ONE WEST 65 spaces
WEST MARKET
REVITALIZATION PROJECT Resid. = 9 spaces
5 26 2017 Weinbrom Jewelers Bldg Rest. = 15 spaces
F.W. Woolworth Store Retail = 35 spaces
Zakies Building
YORK ACADEMY
HIGH SCHOOL
6 NC 2017
Expanded to
0 spaces
include 7th‐12th
UNITED FIBER & DATA
Resid. = 8 spaces
(lot of uncertainty
7 8 2017
about redevelopment)
Off. = 60 spaces
Retail = 14 spaces
2016 Fiber Line
to be finished
YORK COUNTY
HISTORY CENTER
8 4 2017‐18 Metropolitan Edison 0 spaces
Steam Plant Bldg.
timetable 2018‐2020
TIME GROUP RESIDENTIAL
9 4 2018
DEVELOPMENT PROJECT
250 spaces
RAIL TRAIL PARKWAY
10 4 2018 DEVELOPMENT/CODORAS N/A
CREEK COORIDOR
11 17 2018 LAFAYETTE CLUB 20 spaces
KID'S SPACE CENTER
12 NC 2018 York Armory Bldg (Army to 0 spaces
Relocate)
YORKTOWN HOTEL/
90 spaces
OFFICE TOWER & GARAGE
13 27 2020
ANONYMOUS
CORPORATE 200 spaces
HDQTRS.
DESMAN relied on data contained within the Institute of Transportation Engineers’ (ITE) "Parking
Generation" (3rd Edition) publication to convert the future development project into an approximate
number of parking spaces each project would require to satisfy the peak period demand for parking that
each project is expected to generate. Any existing parking spaces that would be lost or new parking spaces
that would be gained as a result of each development project were subtracted from, or added to, the
same project’s estimated peak period parking demand in order to arrive at a net number of future spaces
the project would require.
Based on this analysis, it was concluded that if each of these future projects were to be completed as
proposed, they would collectively create a need for ±800 additional downtown parking spaces. However,
Page 26City of York
Parking System Strategic Plan
because the survey of current parking utilization revealed that 43% (359 spaces) of the on‐street parking
supply and 62% (1,226 spaces) of the City‐controlled off‐street parking supply is typically unoccupied
during the peak demand period (1,585 total spaces), it is quite possible that the ±800 space need projected
to result from the future development projects could be satisfied by the City’s current inventory of parking
spaces.
Evaluation of Current Assets
The evaluation of the GA’s parking assets included an assessment of three parking structures and nine of
the surface parking lots in the downtown study area. DESMAN also reviewed the condition of the GA’s
parking meter system and the access control and revenue collection equipment currently installed in
parking garages. However, our findings related to the condition of the equipment is discussed in the next
section of this report.
The assessments of the three garages involved a site visit and walkthrough inspection by qualified
engineers with expertise in structural, mechanical, electric, and plumbing system design and
maintenance. The existing state of the physical elements of each parking structure were documented, but
no sounding surveys or invasive testing was performed. Based on the surveys and DESMAN’s expertise in
parking structure restoration and repair, estimates of the probable cost to address needed repairs and
system replacements during the next 40 years were formulated. The costs are offered as order of
magnitude estimates of likely capital improvement expenditures that the GA will need to make in order
to keep the parking structures in good condition, as they were found to be in at the time of this report.
The review of the surface parking lots was limited to an evaluation of the surface condition, striping and
general layout. Repair and maintenance estimates for the surface lots are based on the unit costs for
standard asphalt paving maintenance and resurfacing treatments, as well as for restriping, applied to the
area square footage of each lot over a 40 year period into the future.
Parking Garage Condition Assessments
King Street Parking Garage
The King Street Parking Garage is a 7‐level structure. It appears that the top two levels were a later
addition to the structure, but no documentation of a vertical expansion could be located. The garage
operates as a 3‐bay, single helix with one‐way traffic on the double bay side and two‐way traffic on the
single bay side. The structural system consists of cast‐in‐place, post‐tensioned concrete slabs supported
by cast‐in‐place, post‐tensioned concrete beams and cast‐in‐place, conventionally reinforced concrete
columns.
The parking garage is in “Good” condition at this time. Most deficiencies noted could be attributed to
normal wear and tear. Potential code violations included minor electrical items such as a missing wall
Page 27City of York
Parking System Strategic Plan
plate, damaged exit signs, and battery backup for egress lighting. The current vehicle barrier system
between the interior ramped bays is not code‐compliant. The guardrail in the northwest stair and elevator
tower is not code‐compliant either. The cost estimate presented in Table 11 addresses the immediate
code items as well as future repairs and upgrades to maintain the safe use of the facility.
Table 11 Opinion of Probable Capital Repair Costs for the King Street Parking Garage (October 2016)
Near‐Term Repair Totals Near‐Term Repair Priority Long‐Term Repair Costs
Immediate High Moderate
Item Description Quantity Unit Price Cost 0‐1 Yr 1‐5 Yrs 6‐10 Yrs 11‐20 Yrs 21‐30 Yrs 31‐40 Yrs
1. Structural Repair Work
a. Concrete Floor Repairs 720 sf x $60.00 = $43,200 $0 $0 $43,200 $20,000 $121,000 $182,000
b. Vertical Concrete Repairs 70 sf x $90.00 = $6,300 $0 $0 $6,300 $0 $18,000 $27,000
c. Overhead Concrete Repairs 180 sf x $120.00 = $21,600 $0 $0 $21,600 $0 $48,000 $72,000
d. Stair Repairs 100 sf x $100.00 = $10,000 $0 $0 $10,000 $0 $15,000 $23,000
e. Masonry Repairs 200 sf x $75.00 = $15,000 $0 $0 $15,000 $0 $23,000 $35,000
f. Façade Repairs 100 sf x $150.00 = $15,000 $0 $0 $15,000 $0 $30,000 $45,000
g. Vehicle Barrier System Upgrades per Code 700 lf x $125.00 = $87,500 $87,500 $0 $0 $0 $0 $0
Subtotal $87,500 $0 $111,100 $20,000 $255,000 $384,000
2. Waterproofing Work
a. Remove and Replace Sealants 1,250 lf x $8.00 = $10,000 $0 $0 $10,000 $10,000 $10,000 $10,000
b. Remove and Replace Expansion Joints 395 lf x $120.00 = $47,400 $0 $0 $47,400 $47,400 $47,400 $47,400
c. Clear Penetrating Sealer Application 193,000 sf x $0.50 = $96,500 $0 $0 $96,500 $96,500 $96,500 $96,500
d. Waterproofing Membrane Application 8,000 sf x $5.00 = $40,000 $0 $0 $40,000 $20,000 $40,000 $20,000
Subtotal $0 $0 $193,900 $173,900 $193,900 $173,900
3. Architectural Work
a. Guardrail Modifications per Code 5 ea x $1,000.00 = $5,000 $5,000 $0 $0 $0 $0 $0
b. Clean and Repaint Vertical and Overhead 54,000 sf x $2.00 = $108,000 $0 $0 $108,000 $0 $108,000 $0
Surfaces
c. Striping & Traffic Markings 1 ls x $19,000.00 = $19,000 $0 $19,000 $19,000 $19,000 $19,000 $19,000
d. Wayfinding Signage 1 ls x $62,000.00 = $62,000 $0 $0 $62,000 $0 $62,000 $0
e. Miscellaneous Items (doors, frames, glazing, 1 ls x $84,000.00 = $84,000 $0 $0 $84,000 $0 $112,000 $0
tower roofing, handrails, etc.)
Subtotal $5,000 $19,000 $273,000 $19,000 $301,000 $19,000
4. M/E/P/FP Work
a. Mechanical Work 1 ls x $2,600.00 = $2,600 $0 $2,600 $0 $0 $10,000 $0
b. Electrical Work per Code 1 ls x $17,050.00 = $17,050 $17,050 $0 $0 $0 $0 $0
c. Electrical Work (Maintenance and Upgrades) 1 ls x $144,800.00 = $144,800 $0 $0 $144,800 $0 $687,000 $0
d. Plumbing Work 1 ls x $750.00 = $750 $0 $750 $0 $0 $49,000 $0
e. Fire Protection Work 1 ls x $12,000.00 = $12,000 $0 $0 $12,000 $0 $201,000 $0
Subtotal $17,050 $3,350 $156,800 $0 $947,000 $0
5. Miscellaneous Costs
a. General conditions (mobilization, de‐mob, Varies by year based on construction costs $11,000 $3,000 $74,000 $22,000 $170,000 $58,000
supervision, miscellaneous work, etc.)
Subtotal $11,000 $3,000 $74,000 $22,000 $170,000 $58,000
Subtotal $120,550 $25,350 $808,800 $234,900 $1,866,900 $634,900
Construction Contingency @ 20% $24,150 $5,050 $161,800 $47,000 $373,400 $127,000
Engineering @ 8% $9,600 $2,000 $64,700 $18,800 $149,400 $50,800
Total $154,300 $32,400 $1,035,300 $300,700 $2,389,700 $812,700
Notes
1) Costs are expressed in 2017 dollars. Inflation and escalation have not been included in the cost estimates.
2) The figures are exclusive of annual budgets for operational issues such as light bulb replacement, janitorial services, equipment maintenance contracts, etc.
3) The figures are exclusive of revenue control system and security equipment changes, and any abatement of hazardous materials.
4) Estimate an additional cost of 10% to 15% if a single work item is divided over multiple years (Not included in the above cost estimate table).
Philadelphia Street Parking Garage
The Philadelphia Street Parking Garage is a 4 ½‐level structure. The garage operates as a double helix with
one‐way traffic and angled parking. The structural system consists of cast‐in‐place, post‐tensioned
concrete slabs supported by cast‐in‐place, post‐tensioned concrete beams and cast‐in‐place,
Page 28City of York
Parking System Strategic Plan
conventionally reinforced concrete columns. The exposed roof level has a waterproofing membrane
applied to it.
The parking garage is in “Fair‐to‐Good” condition at this time. Most deficiencies noted could be attributed
to normal wear and tear. Potential code violations included minor electrical items such as a missing wall
plate, damaged exit signs, and battery backup for egress lighting. The current vehicle barrier system
between the interior ramped bays is not code‐compliant. The cost estimate presented in Table 12
addresses the immediate code items as well as future repairs and upgrades to maintain the safe use of
the facility.
Table 12 Opinion of Probable Capital Repair Costs for the Philadelphia Street Parking Garage (October 2016)
Near‐Term Repair Totals Near‐Term Repair Priority Long‐Term Repair Costs
Immediate High Moderate
Item Description Quantity Unit Price Cost 0‐1 Yr 1‐5 Yrs 6‐10 Yrs 11‐20 Yrs 21‐30 Yrs 31‐40 Yrs
1. Structural Repair Work
a. Concrete Floor Repairs 900 sf x $60.00 = $54,000 $0 $0 $54,000 $0 $95,000 $143,000
b. Vertical Concrete Repairs 460 sf x $90.00 = $41,400 $0 $0 $41,400 $0 $43,000 $65,000
c. Overhead Concrete Repairs 100 sf x $120.00 = $12,000 $0 $0 $12,000 $0 $38,000 $57,000
d. Stair Repairs 200 sf x $100.00 = $20,000 $0 $0 $20,000 $0 $30,000 $45,000
e. Masonry Repairs 300 sf x $75.00 = $22,500 $0 $0 $22,500 $0 $34,000 $51,000
f. Façade Repairs 200 sf x $150.00 = $30,000 $0 $0 $30,000 $0 $60,000 $90,000
g. Vehicle Barrier System Upgrades per Code 420 lf x $125.00 = $52,500 $52,500 $0 $0 $0 $0 $0
Subtotal $52,500 $0 $179,900 $0 $300,000 $451,000
2. Waterproofing Work
a. Remove and Replace Sealants 480 lf x $8.00 = $3,840 $0 $0 $3,840 $3,840 $3,840 $3,840
b. Remove and Replace Expansion Joints 72 lf x $120.00 = $8,640 $0 $0 $8,640 $8,640 $8,640 $8,640
c. Clear Penetrating Sealer Application 76,000 sf x $0.50 = $38,000 $0 $0 $38,000 $38,000 $38,000 $38,000
d. Waterproofing Membrane Application 29,000 sf x $3.00 = $87,000 $0 $0 $87,000 $145,000 $87,000 $145,000
Subtotal $0 $0 $137,480 $195,480 $137,480 $195,480
3. Architectural Work
a. Clean and Repaint Vertical and Overhead 22,000 sf x $2.00 = $44,000 $0 $0 $44,000 $0 $44,000 $0
Surfaces
b. Striping & Traffic Markings 1 ls x $10,000.00 = $10,000 $0 $10,000 $10,000 $10,000 $10,000 $10,000
c. Wayfinding Signage 1 ls x $32,000.00 = $32,000 $0 $0 $32,000 $0 $32,000 $0
d. Miscellaneous Items (doors, frames, glazing, 1 ls x $62,000.00 = $62,000 $0 $0 $62,000 $0 $87,000 $0
tower roofing, handrails, etc.)
Subtotal $0 $10,000 $148,000 $10,000 $173,000 $10,000
4. M/E/P/FP Work
a. Mechanical Work 1 ls x $3,100.00 = $3,100 $0 $3,100 $0 $0 $10,000 $0
b. Electrical Work per Code 1 ls x $17,450.00 = $17,450 $17,450 $0 $0 $0 $0 $0
c. Electrical Work (Maintenance and Upgrades) 1 ls x $145,750.00 = $145,750 $0 $0 $145,750 $0 $363,000 $0
d. Plumbing Work 1 ls x $2,500.00 = $2,500 $0 $2,500 $0 $0 $18,000 $0
e. Fire Protection Work 1 ls x $13,000.00 = $13,000 $0 $0 $13,000 $0 $105,000 $0
Subtotal $17,450 $5,600 $158,750 $0 $496,000 $0
5. Miscellaneous Costs
a. General conditions (mobilization, de‐mob, Varies by year based on construction costs $7,000 $2,000 $63,000 $21,000 $111,000 $66,000
supervision, miscellaneous work, etc.)
Subtotal $7,000 $2,000 $63,000 $21,000 $111,000 $66,000
Subtotal $76,950 $17,600 $687,130 $226,480 $1,217,480 $722,480
Construction Contingency @ 20% $15,350 $3,500 $137,470 $45,320 $243,520 $144,520
Engineering @ 8% $6,200 $1,400 $55,000 $18,100 $97,400 $57,800
Total $98,500 $22,500 $879,600 $289,900 $1,558,400 $924,800
Notes
1) Costs are expressed in 2017 dollars. Inflation and escalation have not been included in the cost estimates.
2) The figures are exclusive of annual budgets for operational issues such as light bulb replacement, janitorial services, equipment maintenance contracts, etc.
3) The figures are exclusive of revenue control system and security equipment changes, and any abatement of hazardous materials.
4) Estimate an additional cost of 10% to 15% if a single work item is divided over multiple years (Not included in the above cost estimate table).
Page 29You can also read