Deterministic Seismic Microzonation of the NCT-Delhi (India) and Earthquake Engineering Implications
←
→
Page content transcription
If your browser does not render page correctly, please read the page content below
Deterministic Seismic Microzonation of the NCT- Delhi (India) and Earthquake Engineering Implications Luxman Kumar Indian Institute of Technology Roorkee J. P. Narayan ( jp.narayan@eq.iitr.ac.in ) Indian Institute of Technology Roorkee Research Article Keywords: Finite-fault stochastic ground motion simulation, dynamic corner frequency, seismic microzonation of Delhi, local site effects Posted Date: June 1st, 2021 DOI: https://doi.org/10.21203/rs.3.rs-499148/v1 License: This work is licensed under a Creative Commons Attribution 4.0 International License. Read Full License

1 DETERMINISTIC SEISMIC MICROZONATION OF THE NCT-DELHI (INDIA) AND
 2 EARTHQUAKE ENGINEERING IMPLICATIONS
 3
 4 Luxman Kumar and J.P. Narayan
 5 Department of Earthquake Engineering, Indian Institute of Technology Roorkee, India
 6 e-mail: kumarluxman90@gmail.com; jp.narayan@eq.iitr.ac.in
 7
 8 ABSTRACT
 9
10 A deterministic seismic microzonation of the NCT Delhi (The capital of INDIA) and its earthquake
11 engineering implications is presented in this paper. The NCT Delhi with population density around
12 21,000/sq. Km has experienced several severe earthquake shakings in the past due to
13 earthquake occurrences in its vicinity and in the Great Himalaya. The exposed central quartzite
14 ridge, Badarpur-Okhala hillocks and River-Yamuna are responsible for the very large spatial
15 variation of sediment thickness (10 m to more than 300 m) in the NCT Delhi. The dynamic
16 properties of sediment layers over the quartzite basement at 158 sites, well distributed in the NCT
17 Delhi, are considered for seismic microzonation. First, we have finalised the maximum credible
18 earthquake (MCE) for each considered site based on the deterministic seismic hazard analysis.
19 Thereafter, acceleration time history at basement level is computed at each site using stochastic
20 finite-fault method with dynamic corner frequency and the geometry as well as rupture-dimension
21 of the respective MCE. The basement ground motion is numerically transferred to the free surface
22 using the rheological parameters and thickness of sediment layers overlying the quartzite
23 basement. Different maps of earthquake engineering interest like peak ground acceleration
24 (PGA), peak ground velocity (PGV) and peak ground displacement (PGV) at basement level and
25 the free surface level are developed and analysed for earthquake implications. The obtained
26 range of PGA (0.08-0.30g), PGV (3.34-26.58cm/s) and PGD (0.55-7.2cm) at the free surface and
27 fundamental frequency of the sediment deposit (0.4-7.0Hz) reveals that the NCT Delhi needs
28 special attention by the planners, engineers and decision makers for earthquake disaster
29 preparedness.
30
31 Key Words:
32
33 Finite-fault stochastic ground motion simulation, dynamic corner frequency, seismic
34 microzonation of Delhi, local site effects

 1
35 Declarations
36 Ethical statements: We consciously assure that the manuscript contains our own original work,
37 which has not been previously published elsewhere. The paper reflects Our own research and
38 analysis in a truthful and complete manner.
39 Funding: Not applicable
40 Conflicts of interest / competing interests: The authors declare that there is no conflict of
41 interest.
42 Availability of data and material: Some or all data that support the findings of this study are
43 available from the first author upon reasonable request.
44 Code availability: The inquiries about the program availability, compilation or usage details
45 may be requested from the first author.
46 Authors Contribution: Both the authors contributed to the study conception and design. All
47 simulations were performed by Luxman Kumar. The first draft of manuscript was written by
48 Luxman Kumar and both the authors contributed towards the final version of the manuscript.
49
50 1. INTRODUCTION
51
52 The seismic microzonation of an area taking into account the source, path and site effects is
53 essential for the prediction of relevant seismic parameters for the earthquake engineering
54 designs, land use planning, retrofitting, seismic disaster reduction, building insurance and risk
55 assessment (Oprsal et al., 2005; Wang, 2008; Anbazhagan and Sitharam, 2008; Shiuly and
56 Narayan, 2012). Earthquake engineers estimate design forces considering PGA and the response
57 spectra as per building to be designed (IS-1893:2002 (Part 1)). The response spectra to some
58 extent takes into account the effects of fundamental and higher modes of vibration of structure.
59 However, under double resonance condition, the dynamic forces during earthquake may be much
60 larger than that of predicted using current practice and building may not survive. The dynamic
61 force may increase by a factor of 3-5 times under double resonance condition (Romo and Seed
62 1986; Kumar and Narayan, 2018). For example, the unexpected selective damage to the high-
63 rise buildings in the Ahmedabad city at epicentral distance more 350 km took place due to the
64 occurrence of double resonance during the 2001 Bhuj earthquake (Narayan et al., 2002). The
65 seismic microzonation of NCT Delhi (The capital of India) seems essential considering highly
66 lateral variation of local geology (thickness and rheological parameters of the sediment deposits
67 above the quartzite rock) due to the presence of exposed central quartzite ridge, Badarpur-Okhala
68 hillocks and the Yamuna river, high population density (11,320 per sq km), the accelerated

 2
69 development of super structures like surface and sub-surface metro-lines, road-bridges, fly-overs,
 70 underground gas pipelines, commercial complexes and high-rise buildings (Agrawal and Chawla,
 71 2006). The heights of buildings may be even more than 50-stories in future due to day-by-day
 72 increase of population (Growth rate 2.94%). The NCT Delhi falls under the seismic zone IV as per
 73 the seismic zoning map of India (IS:1893 (part 1) -2002) and the assigned peak ground
 74 acceleration (PGA) for the zone IV is 0.24 g. The NCT Delhi has witnessed moderate to strong
 75 shaking due to earthquakes triggered in Himalayan and on local seismogenic sources (Iyengar
 76 2000; GSI, 2000; Sharma et. al., 2003; Manisha and Teotia, 2011; Prakash and Shrivastava
 77 2012). Further, earthquake shaking is always reported by the residents of high-rise buildings in
 78 the case of even distant earthquakes (epicentral distances >1000 km) due to the favourable
 79 condition for the occurrence of double resonance.
 80
 81 Many researchers carried out microtremors recordings at certain locations but not well distributed
 82 in the entire NCT Delhi to compute the fundamental frequency ( 0 ) of sediment deposits using
 83 H/V ratio method (Mukhopadhyay et al., 2002; Satyam and Rao, 2008; Mundepi et al.. 2010).
 84 Some of the researchers have used ambient noise measurement for the estimation of bedrock
 85 depth (Mundepi et al.. 2010). Iyenger and Ghosh (2004) considered the standard penetration test
 86 (SPT) data up to a depth of 30 m at 17 locations of the Delhi for the computation of F0 and spectral
 87 amplifications using SHAKE-91 program (Parvez et al., 2004; Mandal et al., 2014). The local and
 88 regional earthquake records have been used to compute F0 and spectral amplifications at few
 89 locations in the NCT Delhi using the standard spectral ratio (SSR) method (Nath et al., 2003;
 90 Mittal, 2011; Mittal et al., 2013). Recently, Sandhu et al. (2017) computed F0 of sediment deposit
 91 and spectral amplifications as well as average spectral amplification (ASA) at few locations in the
 92 NCT Delhi using horizontal to vertical spectral ratio (HVSR) of the earthquake records. The
 93 extensive literature review reveals that almost all the research works carried out in the past for
 94 the quantification of F0 and spectral amplifications in the NCT Delhi were limited to some locations
 95 only, particularly in the New Delhi region using either earthquake records (Nath et al.,2003; Mittal
 96 et al., 2013) or rheological parameters of sediment thickness limited to 30 m (Iyenger and Ghosh,
 97 2004; Parvez et al., 2004). However, National Center for Seismology (NCS) and Ministry of Earth
 98 Sciences (MoES), Government of India have conducted microtremors recordings, SPT tests and
 99 MASW mapping on a dense array for the computation of F0 and spectral amplifications in the
100 entire NCT Delhi (NCS-MoES, 2016). Recently, Kumar and Narayan (2020) numerically
101 computed the F0 of sediment deposit above the quartzite rock (Basement) and corresponding

 3
102 spectral amplifications in the entire NCT Delhi taking into account the rheological parameters and
103 the thickness of each sediment layers.
104
105 Sharma et. al. (2003) have carried out seismic hazard zonation at bedrock level for the NCT Delhi
106 using probabilistic seismic hazard analysis (PSHA). Iyengar and Ghosh (2004) also computed
107 seismic hazard at bedrock level over a part of NCT-Delhi using PSHA (Sarkar and Sankar, 2017).
108 Neelama and Rao (2009) computed the bedrock motion (PGA) deterministically for the Delhi
109 region using stochastic finite-fault simulation technique using a maximum credible earthquake on
110 different local seismic sources. Jayalakshmi and Raghukanth (2016) numerically simulated the
111 ground motion at some locations in NCT Delhi. Sharma et al. (2004) carried out seismic
112 microzonation of a part of the NCT Delhi (in and around the New Delhi district of NCT Delhi).
113 Similarly, Mohanty et al. (2007) prepared a seismic microzonation map in and around the central
114 Delhi ridge using geographic information system (GIS) and reported PGA range 0.06-0.21g at the
115 free surface. The comprehensive literature review on the seismic microzonation of the NCT Delhi
116 reveals that there are few studies and are limited to a small area of the NCT Delhi. However,
117 NCS-MoES (2016) first time prepared a report on the "seismic hazard microzonation of NCT
118 Delhi" on a 1:10,000 scale, wherein researcher of different disciplines worked at government level.
119 In the NCS-MoES (2016) report, the seismic microzonation maps for peak ground acceleration
120 (PGA) at engineering bedrock level corresponding to the maximum considered earthquake (MCE)
121 and design basis earthquake (DBE) using PSHA approach with 2% probability of exceedance in
122 50 years for the return period 2500 years and 10% probability of exceedance in 50 years for the
123 return period 475 years, respectively are given. The engineering-bedrock depth was considered
124 where S-wave velocity was equal to 760 m/s. Further, the bedrock depth was obtained after an
125 extrapolation of the available S-wave velocity up to a depth of 30 m only at most of the locations.
126 The response spectrum compatible ground motion at engineering-bedrock level at all the 449
127 considered sites were computed using 5% damping. Thereafter, the ground motion was
128 transferred to the free surface using the rheological parameters of the 1D layered sediment
129 deposit above the engineering-bedrock with the help of DYNEQ software. But, as per Central
130 Ground Water Board (CGWB) report for the year 2011-12, the range for sediment thickness is
131 100 m to 300 m at most of the western part of the NCT Delhi (CGWB (2011-12)). Means, the use
132 of sediment deposit above engineering-bedrock for transferring the engineering-bedrock motion
133 to free surface is not appropriate one and there is need of seismic microzonation of the NCT Delhi
134 taking into account the entire sediment deposit above the quartzite basement rock so that effects

 4
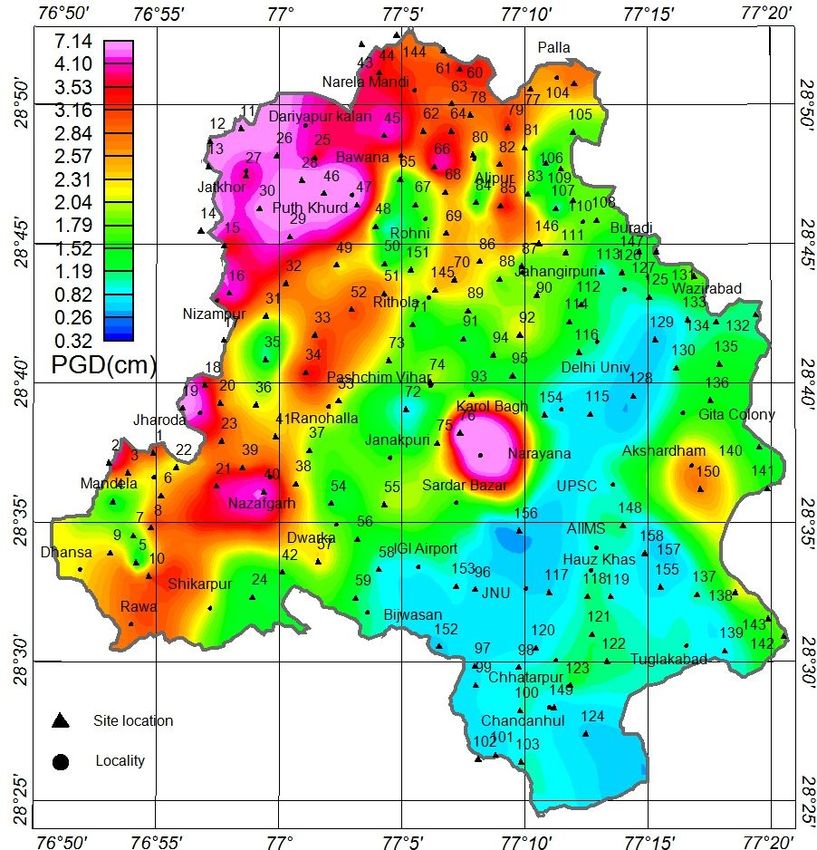
135 of sediment resonance and low frequency amplification on ground motion characteristics can be
136 incorporated.
137
138 This paper manifests the deterministic seismic microzonation of the NCT Delhi taking into account
139 the spatial variation of thickness of sediment deposit above the quartzite basement. The dynamic
140 properties of sediment layers and basement depth at all the well distributed 158 locations in the
141 NCT Delhi (Table 1) are mostly taken from Kumar and Narayan (2020) and the reports of NCS-
142 MoES (2016) and CGWB (2010-11). First, we have computed the peak ground acceleration
143 (PGA) using deterministic seismic hazard analysis (DSHA) at each site corresponding to MCE on
144 each local seismogenic sources to finalise the MCE for every considered sites in the NCT Delhi.
145 Thereafter, stochastic ground motion time histories at the basement level at all the 158 sites of
146 the NCT Delhi are simulated using respective MCE and corresponding fault parameters, rupture
147 dimension and position. We have used EXSIM program to simulate the stochastic ground motion
148 at the basement level which is based on dynamic corner frequency with a finite-fault dimension.
149 EXSIM is an open‐source stochastic finite‐source simulation algorithm that generates time series
150 of ground motion for earthquakes (Motazedian and Atkinson, 2005; Boore, 2009). Finally, the
151 computed velocity time history at basement level is transferred to the free surface using the
152 rheological parameters of each sediment layer with the help of fourth-order accurate staggered-
153 grid viscoelastic SH-wave finite-difference program written by Narayan and Kumar (2013). The
154 free surface ground motion acceleration and displacement time histories are computed using the
155 free surface velocity ground motion. The PGA at the free surface is also predicted using the
156 average spectral amplifications (ASA) in a frequency band 0-10 Hz and the computed PGA at the
157 basement level using EXSIM program. The fundamental frequency of sediment deposit at
158 different locations is also documented to infer the expected level of damage to different type of
159 buildings under the double resonance condition. We have developed maps for the PGA, peak
160 ground velocity (PGV) and peak ground displacement (PGD) at the basement level as well as at
161 the free surface level for the NCT Delhi and analysed for their earthquake engineering
162 implications.
163
164 2. GEOLOGY AND SEISMOTECTONICS OF NCT DELHI AND ADJOINING AREA
165
166 In the NCT Delhi, the presence of NE to NNE trending Aravali Ranges, known as the Delhi Central
167 Ridge, the outcropping Aravali formation from Okhla to Wazirabad and Yamuna Rive is
168 responsible for the highly variable sediment cover. The topography has changed considerably

 5
169 due to anthropogenic activity and many lines and natural ponds have been altered or obliterated.
170 The oldest exposed geological section in the region is middle to upper Proterozoic Delhi Super-
171 group. The Delhi Super-group is overlain by older Alluvium (unconsolidated Quaternary
172 sediments) of Late Pleistocene and recent Alluvium Holocene epoch. The Delhi Super-group
173 composed of gritty quartzite, quartzite, arkosic grit with lean intercalations of micaceous schist.
174 Delhi Super-group rock intruded through quartz and pegmatite veins. The older Alluvium mainly
175 composed of occasionally white micaceous, yellowish-brown, medium to fine sand, silty-clay, silt,
176 clay and kankar. The Recent Alluvium is limited to the flood plain of Yamuna stream and primarily
177 comprises grey micaceous medium to fine-grained sand, intercalations of clay and sediment
178 along fine nodular kankar. NCT Delhi has mainly three extensive Geomorphological units called
179 exposed rock Quartzite, older Alluvial smoothly undulating surface along rolling topography and
180 low lying surface of Yamuna River flood plain (Kazim et al., 2005).
181
182 Figure 1 depicts the seismotectonics of the NCT Delhi and adjoining region in an area 26.50N-
183 30.50N and 750E-800E. The Himalayan tectonic belt lies in the North-eastern part of the study
184 area. The southern part is covered through the Proterozoic Delhi fold belt and gneissic batholithic
185 complex. Delhi-Moradabad and Kasganj-Ujhani are the two tectonic sub-provinces which are
186 separated away with a trace of the Moradabad fault zone. The Moradabad fault zone shaping the
187 boundary of these two tectonic sub-provinces has been found to have a general NE-SW trend.
188 Delhi fold belt extended as North-Northeast Ridge towards Himalaya and is well known as the
189 Delhi-Hardwar ridge. The Himalayan Frontal Fold region and exposed Delhi Fold belt of
190 Proterozoic outline the northern and south-western boundaries of the Delhi-Moradabad tectonic
191 province. The surface trace of great boundary fault (GBF) is depicted as well-defined
192 Chittaurgarh-Machilpur lineament as a result of the presence of different geomorphic units on
193 either side. GBF together with its subsidiaries, exhibits trace of frequent reactivation at totally
194 different evolutionary history stages of this belt. The north-east trending Mahendragarh-Dehradun
195 subsurface fault (MDF) expands up to foothills of Himalaya. On the premise of remote sensing
196 studies, it has been found that a few major geomorphological features known as Lahore-Delhi
197 edge, Delhi Haridwar ridge, Himalayan Frontal Fold region and Delhi axis of folding are following
198 the regional trends (Srivastava and Roy, 1982). Criss-cross lineaments near Delhi (Hukku, 1966;
199 Mehta et al., 1970 and Gupta and Sharda, 1996) indicate the complexity of the zone probably due
200 to conjoining of the aforementioned geological structures. Geological Survey of India has mapped
201 an N-S trending fault appearing from Sohna to the west of Delhi called as Sohna fault. The
202 Mathura fault is trending in NE-SW direction. Figure 1 depicts that the study region is surrounded

 6
203 by local tectonic geological structures namely Mathura fault, Sohna fault, Delhi-Hardwar ridge,
204 Delhi-Lahore ridge, Mahendragarh-Dehradun fault, Aravalli-Delhi fold, Moradabad fault, Great
205 Boundary fault and several minor lineaments. The distant tectonic structure is known as Main
206 Boundary Thrust (MBT) and Main Central Thrust (MCT) in the Himalaya.
207
208 The NCT Delhi is shaken many times by both the local earthquakes and distant Himalayan
209 earthquakes (GSI, 2000; Sharma et. al., 2003; Manisha and Teotia, 2011). The M6.5 earthquake
210 of July 15, 1720 near Delhi (Sohna fault) caused heavy damage to the houses. The shaking due
211 to the M6.7 Bulandshar earthquake of October 10, 1956 was reported to be felt in the entire NCT
212 Delhi. The epicenter of M6 earthquake of August 27, 1960 was between Delhi Cantonment and
213 Gurgaon. During this earthquake two people died and about 100 people sustained injuries and
214 many buildings in the epicentral tract developed cracks. The maximum seismic intensity due to
215 this earthquake was estimated VII on the Modified Mercalli Intensity (MMI) scale. The M5.6
216 Moradabad earthquake of August 15, 1956 caused loss of lives and damage to property in the
217 NCT Delhi. In addition, the earthquakes originating in Himalayas and Hindukush region are
218 occasionally experienced in and around NCT Delhi. The recent Chamoli earthquake of March 29,
219 1999 caused shaking of the order of intensity VI to VII on MMI scale in the NCT Delhi.
220
221 National disaster management authority (NDMA) in 2011 reported a potential M7.1 in the NCT
222 Delhi and surrounding region (Jayalakshmi and Raghukanth, 2016). The historic earthquake
223 catalogue indicates the occurrence of a great earthquake in 1505 AD with MMI intensity XII near
224 Agra (Iyengar, 2000). The recent seismicity data reveals that most of the events that occurred in
225 and around Delhi are close to the proximity of Mahendragarh-Dehradun Fault (Iyengar, 2000;
226 Iyengar and Ghosh 2004; Prakash and Shrivastava 2012). So, an earthquake with Mw7.1 is
227 considered on MDF taking in to account its seismic acivity and length, although, there are no
228 recentaly occurred earthquake of this magnitude on this source (Jayalakshmi and Raghukanth,
229 2016). Based on the geological and tectonic set up of the region around the site, the
230 seismotectonic features as identified are given in figure 1. The spatial distribution of the past
231 earthquakes in this region shows that they occur mostly along significant geological and tectonic
232 features such as the Mahendragarh Dehradun Fault, Moradabad Fault and great Himalayan
233 Boundary fault zone, etc and the predicted maximum credible earthquakes (MCE) on these
234 features based on the past publications are given in table 2 (Iyengar, 2000; GSI, 2000; Sharma
235 et. al., 2003; Iyengar and Ghosh 2004; Manisha and Teotia, 2011; Prakash and Shrivastava 2012;
236 Jayalakshmi and Raghukanth, 2016).

 7
237
238 3. STOCHASTIC GROUND MOTION SIMULATION AT BASEMENT LEVEL
239
240 The stochastic point-source simulation was first developed by Boore (1983), which deliberates
241 both the deterministic and stochastic aspects of the ground motion (Brune, 1970; Hanks and
242 McGuire, 198; Boore, 2003). The stochastic aspects of ground motion are modelled as Gaussian
243 white noise with the specified underlying spectrum (Boore, 1983; 2003). The deterministic aspects
244 are defined by the mean Fourier spectrum as the multiplication of the omega square source
245 model, path effect and site effects (Brune, 1970). The extension of stochastic method to finite-
246 fault is carried out by Beresnev and Atkinson (1997), and Hartzell et al. (1999). The finite fault
247 stochastic method takes into consideration the effect of the geometry of fault in near-source by
248 discretizing the fault into sub-faults (point sources) and generates ground motion at the
249 observation point by adding the computed time series with a proper time-delay. Recently, Boore
250 (2009) have presented systematic comparisons of the point-source and finite-fault stochastic
251 formulations.
252
253 Motazedian and Atkinson (2005) modified the classical finite fault stochastic technique by
254 replacing the static corner frequency of the sub-faults with the dynamic corner frequency concept
255 to subside the dependency of the results on the sub-fault size. The Fourier amplitude spectrum
256 for the horizontal ground motion ( , ( )) from each sub-fault is mathematically expressed as

 − ,
 (2 )2 ( )
257 , ( ) = 0 , , [ 2 ] ( ) ( , ) ( ) (− ) (1)

 1+( )
 0 , ( )

258 Where = 4 3 is scaling factor, is the radiation coefficients averaged over the range of

259 azimuth and take off of angle, is free surface effect, ρ is the density (g/cc) of crust at the focal
260 depth and β is the shear wave velocity (km/s) in the source zone. , is a normalization factor
261 that aims to conserve high-frequency spectral level of ijth sub-fault. 0 , ( ), 0 , and ,
262 represent ijth sub-fault corner frequency, seismic moment and distance of site from the sub-fault,
263 respectively. The terms ( , ) and Q(f) represent the geometrical spreading and quality factor,
264 respectively. ( ) and (− ) represent the spectral amplification factors and high frequency
265 spectral decay, respectively and k is the Kappa value (Anderson and Hough, 1984). The corner
266 frequency for a particular sub-fault is computed using the following formula

 8
∆ 1/3
267 0 ( ) = 4.9 ∗ 106 ( ( ))−1/3 1/3 ( ) (2)
 0

268 Where ( ) ∆ represents the cumulative number of ruptured sub-faults at time t and stress
269 drop. The input parameters like stress drop (set as 50 bars), fault geometry, Q values and subfault
270 distribution as well as additional factors like site amplification, Kappa (k) are needed to be
271 determined for the stochastic simulations.
272
273 Six local seismogenic sources namely Mathura fault, Sohna fault, Delhi-Hardwar ridge,
274 Mahendragarh-Dehradun fault, Moradabad fault and Great Boundary fault have been delineated
275 and shown in figure 1 and table 2 (GSI, 2000). The maximum credible earthquake (MCE) for the
276 aforesaid seismogenic sources is finalised using pervious published literature and the occurrence
277 of maximum magnitude earthquake on and around the local sources ((Iyengar, 2000; GSI, 2000;
278 Sharma et. al., 2003; Manisha and Teotia, 2011; Prakash and Shrivastava 2012; Jayalakshmi
279 and Raghukanth, 2016). The seismicity data has been taken from Earthquake Engineering
280 Studies (2012) related to Khurja thermal power project (EQ:2012-39). First, deterministic PGA at
281 the basement level at each of the considered locations (158 sites) of the NCT Delhi have been
282 computed using MCE on the local seismic sources and Boore and Atkinson (2008) attenuation
283 relation. The seismogenic source which is producing largest PGA at a site is considered as the
284 MCE for that site. Finally, it is inferred that MCE for all the sites are associated with only three
285 faults namely Mathura fault, Sohna fault and Mahendragarh-Dehradun fault. Further, in the case
286 of SF, eight epicenters for the MCE are considered (Table 2). The DSHA analysis reveals that
287 most of the sites in the NE and NW are primarily controlled by the Mahendragarh-Dehradun fault,
288 while the SW and SE parts of the NCT Delhi are controlled by the Sohna and Mathura faults,
289 respectively.
290
291 After finalizing the MCE for each site, we have computed stochastic ground motion time histories
292 at all the 158 sites of NCT Delhi at the basement level using respective MCE, corresponding fault
293 parameters and rupture dimension and position (Table 2). We have used EXSIM program to
294 simulate the stochastic ground motion at the basement level which is based on dynamic corner
295 frequency with a finite-fault dimension (Motazedian and Atkinson, 2005; Boore, 2009). The
296 velocity and displacement time histories are obtained using the computed acceleration time
297 history. Tandon et al. (2015) reported a range of S-wave velocity and density as 2400-3500 m/s
298 and 2.6-2.8 g/cc, respectively for the quartzite rock (Mahajan et al., 2011). We have also taken
299 S-wave velocity and density for the homogeneous basement rock as 3200 m/s and 2.7 g/cc,

 9
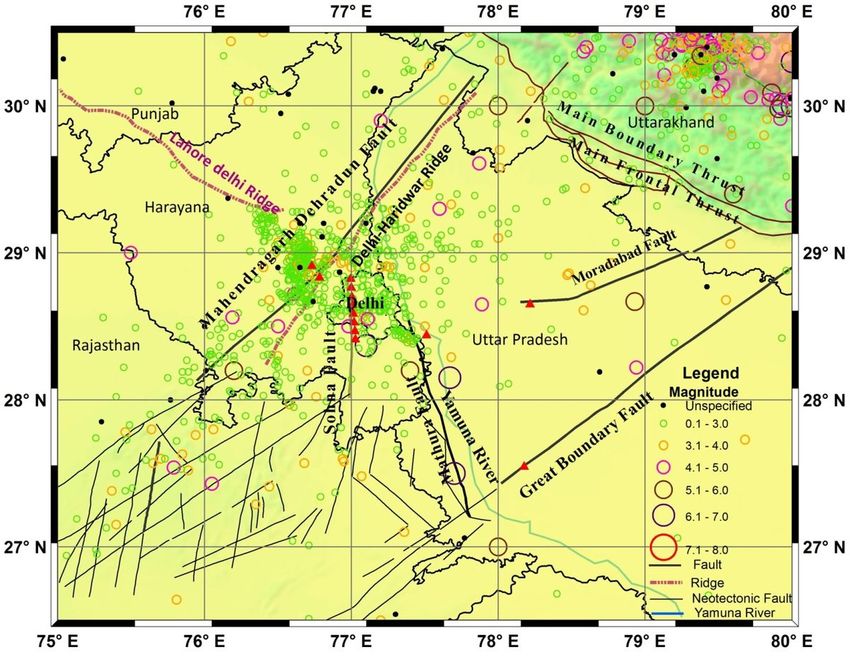
300 respectively. The used quality factor (800 (0.42)) and Kappa (0.04) in simulations are taken from
301 Singh et al. (2002) and Mittal et al. ( 2016), respectively. The geometrical spreading and path
302 duration effects are applied using the approach of Mittal et al. (2016) and Berensev and Atkinson
303 (1998), respectively. The contour maps for PGA, PGV and PGD are developed at the basement
304 level, as given in figures 8-10, respectively.
305
306 4. GEOTECHNICAL DATA FOR THE STUDY AREA
307
308 The sediment thickness in the NCT Delhi is highly variable from one site to the another site due
309 to the exposed quartzite rock as well as the Yamuna river. The presence of super structures like
310 fly-overs, bridges, surface and subsurface metros and high rise buildings calls the consideration
311 of transfer function of entire sediment deposit above the quartzite basement rock for seismic
312 microzonation of NCT Delhi. In order to compute the transfer function and fundamental frequency
313 of the sediment deposit above the quartzite basement the rheological parameters like density,
314 quality factor, S-wave velocity, anelastic coefficients, unrelaxed shear modulus and thickness of
315 the various sediment layers are requisite at different locations in the NCT Delhi. Kumar and
316 Narayan (2020) have developed empirical relationships to predict the average S-wave velocity
317 (m/s) up to basement depth (m) for each location using available velocity up to a depth of 30 m
318 for different layers from the published research works up to the basement depth (Iyenger and
319 Ghosh, 2004; Mundepi et al., 2010; NCS-MoES, 2016; Sandhu et al., 2017) and the power law.
320 The S-wave velocity up to a depth of 67 m and 55 m was available at two locality only namely
321 Swarup Nagar and Chhatarpur, respectively (NCS-MoES, 2016). Kumar and Narayan (2020)
322 derived the basement depths at considered sites using the available depth contour map from
323 CGWB (2011-12) annual report (Fig. 2) and published literature (Mohanty et al., 2009; Mundepi
324 et al., 2010; Manisha and Teotia, 2011). For example, the developed empirical relationship for
325 the site-114 (Model Town) using velocity and depth information up to a depth of 50 m (Table 3)
326 and power law is given in equation 3.
327 = 134.4 ∗ ( )0.35 (3)

328 The estimated S-wave velocity for the sediment layer of thickness 100 m above the basement at
329 site-114 is 689 m/s (Table 3).
330 The density (ρ) in gm/cc of each sediment layer is computed in terms of Vs (m/s) using an
331 empirical relationship (Eqn. 4) developed by Kumar and Narayan (2020).

332 = 1.65475 + 0.000264VS (4)

 10
333 The quality factors (Q) for sediment layers with S-wave velocity in range of 175 m/s to 610 m/s
334 are obtained using the empirical relation proposed by Iyasen (1996) and for Vs more than 610
335 m/s, Q is taken as simply 10% of Vs (Rao et al., 2006).

336 = 0.08 + 6.99 (5)

337 In order to incorporate frequency dependent damping in the time domain simulations using GMB-
338 EK rheological model, it is assumed that the obtained S-wave velocity and quality factor in each
339 layer are measured in the field using the signal with 1.0 Hz frequency (Emmerich and Korn, 1987).
340
341 5. GROUND MOTION SIMULATION AT FREE SURFACE
342
343 The current trend of seismic microzonation in most of the countries is to predict the ground motion
344 at basement level using probabilistic seismic hazard assessment (PSHA) or DSHA and then
345 transfer it to the free surface incorporating the 1D S-wave response of the local sediment column
346 (Oparsal et al., 2005; Anbazhagan and Sitharam, 2008; Shiuly and Narayan, 2012). A fourth-
347 order accurate velocity-stress staggered-grid viscoelastic SH-wave finite-difference (FD) program
348 developed by Narayan and Kumar (2013) is employed to transfer the basement velocity time
349 history to the free surface. The frequency-dependent damping in the time-domain simulation is
350 implemented on the basis of acknowledge GMB-EK rheological model (Emmerich and Korn,
351 1987; Kristek and Moczo, 2003; Narayan and Sahar, 2014). Anelastic coefficients for each
352 sediment layers at each site are determined using quality factor, four relaxation frequencies,
353 Futtermann relation (Futtermann, 1962) and least-square optimization technique. Thereafter, the
354 unrelaxed rigidity for each sediment layers are calculated using phase velocity at a reference
355 frequency 1.0 Hz. For example, table 4 depicts the computed unrelaxed rigidity and anelastic
356 coefficients at four 0.02 Hz, 0.2 Hz, 2.0 Hz and 20 Hz relaxation frequencies for the site-114
357 (Model Town). The Stress imaging approach is implemented as a free surface boundary condition
358 at the free surface (Narayan and Kumar, 2008). The sponge absorbing boundary condition is
359 utilized at the model edges to avoid edge reflections (Israeli and Orszag, 1981; Kumar and
360 Narayan, 2008). The derived velocity time history at basement level at each site from the
361 stochastically computed acceleration time histories is transferred to the free surface numerically
362 using the dynamic properties of different sediment layers overlying the basement. Thereafter, the
363 transferred velocity time histories at the free surface are used to compute the acceleration and
364 displacement time histories for that site.
365

 11
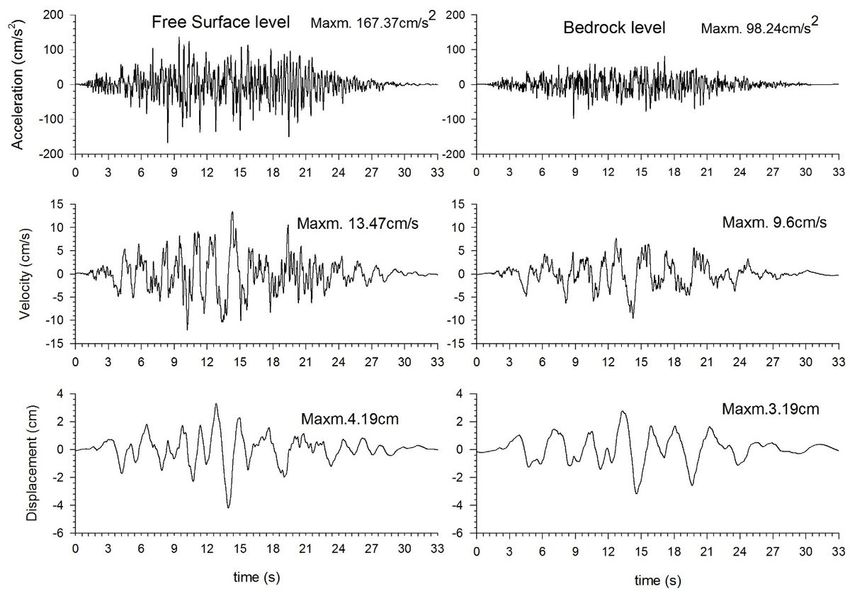
366 First, 1D basin models are prepared for each site using the parameters of sedimentary layers and
367 the underlying quartzite basement rock. For example, at site114 (Model Town), there are 11-
368 sediment layers above the quartzite basement (Table 4). There are 10 layers within top 30 m and
369 thickness of the considered 11th layer is around 70 m. So, total thickness of sediment deposit at
370 site114 is 100 m. The S-wave velocity at the base of 11th layer is obtained using developed
371 empirical relation as 689 m/s. In the 11th sediment layer, a continuous increase of S-wave
372 velocity, shear modulus, quality factor and density with depth is considered. The 1D basin model
373 for site114 is discretised with a grid size of 1.5 m in the horizontal direction and in the vertical
374 direction it is 1.5 m up to a depth of 330 m and 10 m thereafter. Time step is taken as 0.0003s to
375 avoid stability problem. A plane horizontal SH-wave front is generated in the numerical grid at a
376 depth of 325 m using various point sources along a line. The obtained velocity time history from
377 the stochastic simulation is used to incorporate a particular point source in the FD grid. The
378 simulated velocity time history at the free surface in the absence of sediment deposit is used to
379 generate a factor to normalise the simulated motion in the presence of sediment layers for all the
380 sites. The left and right panels of figure 3b show the transferred velocity time history at the free
381 surface and the same at the basement level for the site114, respectively. We have generated
382 acceleration and displacement time histories using the velocity time history at free surface for
383 site114, as shown in left panels of figure 3a & 3c, respectively. Similar exercise is carried out for
384 all the considered 158 sites.
385
386 In order to study the effect of sediment thickness on the transferred ground motion at the free
387 surface, we have considered another two sites namely site2 and site96 where sediment thickness
388 is large (320 m) and very less (9m), respectively. The computed acceleration, velocity and
389 displacement time histories as well as corresponding basement time histories for site2 and site96
390 are shown in figures 4 and 5, respectively. An analysis of figures 3-5 depicts drastic reduction of
391 PGA and minor increase of duration with an increase of epicentral distance at the basement level.
392 The obtained increase of vigils in the case of acceleration time history at free surface as compared
393 to the basement at site96 indicates the larger amplification of higher frequencies. On the other
394 hand, reverse is the case at site2, where sediment thickness is 320 m. The amplification of PGA,
395 PGV and PGD at site2 are 1.7, 1.4 and 1.3 times, at site114 are 1.9, 1.5 and 0.8 times and at
396 site96 are 2.2, 0.9 and 0.6, respectively. Further, at a particular site, the amplification of PGA is
397 largest and that of PGD is least. A decrease of amplification of PGD and an increase of PGA with
398 decrease of sediment thickness can be inferred. But, in the case of PGV, there is not such clear
399 trend with variation of sediment thickness. There is de-amplification of PGD when sediment

 12
400 thickness is lesser. For example, amplification factor is 0.8 and 0.6 at site114 and site96 where
401 sediment thickness is 100 m and 9 m, respectively.
402
403 In order to infer the variation of PGA, PGV and PGD due to epicentral distance, MCE, focal
404 mechanism and fault parameters at a particular site, the variation of these engineering parameters
405 at site114 (Model Town) are computed using the MCEs on MDF (Mw7.1), MF (Mw6.5) and SF
406 (Mw6.0) and shown in figures 3, 6 & 7, respectively. The obtained PGA at site114 is more or less
407 same corresponding to MCEs on MDF, MF and SF. This may be due to the effect of epicentral
408 distance, frequency dependent earth-filtering, radiation pattern and the magnitude. But, PGD is
409 largest in the case of MCE Mw7.1 on MDF (1.93 cm) and least in the case MCE Mw6.0 on SF
410 (0.87 cm) at the basement level; which is in accordance with the Brune’s model (Brune, 1970).
411 Further, the obtained different sediment amplification factors for a particular parameter (say PGA)
412 in the case of ground motion due to MCEs on MDF, MF and SF at site114 may be due to the
413 change of spectra with magnitude, fault parameters, focal mechanism and epicentral distance.
414
415 In the past, some of the scientists have used average spectral amplification (ASA) caused by
416 sediment deposit to transfer the predicted PGA at the basement level to compute the same at the
417 free surface. For example, the computed PGA at free surface at site2, site114 and site96 using
418 ASA are 2.0, 1.6 and 1.5 times larger than that obtained at free surface based on the wave
419 propagation, respectively (Table 1). In the case of PGA prediction using ASA, the over prediction
420 of the PGA is increasing with the increase of sediment thickness, which is obvious one. So, it may
421 be concluded that basement ground motion should be transferred to the free surface using
422 seismic wave propagation taking into account the rheological parameters and thicknesses of the
423 sediment layers above the basement.
424
425 6. ANALYSIS OF SIMULATED RESULT
426
427 The stochastically simulated acceleration time history at basement level at all the 158 locations
428 in the NCT Delhi using respective MCEs on MF, SF and MDF is used to generate velocity and
429 displacement time histories at the basement level. The performance of low-rise (≤5 story),
430 medium-rise (5-10 story) and high-rise (>10 story) buildings are more sensitive to PGA, PGV and
431 PGD, respectively. Therefore, we have picked-up PGA, PGV and PGD from the acceleration,
432 velocity and displacement time series, respectively for all the sites to develop the contour maps
433 (Table 1). Figures 8-10 show the variation of PGA, PGV and PGD at basement level in the NCT

 13
434 Delhi. The area east and west of the central ridge is mentioned as the eastern and western region
435 of the NCT Delhi in this paper. Further, we have not considered the Himalayan thrusts (distance
436 >225 km) in this study considering that the stochastic method is not appropriate for predicting the
437 ground motion less than 1.0 Hz.
438
439
440
441
442 6.1 Ground motion at basement level
443
444 Figure 8 reveals that the range of PGA variation at basement level is from 0.04g (sites129 and
445 156) to 0.18g (site12, Qutubgarh). Similarly, figures 9&10 show that the range for PGV and PGD
446 variation at basement level is from 2.64 cm/s (site72) to 17.01 cm/s (site13, Qutubgarh) and from
447 0.6 cm (site35) to 5.04 cm (site13, Qutubgarh), respectively. The analysis of figures 8-10 reveals
448 very low values of PGA (
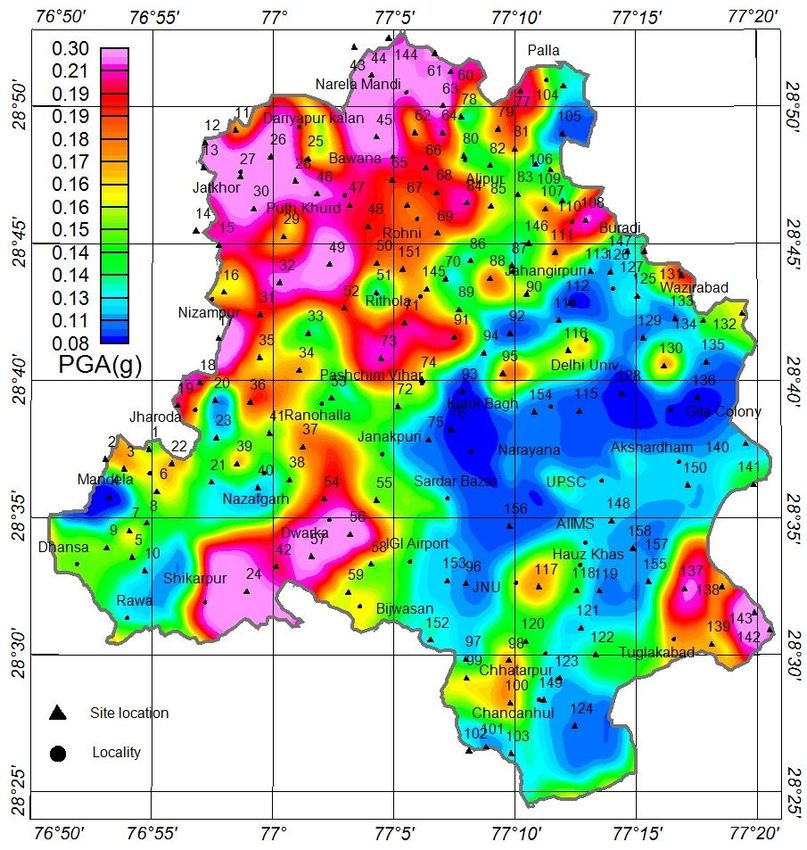
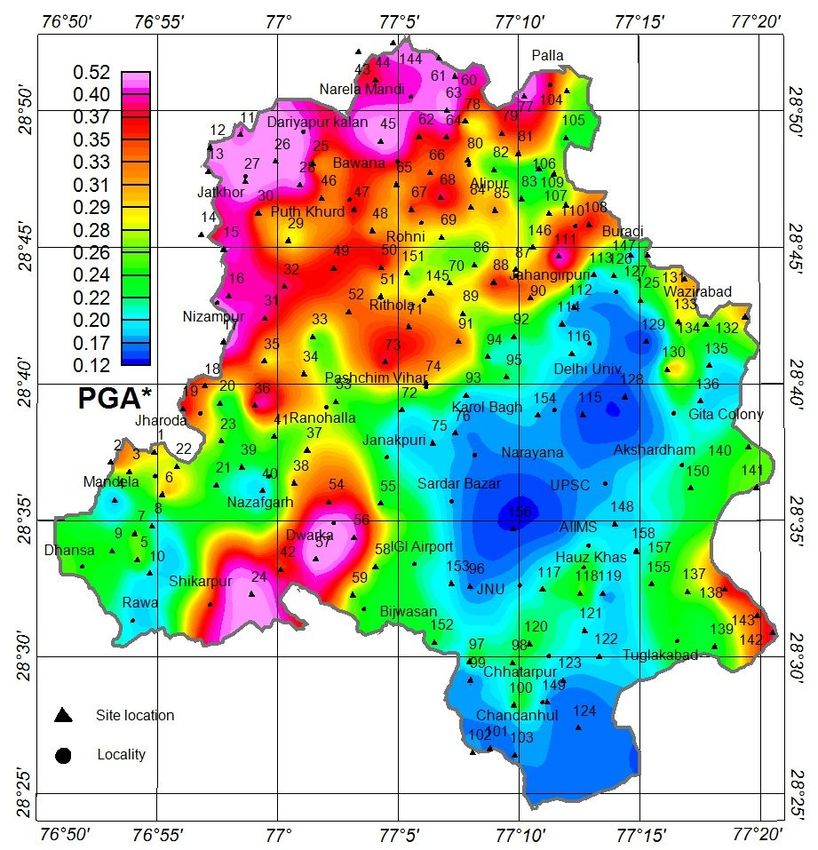
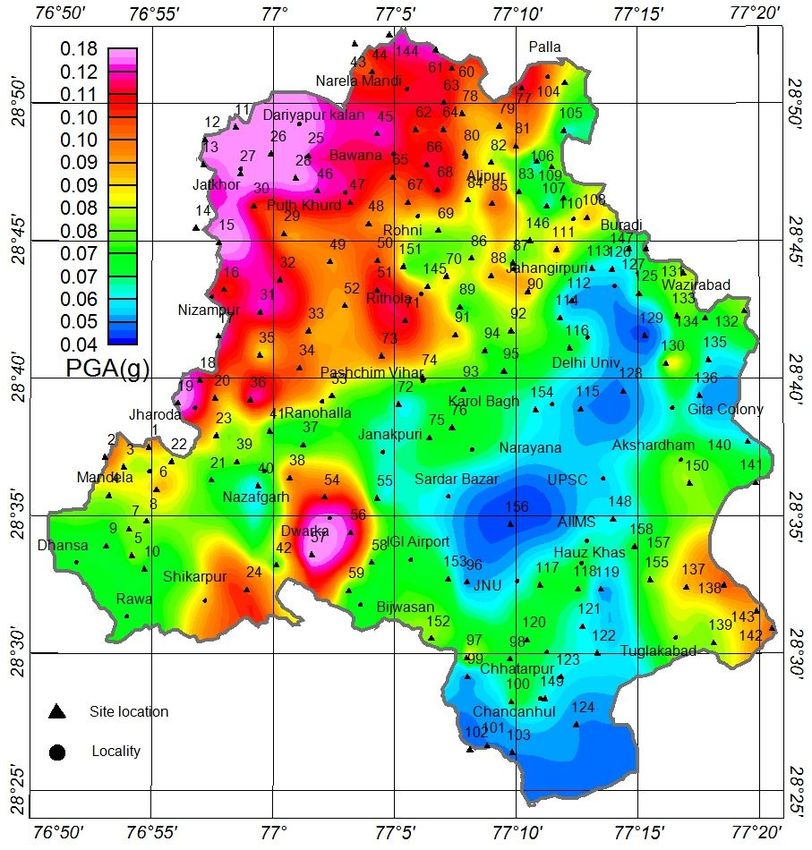
468 We have computed the acceleration and displacement time histories at free surface using the
469 transferred velocity time histories from basement to free surface taking into account the
470 sedimentary deposit. Thereafter, contours maps are developed using the obtained PGA, PGV
471 and PGD from the time histories at different sites on the free surface (Table 1). The computed
472 PGA at the free surface using the multiplication of PGA at the basement level with the average
473 spectral amplification (ASA) of the SH-wave caused by the sediment deposit is denoted as PGA*
474 in this paper (Table 1). The contour maps for PGA, PGA*, PGV and PGD are developed and
475 shown in figures 11-14, respectively.
476
477 a. Peak ground acceleration
478 Figure 11 reveals that the PGA variation at the free surface is in a range 0.08g to 0.3g (Table 1).
479 The lowest PGA of the order of 0.08g is observed in Baqargarh area (site4) and highest PGA of
480 the order of 0.3g is observed in Khorjat area (site27). We obtained lower PGA (
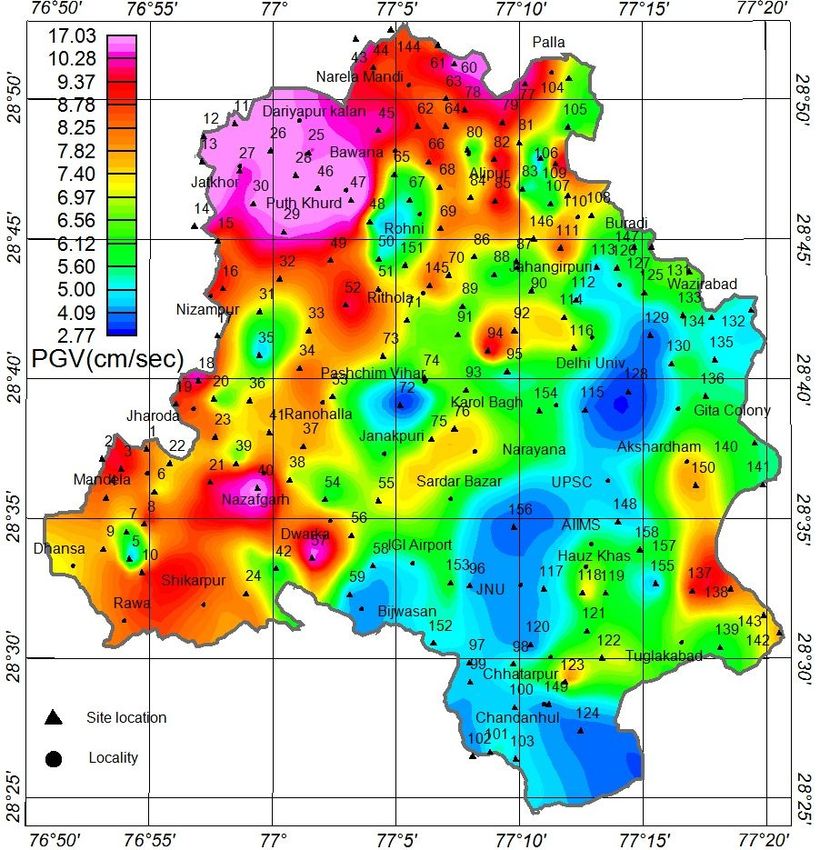
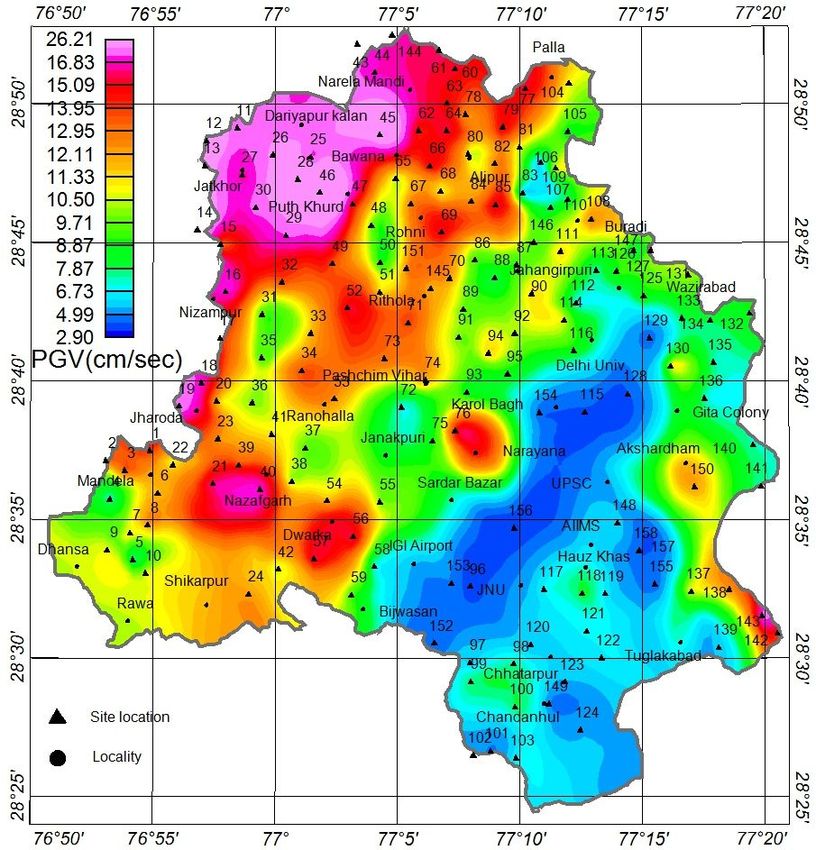
502 transferred to the free surface based on the seismic wave propagation approach and not the just
503 multiplication of ASA with the basement PGA to avoid the over prediction of PGA at the free
504 surface.
505
506
507
508 b. Peak ground velocity
509 Figure 13 depicts the variation of PGV in the NCT Delhi at the free surface. The range for PGV
510 variation is 3.34 cm/s (site156; Rani Khera) to 26.58 cm/s (site46; Sultanpur Dabas). The
511 amplification of PGV at a particular site as compared to that at basement level is highly dependent
512 on the sediment thickness. For example, almost no amplification or minor amplification/de-
513 amplification of PGV was obtained at the sites located on the central ridge area where sediment
514 thickness is less than 30 m (sites156, 96, 129). The PGV amplification of the order of 2.0 was
515 obtained at Sultanpur Debas (site46) and Qutubgarh (site12) where depth of basement is deep.
516 We obtained the lower PGV (≤8 cm/s) at localities from Bhaktawarpur to Wazirabad on the central
517 ridge and surrounding area (sites152, 153, 96, 156, 154, 115, 128, 129). In the eastern region,
518 PGV≥15 cm/s was obtained at site near Jaitpur Police station (site143) and at rest of the sites 8
519 cm/s
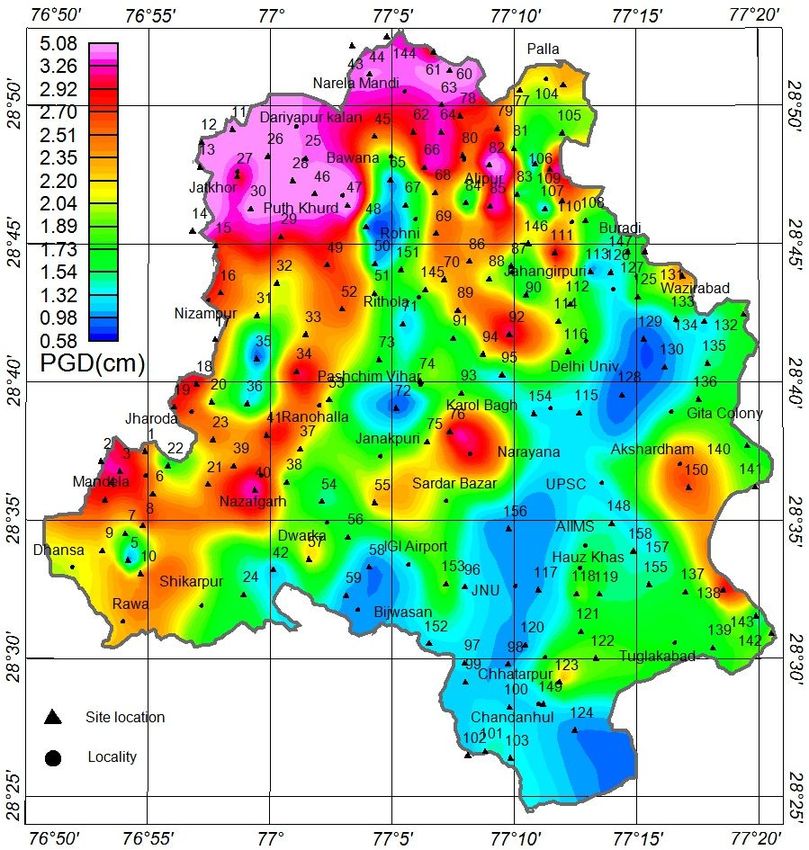
536 obtained very less PGD (
569 as more than 2 Hz at site128 and site129. Under non-double resonance condition, many B-type
570 buildings may suffer with G1 and few G2 grade gamage and few low-rise C-type buildings may
571 suffer with G1 grade damge. However, under double resonance condition, the low-rise B-type
572 buildings may suffer with G3 grade and low-rise C-type buildings may suffer with G2 grade damge.
573 However, the high-rise and medium-rise buildings are safe in this region due to less values of
574 PGV and PGD. However, relatively larger PGA (0.12-0.18g) and PGV (2.0 Hz and under non-double resonance condition, many B-type may suffer with G1-G2 grade
591 and few C-type may suffer with G1 grade damage. However, the B-type and low-rise C-type
592 buildings in these localities may sufer with G2-G3 grade and G2 grade damage, respectively
593 under double resonance condition. On the other hand, the medium-rise buildings in localities
594 falling east of river Yamuna like Gita colony, Gokulpur (site134), Mansarovar Park (site135), Arjun
595 Nagar (site136) and near Ghazipur (site140) may suffer with only G2 grade damage since PGV
596 is less than 8-10 cm/s.
597
598 The range of F0 of sediment deposit in the Chhatarpur basin and nearby semiclosed basin is 1.8
599 - 3.2 Hz and the range of obtained PGA is 0.12g – 0.17g. In the localities like Silampur (site130),
600 Harsh Vihar (site132) and Gazipur (site141), the range of PGA is same but range of F0 of
601 sediment deposit is 1.30 Hz to 1.50 Hz. So, many B-type buildings in these localities may sufer
602 with G2-grade and few with G3-grade damage under non-double resonance condition. Similarly,

 18
603 many C-type low-rise buildings may suffer with G2 grade damage under non-double resonance.
604 However, under double resonance condition B-type and low-rise C-type buildings may suffer with
605 G3-G4 grade and G3-grade damage, respecively. On the other hand, C-type medium-rise
606 buildings in the Silampur (site130), Harsh Vihar (site132) and Gazipur (site141) area may suffer
607 with G2-grade damage double resonance condition since PGV in these localities is less than 10
608 cm/s. No damage reported to the 73 m high Qutab minar (tallest brick masonry minaret in the
609 world; situated near the site98) during past 800 years may be because of the non-occurrence of
610 double resonance and the obtained low value of PGD (0.93 cm) due to the local earthquakes.
611
612 The range of PGA and F0 is 0.22g to 0.27g and 1.22 to to 5.0 Hz in the localities from Jaitpur to
613 Jasola (including Tuglakabad) falling near the MF. The range of PGV is 10 cm/s to 18 cm/s from
614 Jaitpur to Aksherdham (site150) (Fig. 13). So, in the localities falling between Jasola to Jaitpur
615 (sites137, 138, 142, 143), most of the B-type and low-rise C-type buildings may suffer with G3-
616 grade and G2-G3 grade damage under non-double resonance condition. However, under double
617 resonance condition, the grade of damage may be G4-G5 and G3-G4 to the B-type and low-rise
618 C-type buildings, respectively. The medium-rise C-type buildings (5-10 storey) of the localities
619 from Jaitpur to Aksherdham may also suffer with G4 grade damage under double resonance
620 condition since PGV in these localities is relatively larger (10-18 cm/s). However, the high-rise
621 buildings (>10 storey) situated in the eastern part of the NCT Delhi are relately safer during
622 occurrence of local earthquakes since PGD is less than 2 cm amd may suffer with G2-G3 grade
623 damage.
624
625 c. Western region of the NCT Delhi
626 In the left part of the western region of the NCT Delhi, the range for F0 of sediment is 0.41-0.65
627 Hz in a strip more or less parallel to the central Delhi ridge in the localities from south to north
628 Dhansa, Mandela, Nizampur, Jatkhor, Puth Khurd, Dariyapur Kalan, Narela Mandi. Further, at
629 most of the sites falling west of the central ridge have dominant frequency (FD) which is on an
630 average 2-2.5 times larger than the F0 of sediment deposit. It means medium-rise and high-rise
631 buildings may fall in double resonance condition with either F0 or FD. Figures 11, 13 and 14 reveals
632 that in the localities like Nizampur (sites17, 31, 32), Jatkhor (sites14, 15, 30, 27), Puth Khurd
633 (sites28, 29, 46, 47), Dariyapur Kalan (sites11, 12, 25, 26, 45) and Narela Mandi (sites43, 44,
634 144, 60, 61, 62, 63, 65, 66), the range of PGA, PGV and PGD variations are 0.2g-0.3g, 18 cm/s-
635 26 cm/s and 3.0 cm-7.0 cm, respectively. Many B-type buildings may suffer with G3-G4 damage
636 and few may collapse. Under non-double resonance condition, many low-, medium- and high-rise

 19
637 C-type buildings may suffer with G2-G3 grade damage and few with G4-grade damage. However,
638 under double resonance condition, medium-rise and high-rise C-type buildings may suffer with
639 G4-G5 damage. The obtained range of obtained PGA (0.08-0.18g), PGV (8-12 cm/s) and PGD
640 (2-3 cm) in localities like Dhansa (sites6, 8, 9, 10) and Mandela (sites1, 2, 3) and Jharoda (sites18,
641 19, 20) reveals that many B-type and low-rise C-type buildings may suffer with G2-G3 grade and
642 G1-G2 grade damage, respectively. However, under double resonance condition, medium and
643 high-rise C-type buildings may suffer with G2-G3 grade and few G4 grade damage.
644
645 In the middle part of the western region of the NCT Delhi, in a strip more or less parallel to the
646 central ridge, the range for F0 of sediment is 0.65-1.0 Hz in localities from south to north Rawa,
647 Shikarpur, Nazafgarh, Pashchim Vihar, Rithola, Rohni, Alipur and Palla. It means medium and
648 high-rise buildings may fall in double resonance condition with either F0 or FD. The obtained large
649 PGA (0.2-0.3g) due to proximity to SF, many B-type and low-rise C-type buildings may suffer with
650 G3-G4 grade and G2-G3 grade damage, respectively in the localities like Sikarpur (site24).
651 Similar level of damage to medium- and high-rise buildings may occur even under double
652 resonance condition since the values of PGV and PGD are somewhat lower. The obtained PGA
653 (0.16-0.20g), PGV (12-18 cm/s) and PGD (2-4.5 cm) at localities like Paschim Vihar (sites33, 34,
654 71, 73, 52, 91), Rohini to Alipur (sites151, 69, 68, 84, 85), Rithola (site52) and Palla (sites77, 79,
655 82) reveals that most of B-type and low-rise C-type buildings may suffer with G2-G3 grade and
656 G2-grade damage, respectively. Under double resonance condition including Nazafgarh area
657 (sites21, 40), the medium and high-rise C-type buildings may suffer with G3-G4 grade damage.
658 At rest of the sites falling in this middle part of the western region, the damage level to medium-
659 and high-rise C-type buildings may be lesser, even after occurrence of double resonance due to
660 lesser PGA, PGV and PGD, respectively.
661
662 Similarly, the right part of the western region of the NCT Delhi, a strip more or less parallel to the
663 central ridge, the range for F0 of sediment is 1.0 – 1.5 Hz in localities from south to north Bijwasan,
664 IGI Airport, Dwarka, Narayana, Janakpuri, Raja Garden, Jahangirpuri and Buradi. It means
665 medium-rise and low-rise buildings may fall in double resonance condition with either F0 or FD.
666 The obtained larger PGA (0.2-0.3g) in the Dwarka (sites56, 57) and Buradi (sites108, 110, 111)
667 reveals that many B-type and low-rise C-type buildings under non-resonance condition may suffer
668 with G3-G4 grade and G2-G3 grade damage and under double resonance condition may suffer
669 with G4-G5 grade and G3-G4 grade damage. However, under double resonance condition,
670 medium-rise buildings may suffer with similar level of damage (PGV=12-15 cm/s), but high-rise

 20
671 buildings may suffer with lower grade damage since the PGD (2 cm) is lesser. The medium-rise 672 and high-rise C-type buildings in Narela (sites75, 76) may suffer with G4 and G5 grade damage, 673 respectively under double resonance condition due to the larger PGV (17 cm/s) and PGD (7 cm) 674 values. At rest of the localities of the right part of the western region, the obtained lower values of 675 PGA, PGV and PGD reveals that under non-double resonance condition many B-type and C-type 676 may suffer with G2 and G1-grade damage, respectively. However, under double resonance 677 condition many B-type and low- and medium-rise buildings may suffer with G3 and G2-G3 grade 678 damage, respectively. 679 680 8. CONCLUSIONS 681 682 The analysis of computed PGA and PGA* reveals that the basement ground motion should be 683 transferred to the free surface using 1D seismic wave propagation in order to predict the PGA, 684 PGV and PGD and not using simply a multiplication of ASA caused by sediment deposit with the 685 PGA, PGV and PGD at the basement level. The PGA is more amplified at localities where 686 sediment thickness is lesser and reverse is the case for the PGD. The PGA amplification at a site 687 is also depedent on the corresponding MCE and the epicentral distance. The obtained range of 688 the computed PGA, PGV and PGD at the free surface in the NCT Delhi as 0.08g-0.30g, 3.34cm/s- 689 26.58cm/s and 0.55cm-7.2cm, respectively and range of fundamental frequency of the sediment 690 deposit as 0.4Hz-7.0Hz depicts that the NCT Delhi needs special attention by the planners, 691 engineers and decision makers for earthquake disaster preparedness, particularly the occurrence 692 of double resonance phenomenon (Romo and Seed, 1986; Narayan et al., 2002; Kumar and 693 Narayan, 2020). 694 695 The obtained PGA (
705 0.27g) and PGV (10-18 cm/s) in the localities from Jaitpur to Jasola (including Tuglakabad) falling
706 near the Mathura Fault reveals that under double resonance condition the B-type and low- to
707 medium-rise C-type buildings may suffer with G4-G5 grade and G4-grade damage, respectively.
708 However, the high-rise buildings situated in the eastern and central ridge parts of the NCT Delhi
709 are relatively safer during local earthquakes since PGD is less than 2 cm and may suffer with
710 minor damage (G1-G2 grade) only.
711
712 All types of buildings in the NW region of the NCT Delhi are at high seismic risk due to their
713 proximity to the MDF and thick sediment deposit. Under double resonance condition, even well-
714 built medium- to high-rise C-type buildings may suffer with G4-G5 damage. Similarly, buildings
715 located in Sikarpur (site24), Dwarka (sites56, 57), Buradi (sites108, 110, 111) and locality near
716 sites73 and 91 are also somewhat at high risk. The medium- and high-rise buildings in Narela
717 (sites75, 76) and Nazafgarh area (sites21, 40) may suffer with G3-G4 grade damage Under
718 double resonance condition due to the larger PGV and PGD values. At rest of the localities, the
719 obtained lower values of PGA, PGV and PGD reveals that under non-double resonance condition
720 many B-type and low- and medium-rise C-type buildings may suffer with G2 and G1-grade
721 damage, respectively. However, under double resonance condition many B-type and low- and
722 medium-rise buildings may suffer with G3 and G2-G3 grade damage, respectively.
723
724

 22
725 References 726 • Anderson J, Hough S (1984) A model for the shape of the Fourier amplitude spectrum of 727 acceleration at high frequencies. Bull Seism Soc Am 74:1969–1993 728 • Anbazhagan P, Sitharam TG (2008) Seismic microzonation of Bangalore. J Earth Syst Sci 729 117(S2):833–852 730 • Agrawal SK, Chawla J (2006) Seismic hazard assessment for Delhi region. Curr Sci 91:1717– 731 1724 732 • Beresnev IA, Atkinson GM (1997) Modelling finite fault radiation from the n spectrum. Bull 733 Seismol Soc Am 87:67–84 734 • Beresnev IA, Atkinson GM (1998) FINSIM: a FORTRAN program for simulating stochastic 735 acceleration time histories from finite faults. Seismol Res Lett 69:27–32 736 • Boore DM (1983) Stochastic simulation of high-frequency ground motions based on 737 seismological models of the radiated spectra. Bull Seismol Soc Am 73:1865–1894 738 • Boore DM (2003) Simulation of ground motion using stochastic method. Pure Appl. Geophys 739 160:635–676 740 • Boore DM, Atkinson GM (2008) Ground-motion prediction equations for the average 741 horizontal component of PGA, PGV, and 5%-damped PSA at spectral periods between 0.01 742 s and 10.0 s. Earthquake Spectra, Vol. 24, No.1, pp. 99-138. 743 • Boore DM (2009) Comparing stochastic point-source and finite-source ground-motion 744 simulations: SMSIM and EXSIM, Bull. Seismol. Soc. Am. 99, 3202–3216 745 • Brune JN (1970) Tectonic stress and spectra of seismic shear waves from earthquakes. J 746 Geophys Res 75:4997–5009 747 • CGWB (2012) Ground water year book (2011–12). National Capital Territory Delhi, Central 748 Ground Water Board, Ministry of water resources, Govt. of India. 749 • Earthquake Engineering Studies (2012) Site-specific design earthquake parameters for 750 Khurja thermal power plant site, Uttar Pradesh (EQ:2012-39), EQD, IIT Roorkee. 751 • Emmerich H, Korn M (1987) Incorporation of attenuation into time-domain computations of 752 seismic wave fields. Geophysics 52:1252–1264 753 • Futterman WI (1962) Dispersive body waves. Journal of Geophysical Research, 67(13), 754 5279–5291. 755 • GSI (2000) Tectonic and geological maps of India. Geological Survey of India, Calcutta 756 • Gupta SK, Sharda YP (1996) A geotechnical assessment of Delhi earthquake of July 28, 757 1994. Proc. Int. Conf. Dis. Mitin., Madras, v.1, pp. A1/26–/31. 758 • Hanks TC, McGuire RK (1981) The character of high frequency strong ground motion. Bull 759 Seismol Soc Am 71:2071–2095 760 • Hartzell S, Harmsen S, Frankel A, Larsen S (1999) Calculation of broadband time histories 761 of ground motion: Comparison of methods and validation using strong-ground motion from 762 the 1994 Northridge earthquake. Bulletin of the Seismological Society of America, 89(6), 763 1484-1504. 764 • Hukku BM (1966) Probable causes of earthquake in the Delhi-Sonipat area. Proc III Sysmp. 765 Earthquake Engg. Roorkee, v.II, pp.75–80. 23
766 • IS-893 (Part 1) (2002) Criteria for earthquake resistant design of structures—part 1: general
767 provision and buildings, Bureau of Indian Standards
768 • Israeli M, Orszag SA (1981) Approximation of radiation boundary conditions. J Comp Phys
769 41:115–135
770 • Iyisan R (1996) Correlations between shear wave velocity and in situ penetration test results
771 (in Turkish). Chamb Civil Eng Turk, Teknik Dergi 7(2):1187–1199
772 • Iyengar RN (2000) Seismic status of Delhi megacity. Curr Sci 78(5):568–574
773 • Iyengar RN, Ghosh S (2004) Microzonation of earthquake hazard in greater Delhi area. Curr
774 Sci87(9):1193–1202
775 • Jayalakshmi S, Raghukanth STG (2016) Regional ground motion simulation around Delhi
776 due to future large earthquake. Nat Hazards (2016) 82:1479–1513, DOI 10.1007/s11069-
777 016-2254-8
778 • Kazim M K, Rajinder Kumar, Hemant Kumar, A. K. Gupta, J. Bagchi and S.S Srivastava
779 (2005) A field investigation of geological and geomorphological mapping of NCT Delhi on
780 1:10,000 scale. Contributed by Geological survey of India, Northern Region. item code No.
781 STM/C/NR/PHH/2005/002.
782 • Kristeck J, Moczo P (2003) Seismic wave propagation in viscoelastic media with material
783 disconuties- a 3 D 4th order staggered grid finite difference modeling. Bull Seismol Soc Am
784 93:2273–2280.
785 • Kumar, N. and Narayan, J.P., 2018. Quantification of site–city interaction effects on the
786 response of structure under double resonance condition. Geophysical Journal International,
787 212(1), pp.422-441.
788 • Kumar, S. and Narayan, J.P., 2008. Absorbing boundary conditions in a fourth-order accurate
789 SH-wave staggered grid finite difference algorithm. Acta Geophysica, 56(4), pp.1090-1108.
790 • Kumar L, Narayan JP (2020) Computation of Ground Motion Amplification Scenario in NCT
791 Delhi for Earthquake Engineering Purposes and Seismic Microzonation. Pure Appl Geophys
792 177:3797–3829. https://doi.org/10.1007/s00024-020-02420-4
793 • Mandal, H S, Khan PK, Shukla AK (2014) Soil responses near Delhi ridge and adjacent
794 regions in Greater Delhi during incidence of a local earthquake. Natural Hazards, 70(1), 93–
795 118.
796 • Manisha KD, Teotia SS (2011) Seismic hazard based on simulated accelerograms due to
797 moderate/strongearthquakes in National Capital (Delhi) region. J Ind Geophys Union
798 15(1):77–83
799 • Mahajan, AK, Shukla AK, Pandey A, Chauhan M, Chauhan N, Rai N (2011) Shear wave
800 velocity investigation for ten representative sites of national capital territory, New Delhi, India.
801 International Journal of Geotechnical Earthquake Engineering (IJGEE), 2(1), 29–43.
802 • Mehta P, Hukku BM, Krishnaswamy VS (1970) Geoseismological studies for the aseismic
803 design of the Kot and Dhauj Dam project, Gurgaon district, Haryana. Proc. Earthq. Engg.
804 Roorkee, v.IV, pp.411–418.
805 • Mohanty, WK, Walling MY, Nath SK, Pal I (2007) First order seismic microzonation of Delhi,
806 India using geographic information system (GIS). Natural Hazards, 40(2), 245-260.

 24
807 • Mohanty WK, Prakash R, Suresh G, Shukla AK, Yanger Walling M, Srivastava JP (2009)
808 Estimation of coda wave attenuation for the National Capital Region, Delhi, India using local
809 earthquakes. Pure appl Geophys 166:429–449
810 • Mittal H (2011). Estimation of ground motion in Delhi, Ph.D. Thesis, Indian Institute of
811 Technology Roorkee, India.
812 • Mittal H, Kumar A, Kumar A (2013) Site effects estimation in Delhi from the Indian strong
813 motion instrumentation network. Seismol Res Lett 84(1):33–41
814 • Mittal H., Yih-Min Wu, Da-Yi Chen, Wei-An Chao (2016) Stochastic finite modeling of ground
815 motion for March 5, 2012, Mw 4.6 earthquake and scenario greater magnitude earthquake in
816 the proximity of Delhi, Nat Hazards (2016) 82:1123–1146 DOI 10.1007/s11069-016-2236-x
817 • Motazedian D, Atkinson GM (2005) Stochastic finite-fault modeling based on dynamic corner
818 frequency. Bull Seismol Soc Am 95:995–1010
819 • Mukhopadhyay S, Pandey Y, Dharmaraju R, Chauhan PKS, Singh P, Dev A (2002) Seismic
820 microzonation of Delhi for ground-shaking site effects. Curr Sci 87:877–881
821 • Mundepi AK, Mahajan AK (2010) Site response evolution and sediment mapping using
822 horizontal to vertical spectral ratios (HVSR) of ground ambient noise in Jammu city, NW India.
823 J GSI 75:799–806
824 • Narayan JP, Sharma ML, Kumar A (2002) A seismological report on the 26 January 2001
825 Bhuj, India earthquake. Seism Res Lett 73:343–355
826 • Narayan JP, Kumar S (2008) A 4th order accurate SH-wave staggered grid finite-difference
827 algorithm with variable grid size and VGR-stress imaging technique. Pure Appl Geophys
828 165:271–294
829 • Narayan JP, Kumar V (2013) A fourth-order accurate finite-difference program for the
830 simulation of SH-wave propagation in heterogeneous viscoelastic médium. Geofizika
831 30:173–189
832 • Narayan JP, Sahar D (2014) 3D viscoelastic finite-difference code and modelling of basement
833 focusing effects on ground motion characteristics. Comput Geosci 18:1023–1047
834 • Nath SK, Sengupta P, Srivastav SK, Bhattacharya SN, Dattatrayam RS, Prakash R, Gupta
835 HV (2003) Estimation of S-wave site response in and around Delhi region from weak motion
836 data. Proc Indian Acad Sci (Earth Plant Sci) 112:441–463
837 • NCS-MoES. (2016) A report on seismic hazard microzonation of NCT Delhi on 1:10,000
838 scale. National Center for Seismology, Ministry of Earth Sciences, Government of India.
839 • NDMA (2011) Development of probabilistic seismic hazard map of India. National Disaster
840 Management Authority, New Delhi, India
841 • Neelima Satyam D, Rao KS (2009) Estimation of Peak Ground Acceleration for Delhi NCR
842 Using FINSIM, a Finite Fault Simulation Technique. 02:215–223
843 • Oprsal I, Fah D, Mai PM, Giardini D (2005) Deterministic earthquake scenario for the Basel
844 area: simulatingstrong motion and site effects for Basel, Switzerland. JGR 110:B4305.
845 doi:10.1029/2004JB003188
846 • Parvez IA, Vaccari F, Panza, GF (2004) Site-specific microzonation study in Delhi
847 metropolitan city by 2-D modeling of SH and P-SV waves. Pure and Applied Geophysics,
848 161,1165–1184. https://doi.org/10.1007/s00024-003-2501-2.

 25
You can also read