LIMNOLOGY OCEANOGRAPHY: METHODS
←
→
Page content transcription
If your browser does not render page correctly, please read the page content below
LIMNOLOGY
      and
OCEANOGRAPHY: METHODS                                                                                                       Limnol. Oceanogr.: Methods 7, 2009, 490–497
                                                                                                  © 2009, by the American Society of Limnology and Oceanography, Inc.

Surface adhesion measurements in aquatic biofilms using
magnetic particle induction: MagPI
Fredrik Larson,1,2 Helen Lubarsky,1 Sabine U. Gerbersdorf,1,3 David M. Paterson1*
1
 Sediment Ecology Research Group, Scottish Oceans Institute, University of St Andrews, East Sands, St Andrews, Fife, Scotland, UK
2
 Present address: Swedish Board of Fisheries, Research Office, Göteborg, Sweden
3
 Present address: Institute of Hydraulic Engineering, Universität Stuttgart, Pfaffenwaldring, Stuttgart, Germany

          Abstract
             Natural sediment stability is a product of interacting physical and biological factors, and whereas stability
          can be measured, few techniques allow sensitive assessment of the sediment surface as conditions change. For
          example, stability gradually increases as a biofilm develops or as salinity rises, or it might be influenced by toxic
          compounds. This article introduces a new technique (magnetic particle induction: MagPI) based on the mag-
          netic attraction of specially produced fluorescent ferrous particles. The test particles are added to a surface and
          subjected to an incrementally increasing magnetic field produced by permanent magnets or electromagnets.
          There is a strong correlation between magnetic flux density (mTesla) and distance from the surface (r2 = 0.99)
          for permanent magnets and between magnetic flux density and the current supplied to an electromagnet (r2 >
          0.95). The magnetic force at which the particles are recaptured is determined as a measure of surface adhesion.
          MagPI therefore determines the “stickiness” of the surface, whether a biofilm, sediment, or other material. The
          average magnetic flux density required to remove test particles from diatom biofilms (15.5 mTesla) was signifi-
          cantly greater than from cyanobacterial biofilms (10 mTesla). Controls of fine glass beads showed little adhe-
          sion (2.2 mTesla). Surface adhesion is an important bed property reflecting the sediment system’s potential to
          capture and retain new particles and accumulate material. MagPI offers a straightforward and economic way to
          determine the surface adhesion of a variety of surfaces rapidly and with precision. The technique may have
          applications in physical, environmental, and biomedical research.

                                                                                    Introduction

                                                                                        Biofilms are close to omnipresent in benthic aquatic sys-
*Corresponding author: E-mail: *dp1@st-andrews.ac.uk                                tems and important in many scientific disciplines including
Acknowledgments                                                                     medical research (Guo et al. 2008, Jain et al. 2007, Morton et
    The concept of using ferrous test particles and magnetism for mea-              al. 1998), wastewater treatment (Liu and Fang 2003, Raszka et
surements of biofilm adhesion was developed by Prof. David M.                       al. 2006), toxicant removal (Sheng et al. 2008), and biotech-
Paterson while working under the auspices of RIBS (Research Initiative
                                                                                    nology (Flemming and Wingender 2001, Sutherland et al.
on Bahamian Stromatolites) funded by the National Science Foundation,
USA. This is publication no. 52 of RIBS. Test particles were supplied               1998). Considerable interest has focused on the importance of
through Partrac, UK (http://www.partrac.com/content/01_home.php),                   biofilms for increasing sediment stability through the
and their help in developing the materials is gratefully acknowledged.              mechanical effects of the microbially produced matrix of
Funding for the postdoctoral scholarship to F. Larson was received from             extracellular polymeric substances (EPS, reviewed in Stal 2003,
the Swedish Research Council for Environment, Agricultural Sciences
                                                                                    Underwood and Paterson 2003). Sediment stability is a gov-
and Spatial Planning (Formas) and from the Nordström foundation
through the Royal Swedish Academy of Sciences. H. Lubarsky was fund-                erning factor in sediment management, because sediment
ed by an EU research training network (MRTN-CT-2006-035695); S. U.                  transport and the release of associated contaminants have
Gerbersdorf was funded by a Marie Curie Intra-European Fellowship                   important consequences for the ecological and commercial
(European Commission, FP6, Project BioMech). We thank G. Lubarsky                   health of aquatic habitats from the watershed to the sea (Först-
and L. Kirk at the department of Physics and Astronomy at the
                                                                                    ner et al. 2004, Paterson et al. 2000). To assess the potential
University of St Andrews and M. Chocholek of Geosciences, St Andrews,
UK, for valuable input and assistance with the magnet tests and calibra-            sediment erosion risk under hydrodynamic forcing, several
tions; also Dr. Alan Decho (University of South Carolina) for his kind per-         devices have been developed to determine the critical erosion
mission to use the confocal images.                                                 threshold (τcrit) for sediment transport and the erosion rates (ε)

                                                                              490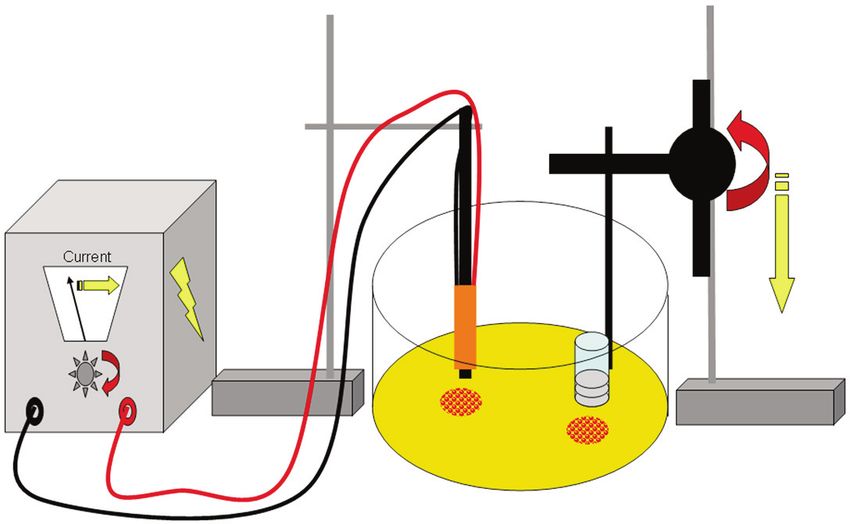
Larson et al.                                                                                                  Magnetic particle induction: MagPI

of natural sediments. The critical erosion threshold is often an           gained in different devices/experiments/laboratories. The rel-
operational threshold defined by the characteristics of the cho-           ative merits and the use of the two types of magnets (field,
sen device rather than the actual theoretical point of incipient           laboratory) are discussed.
sediment motion (Tolhurst et al. 2000). This is partly because
erosion devices are based on many different approaches includ-             Materials and procedures
ing water flow (e.g., Sedflume, McNeil et al. 1996; SETEG, Kern               A list of materials for construction of the MagPI device is
et al. 1999), water jets (CSM, Paterson 1989), oscillation of a            given in the web appendix to this manuscript.
horizontal grid (Tsai and Lick 1986), a propeller (EROMES,                    Magnetic particle induction
Schuenemann and Kuehl 1991), or combined suction and flow                     Permanent neodymium magnets: After extensive testing of
(Gust-Microcosm, Gust and Mueller 1997).                                   a variety of permanent magnets, neodymium alloy (NdFe3B)
    Although these methods all provide important information               disc magnets were chosen for their superior magnetic
on the erosional behavior of the sediment, they all require                strength, Nd being the most magnetic element found on earth
that bed failure occurs and therefore cannot measure any                   (Coey 1995, Lebech et al. 1975). The Nd disc magnets (20 × 5
changes in surface properties below the point of incipient ero-            mm; e-magnets) were applied either individually or as a stack
sion. This restricts their use and, because depositional beds              of up to five, depending on strength requirements. Adding
must usually resist erosion to exist, leaves a large gap in our            any more than five disc magnets did not increase the active
knowledge; consequently more sensitive methods are needed.                 magnetic field interacting with the test surface. The force from
MagPI measures a different property of the sediment surface                the permanent magnets acting on the surface was regulated
and thus does not replace erosion devices, but rather provides             using decreasing distance to the bed controlled by an
a framework for a sensitive analysis of surface adhesive capac-            adjustable vernier-scaled manipulator (Fig. 1).
ity, a useful addition to the properties of the bed that can be               Electromagnets: The electromagnets were controlled by a
determined.                                                                precision power supply to allow fine and precise variation of
    The use of magnetism in various forms of bacterial biofilm             voltage and current (Rapid 5000 variable power supply) (Fig.
research is widespread. Magnetic resonance imaging (MRI) has               1). A wide range of commercially available electromagnets was
been used to visualize structure and detachment of biofilms                tested, but none showed the required functionality. The most
(Manz et al. 2005, McLean et al. 2008), and surface biomag-                common problems of commercial magnets were either their
netism has been used to change cell adhesion and protein                   size (obscuring the test surface) or insufficient strength to
secretion (Chua and Yeo 2005). Immobilization of magnetic                  retract the test particles from different surfaces. Thus, purpose-
particles by aggregates of pathogenic bacteria has been used to            made electromagnets were constructed by using metal cores of
assess biofilm formation in microtiter plates (Chavant et al.              ferrous alloy coiled with insulated copper thread. To increase
2007). The new MagPI approach is based on the finding that                 the overall range of the magnetic field, two magnets were con-
the force needed to retrieve magnetic particles from a biofilm             structed covering a complementary range of magnetic forces.
is a sensitive indicator of retentive ability or adhesive capacity         The magnets had metal cores of 10 and 5 mm diameters and
of the substratum and a proxy for sediment “stability.” MagPI
may also prove to be a possible index for other well-known
features of a biofilm, such as potential to capture particulate-
associated pollutants, binding of nutrients, or incorporation
of deposited sediment particles, although this will require
more research.
    For the methodology presented here, two types of magnets
were used: permanent magnets and electromagnets. In both
cases, a defined volume of magnetic particles (of known size
range and density) were spread in a single layer onto a
defined area of the submerged sediment surface, and the force
of the overlying magnet was increased until the particles were
recaptured. The magnetic force was gradually enhanced by
either reducing the distance between the magnet and the test
particles (permanent magnet) or increasing the electrical cur-
rent to a variable magnet statically positioned 5–10 mm
above the sediment (electromagnet). The sensitivity of this                Fig. 1. Schematic diagram of the two variants of MagPI: electromagnetic
method has been illustrated by data presented for developing               version (left) with a variable current supply and permanent disc magnets
                                                                           (right) using decreasing distance to surface. In each case, fluorescent fer-
microalgal (diatoms and cyanobacteria) biofilms. The mag-                  rous particles are added to the sediment surface. The current input or the
netic devices were found to be economically viable and easy                distance from the surface is recorded in each case, respectively, as the par-
to build, and the gauss meter enables comparison of results                ticles respond.

                                                                     491
Larson et al. Magnetic particle induction: MagPI
were each coiled with 500 turns of copper thread with a diam- small number of particles (around 5) are attracted to the mag-
eter of 0.4 and 0.2 mm, respectively. The coil covered 60 mm net; (D) total removal of particles under the magnet. The third
of the core on both magnets. The full coil resistance of the level is subjective and less reliable for a defined measurement.
larger electromagnet was 3.5 Ω, and it was limited to an input If the test surface is intended for repeated measurements, any
range of 0–12 V (0–0.3.4 A). The smaller magnet had a coil stray particles deposited outside the test area should be
resistance of 2.4 Ω and was limited to an input range of 0–20 cleaned from the surface with a permanent magnet to prevent
V (0-8.3 A). Exceeding these limits burnt the coils, since above compromising subsequent measurements.
this level of supply increased current was dissipated as heat Magnetic force equations: The attractive magnetic force (F)
owing to electrical resistance. of a magnet depends on the MFD and can be calculated
Ferrous test particles: The test particles consisted of an amal- according to:
gam of ferrous material to provide a magnetic response, mixed
B2 A
with fluorescent pigment to increase their visibility (Fig. 2). An F= (1)
inert transparent binding agent combines the material into a 2μ 0
solid, which is then ground to produce a particle spectrum where B is the MFD, A is the area of the magnet poles (in this
(Partrac). The test particles were then sieved into different size case, the area of permanent magnet or electromagnet that
classes. The size range selected for the trials was 180–250 µm, faces the surface), and µ0 is the permeability of the free space
similar to fine/medium beach sand. The particles have to be (Breithaupt 1999), which is a constant during measurements
applied to the test surface in a consistent manner to allow in the same medium.
repeatable measurements. To achieve a relatively even single The magnetic force (F) that an electromagnet can produce
layer of particles on the test surface took some practice but was at the pole surface is calculated according to:
achieved with experience. The test particles were suspended in
μ 2 N 2I 2 A
water, and the mixture was drawn into a plastic pipette. The F= (2)
suspended particles were allowed to settle toward the tip of the 2μ 0 L2
pipette before being ejected as a single drop in the media above where µ is the permeability of the core material, N is the num-
the test surface. A cutoff 2 mL syringe, submerged into the ber of thread turns in the coil, I is the current, and L is the full
water and held a short distance above the test surface, served length of the thread used in the coil (Breithaupt 1999). Conse-
as a guide to confine the particles to the selected test area. quently, the magnetic force (F) can be controlled by varying the
Calibrations: To calibrate the device, the magnets were current (I) while all other factors are held constant.
placed over a Hall sensor connected to a gauss meter (Unilab). Precision and statistics: The precision of the method was
The permanent magnets were lowered toward the probe in tested through repeated calibrations (n = 25). Based on 95%
incremental steps (1 mm), and the magnetic flux density confidence intervals, an average precision of 0.1% for the elec-
(MFD) in mTesla was recorded for each step. For the electro- tromagnet measurements was determined (±0.22% in the low
magnets, the voltage and current were increased in small incre- current range, ±0.035%, in the mid-current range and
ments (0.2 V/≈0.05 A), and the MFD for each increase was ±0.045% in the high current range). The use of a different elec-
recorded. The Hall sensor calibrations were performed in air as tromagnet and/or other power source requires a separate pre-
well as submerged in water using a waterproof sensor. Calibra- cision test to be conducted, but as long as a suitably sensitive
tions were performed both before and after each experiment. power supply is used, a similar range could be expected. Data
During the experiment, the resistance of electromagnets was were assessed for normality and homogeneity of variance, and
regularly checked. A decrease in coil resistance would be evi- a one-way ANOVA was applied (significance level α = 0.05)
dence of a fault that results in a loss of magnetic field strength. and post-hoc test (Tukey) to determine differences in surface
Measuring procedure: The magnetic measurements were adhesion between varying surfaces and biofilm compositions.
initiated immediately after the application of the particles. Calibration results: There were strong linear relationships
The magnet was lowered into position a set distance above the (r2 = 0.996–0.997) between current (I) and MFD (mTesla) for
test surface. The distance to the test surface is critical; to the electromagnets. The relationship between distance and
ensure correct placement, a small guide rod (glass or plastic, magnetic field strength of the permanent magnets was expo-
not metal) was attached to the end of the magnet to set the nential (Fig. 3). In contrast to the electromagnets, the perma-
distance to the surface consistently (usually 10 mm). The mag- nent magnets have to be moved toward the surface during the
net was lowered until the tip of the guide just contacted the measurement to increase F. Consequently, the area of the
test surface. This could be checked by use of a magnifying magnetic field that interacts with the surface increases with
glass (in the field) or binocular microscope (in the laboratory). decreasing distance, and this corresponds to a nonlinear
The magnetic field was increased in increments, and four increase of field strength (Fig. 3A). The line of best fit for the
thresholds/levels of particle response were noted: (A) the par- calibration of the permanent magnet strength versus distance
ticles show initial orientation (alignment) along the magnetic required a sixth-order polynomial as opposed to the linear
field; (B) the first particle is attracted to the magnet; (C) a function used for the electromagnet calibration (Fig. 3B).
492Larson et al. Magnetic particle induction: MagPI
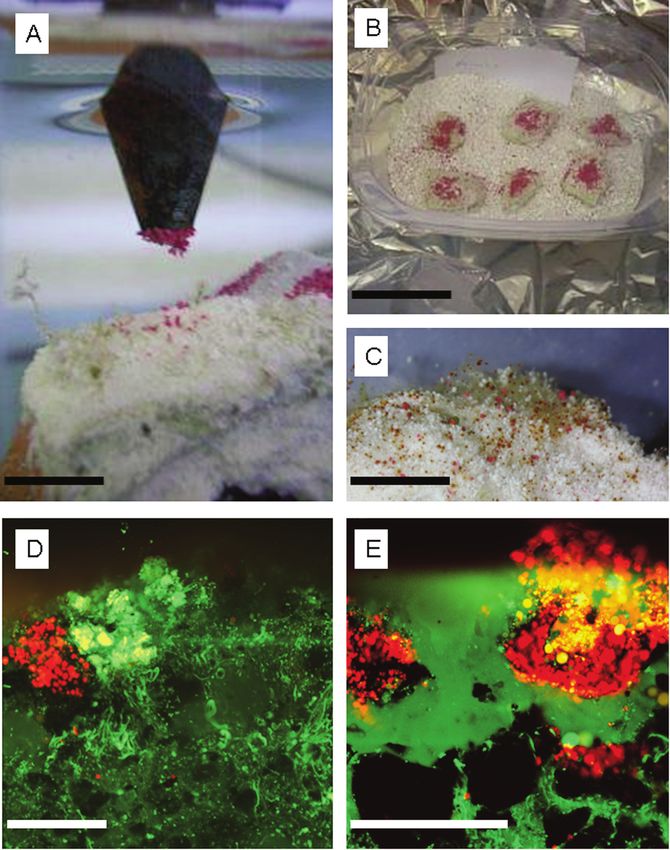
Fig. 2. (A) Prototype of MagPI placed above the surface of a sample of intertidal microbial sediment (stromatolite) during NSF RIBS (see Acknowledg-
ments). Test particles can be seen adhering to the magnet. (B) Sample of stromatolite prepared for MagPI measurement. (C) Detail of surface showing
fluorescent particles among stalked diatoms on one region of stromatolite. (D and E) Confocal microscopy of fluorescent beads on the stromatolite sur-
face becoming incorporated into the biofilm. The green coloration represents organic material and the red fluorescence represents the test particles.
Note that the test particles are approximately 125–150 µm across in this example. (Bar markers: A, 1 cm; B, 5 cm; C, 5 mm; D, 150 µm; C, 150 µm).
Confocal images supplied by Dr. A. Decho.
493Larson et al. Magnetic particle induction: MagPI
Threshold conditions—In terms of the thresholds of test par-
ticle response to magnetic force, the total clearance (D) was
the preferred measure. First, this threshold is the least subjec-
tive, and the data gained by different people are almost iden-
tical; second, this threshold showed significant differences
between treatments that were not always obvious using the
other three thresholds (Fig. 4). Under laboratory conditions,
where more sophisticated observation using microscopy of
the particles is possible, the first and second threshold can be
used as an alternative and/or complementary value. In general
terms, we recommend recording all thresholds if possible, as
each may indicate a slightly different property of the surface.
Assessment
Abiotic particulate surfaces—The force required to recapture
the test particles (size 180–250 µm) from various substrata are
given in Fig. 5. Measurements indicated differences between
seawater and freshwater conditions. Under seawater, it was
more difficult to capture test particles from the bed composed
of larger glass beads than from the smaller glass beads, fol-
lowed by mud, and then the cleaned sand (Fig. 5A). Under
freshwater conditions, the magnetic force needed to retrieve
the test particles was similar for all surfaces except the larger
glass beads, which showed a significantly higher retentive
capacity (Fig. 5B).
For the sand, similar forces were needed to retrieve particles
in seawater and freshwater, but relatively greater force had to
Fig. 3. Examples of calibration curves for the permanent (A) and elec- be applied in seawater to recapture particles from the other
tromagnetic (B) devices. (A) An exponential increase in force as the per- substrata (compare Fig. 5A and B). This is probably due to the
manent magnet approaches the surface. (B) The strong linear relationship
ionic nature of seawater increasing the potential for electro-
between magnetic force and supplied current for the electromagnet as
the current was gradually increased. Open triangles, magnet stationed 5 static and other physicochemical attractions between particles
mm from the surface; open diamonds, magnet stationed 10 mm from the (e.g., mud with silt and clay content known for their surface
surface. charge variation). This could imply that the ionic milieu facil-
itates the cohesion of the surface as measured by MagPI. How-
Abiotic particulate surfaces—Substrata of different types and ever, increased binding capacity was also noted in freshwater
particle sizes were tested during the pilot studies: two size frac- from the larger glass bead substratum. This may be because
tions of clean glass beads (150 µm Ballotini beads), the magnetic particles become physically trapped in the pore
as well as sand and mud that had been baked to remove organic spaces between the larger glass beads. However, both the
material. These substrata were submerged in both seawater and smaller and larger glass beads showed enhanced surface cohe-
freshwater to take into account any ionic interactions. sion in seawater as opposed to freshwater, which suggests both
Biofilm surface testing—The influence of biotic surfaces was mechanisms may be responsible for the binding capacity of
examined using cultured biofilms of benthic cyanobacteria the larger glass beads.
(dominated by Oscillatoria sp.) and pennate diatoms (domi- Biotic experiment example—The biotic test experiments
nated by Nitzschia sp.). Both cultures were grown on clean revealed that the biofilms developed by benthic diatoms
glass beads (Larson et al. Magnetic particle induction: MagPI
Fig. 4. The thresholds used in the magnetic measurements: (A) particle Fig. 6. Biotic example with cultured biofilms grown with diatoms and
orientation to magnetic field; (B) first magnetic particle captured by the cyanobacteria. The cyanobacterial biofilm had a lower surface adhesion
magnet; (C) larger groups of particles attracted; (D) total clearance of than the diatom biofilm. The threshold reported is the strength of the
particles under the magnet. Three treatments are given as examples: magnetic field needed to provide total clearance of particles under the
small glass beads submerged in seawater (SW) and freshwater (FW) and magnet (n = 6, ± SE). *Significant difference between experimental
large glass beads in SW using test particles of size range 180–250 µm. (n groups by ANOVA, α = 0.05, and Tukey test.
= 6. ± SE).
marker (nonmetallic) fitted at the tip of the electromagnet
helps to ensure positional accuracy between measurements.
Permanent magnets are recommended for measurements in
the field (e.g., tidal flats) because of the logistical ease for field
use. The permanent magnets still produce an accurate and sta-
ble force at each set distance, although the precise manipula-
tion of the distance between the magnet and the test surface
is critical. To ensure correct initial placement, a small guide
rod (glass or plastic, not metal) was used to set the magnet the
desired initial distance from the surface (cf. 2 cm). The vernier
scale (±100 µm) was then used to move the magnet in small
incremental steps, and the results were recorded. The test sur-
face must be reasonably flat, and the magnet face must be set
parallel to the surface.
Fig. 5. Tests on abiotic particulate beds of different materials in seawa-
ter (A) and freshwater (B) to attract test particles (180–250 µm) by MagPI Ferrous test particles—The choice of the size of the test par-
(n = 6, ± SE). *Significant difference between adjacent groups by ANOVA, ticles is an important decision. It is sensible to select a size
α = 0.05, and Tukey test. range of particles that does not deviate too much from the test
Discussion sediment, preferably being slightly larger to prevent trapping
in surface pore space. Although this type of trapping may not
Application and replication of the method—The equipment be an issue on surfaces where biofilm has developed, the test
required for the method described here is simple and afford- particle size is also important for the ease of observation on
able (Figs. 1 and 2). Production of suitable electromagnets, the surface. It is also sensible to use a narrow size range of test
however, does demand some technical understanding to particles, to enhance the uniformity of the particle interac-
achieve the acquired magnetic strength. tions with the surfaces.
In the laboratory, electromagnets were preferred over per- Another variable is the incubation time, or period that par-
manent magnets because of the accuracy of their calibration ticles are left on the test surface before performing the mea-
and ease of deployment. Depending on the design and power surement. Because this depends on the characteristics of the
source, electromagnets offer the possibility to increase the investigated surface as well as on the objectives of a particular
magnetic force in small steps, thus offering a high resolution study, it should be decided by the operator on the basis of the
within the applied magnetic strength range. A fixed distance question to be addressed in each experiment. The simplest
495Larson et al. Magnetic particle induction: MagPI
way to ensure a repeatable measure of the test surface is to established erosion devices, MagPI can determine small
retract particles directly after their addition, and the most changes in surface properties below the point of incipient ero-
appropriate value of the surfaces’ “stickiness” can be gained sion with high sensitivity, high accuracy, and high repeatabil-
directly after adding the particles. When particles are left for a ity. The calibration by the gauss meter makes possible the
longer time, they will be partly or fully incorporated in the comparison of the data between different experiments and
biofilm, and the measured variable becomes a combination of various laboratories, which is an important prerequisite for
the adhesion of the surface and the capacity to entrap parti- future success in biofilm research. Two types of magnets have
cles by biofilm development (Fig. 2E). However, we can envis- been examined here: the high-power permanent magnet for
age experiments (and have begun to conduct them) where increased mobility and application in the field and the elec-
particles are added and time after addition is an important tromagnet, which is to be preferred in the laboratory due to a
variable of interest. higher accuracy in calibration and measurement. The tech-
nique presented here is likely to have future applications in
Comments and recommendations environmental, medical, and biotechnological research.
Advantages and limitations—A great advantage of MagPI is
the ability to measure biofilm adhesion, a variable that has References
rarely been considered, but is at the same time of great signif- Andersen, T. J., J. Fredsoe, and M. Pejrup. 2007. In situ esti-
icance for binding pollutants, trapping nutrients, enhancing mation of erosion and deposition thresholds by acoustic
sediment stability, and capturing new deposited particles. For Doppler velocimeter (ADV). Estuar. Coast. Shelf Sci. 75:327-
instance, the ecosystem service (Paterson et al. 2008) of parti- 336.
cle capture and retention is of great importance to sediment Breithaupt, J. 1999. Magnetic fields, p. 251-263. In J. Brei-
systems in balancing the replacement of material lost by tidal thaupt, Physics. New York: MacMillan Publishers Ltd.
erosion (Verney et al. 2006) or wave action (Andersen et al. Chavant, P., B. Gaillard-Martinie, R. Talon, M. Hebraud, and T.
2007), enhancing the nutrient status (Freeman and Lock 1995) Bernardi. 2007. A new device for rapid evaluation of
and offering binding sites for pollutants (Ghosh et al. 2003). biofilm formation potential by bacteria. J. Microbiol. Meth-
This biofilm adhesion can be measured with high sensitivity, ods 68:605-612.
and small changes in developing biofilms can be demon- Chua, L. Y., and S. H. Yeo. 2005. Surface bio-magnetism on
strated that would be unnoticed using established erosion bacterial cells adhesion and surface proteins secretion. Col-
devices. MagPI comes at comparatively low cost, and with loids Surf. B Biointerfaces 40:45-49.
basic practical skills and technical understanding it is compar- Coey, J. M. D. 1995. Rare-earth magnets. Endeavour 19:146-
atively easy to build and use. 151.
Although the permanent magnet is valuable for the use in Flemming, H. C., and J. Wingender. 2001. Relevance of micro-
the field, MagPI cannot easily be used if a wet biofilm is not bial extracellular polymeric substances (EPSs). Part II: Tech-
submerged, such as during tidal emersion periods. The mea- nical aspects. Water Sci. Technol. 43:9-16.
surements have to be performed underwater by the help of a Freeman, C., and M. A. Lock. 1995. The biofilm polysaccha-
water-filled chamber, otherwise the magnetic particles interact ride matrix: a buffer against changing organic substrate
with the surface tension of the water-film and these forces supply. Limnol. Oceanogr. 40:273-278.
confound the measurement of adhesion. Förstner, U., S. Heise, R. Schwartz, B. Westrich, and W. Ahlf.
Other possible applications—This method can be used for any 2004. Historical contaminated sediments and soils at river
subtidal or intertidal sediments, including complex biofilm- basin scale. J. Soils Sediments 4:247-260.
based systems such as stromatolites (Paterson et al. 2008), but Ghosh, U., J. R. Zimmerman, and R. G. Luthy. 2003. PCB and
the measurements of moist surfaces should be made underwa- PAH speciation among particle types in contaminated har-
ter because of surface tension effects. In addition, dry exposed bor sediments and effects on PAH bioavailability. Environ.
surfaces where adhesion is important might also be examined; Sci. Technol. 37:2209-2217.
to date we have tested very few other substrata, but Guo, L. H., H. L. Wang, X. D. Liu, and J. Duan. 2008. Identifi-
stonework, tree surfaces, leaves, etc., remain possible candi- cation of protein differences between two clinical isolates
dates for investigation. of Streptococcus mutans by proteomic analysis. Oral Micro-
The MagPI represents an economically viable, easily con- biol. Immunol. 23:105-111.
structed, easy-to-use tool to determine surface adhesion, a Gust, G., and V. Mueller. 1997. Interfacial hydrodynamics and
proxy for the retentive capacity of the substratum. The knowl- entrainment functions of currently used erosion devices.
edge of surface adhesion can provide useful insights for par- In: N. Burt, R. Parker, J. Watts (eds.), Cohesive Sediments.
ticulate pollutant capture, nutrient trapping, enhancing sedi- Chichester: Wiley, p. 149–175.
ment stability, and capturing particles in various depositional Jain, A., Y. Gupta, R. Agrawal, P. Khare, and S. K. Jain. 2007.
systems such as intertidal flats, shallow submerged sediment Biofilms—a microbial life perspective: a critical review. Crit.
systems, and stromatolites, to name but a few. In contrast to Rev. Ther. Drug Carrier Sys. 24:393-443.
496Larson et al. Magnetic particle induction: MagPI
Kern, U., V. Shuerlein, M. Holzwarth, I. Haag, and B. Westrich. Part I: Literature review. Acta Hydrochim. Hydrobiol.
1999. Ein strömungskanal zur ermittlung der tiefenab- 34:411-424.
hängigen erosionstabilität von gewassersedimenten: das Schuenemann, M., and H. Kuehl. 1991. Experimental investi-
SETEG system. Wasserwirtshaft 89:72-77. gations of the erosional behaviour of naturally formed mud
Lebech, B., K. A. McEwen, and P. A. Lindgard. 1975. Magnet- from the Elbe estuary and adjacent Wadden sea, Germany.
ism in prasedymium-nedymium single-crystal alloys. J. In A. J. Mehta (ed.), Nearshore and Estuarine Cohesive Sed-
Phys. C Solid State Phys. 8:1684-1696. iment Transport Workshop, p. 314-330.
Liu, H., and H. H. P. Fang. 2003. Hydrogen production from Sheng, G. P., M. L. Zhang, and H. Q. Yu. 2008. Characteriza-
wastewater by acidogenic granular sludge. Water Sci. Tech- tion of adsorption properties of extracellular polymeric
nol. 47:153-158. substances (EPS) extracted from sludge. Colloids Surf. B
Manz, B., F. Volke, D. Goll, and H. Horn. 2005. Investigation Biointerfaces 62:83-90.
of biofilm structure, flow patterns and detachment with Stal, L. J. 2003. Microphytobenthos, their extracellular poly-
magnetic resonance imaging. Water Sci. Technol. 52:1-6. meric substances, and the morphogenesis of intertidal sed-
McLean, J. S., O. N. Ona, and P. D. Majors. 2008. Correlated iments. Geomicrobiol. J. 20:463-478.
biofilm imaging, transport and metabolism measurements Sutherland, T. F., J. Grant, and C. L. Amos. 1998. The effect of
via combined nuclear magnetic resonance and confocal carbohydrate production by the diatom Nitzschia curvilin-
microscopy. Isme J. 2:121-131. eata on the erodibility of sediment. Limnol. Oceanogr.
McNeil, J., C. Taylor, and W. Lick. 1996. Measurements of ero- 43:65-72.
sion of undisturbed bottom sediments with depth. J. Tolhurst, T., K. Black, D. M. Paterson, H. Mitchener, G. Ter-
Hydraul. Engin. Asce 122:316-324. maat, and S. Shayler. 2000. A comparison and mea-
Morton, L. H. G., D. L. A. Greenway, C. C. Gaylarde, and S. B. surement standardisation of four in situ devices for deter-
Surman. 1998. Consideration of some implications of the mining the erosion shear stress of intertidal sediments.
resistance of biofilms to biocides. Int. Biodeterior. Biode- Continent. Shelf Res. 20:1397-1418.
grad. 41:247-259. Tsai, C. H., and W. Lick. 1986. A portable device for measuring
Paterson, D. M. 1989. Short-term changes in the erodibility of sediment resuspension. J. Great Lakes Res. 12:314-321.
intertidal cohesive sediments related to the migratory Underwood, G. J. C., and D. M. Paterson. 2003. The impor-
behavior of epipelic diatoms. Limnol. Oceanogr. 34:223- tance of extracellular carbohydrate production by marine
234. epipelic diatoms. In Advances In Botanical Research, vol 40.
Paterson, D. M., and others. 2008. Light-dependent biostabili- New York: Elsevier, p. 183-240.
sation of sediments by stromatolite assemblages. PLoS ONE Verney, R., J. C. Brun-Cottan, R. Lafite, J. Deloffre, and J. A.
3: e3176; doi:3110.1371/journal.pone.0003176. Taylor. 2006. Tidally-induced shear stress variability above
Paterson, D. M., and others. 2000. Variations in sediment intertidal mudflats in the macrotidal Seine estuary. Estuar.
properties, Skeffling mudflat, Humber Estuary, UK. Conti- Coasts 29:653-664.
nent. Shelf Res. 20:1373-1396. Submitted 7 January 2009
Raszka, A., M. Chorvatova, and J. Wanner. 2006. The role and Revised 16 May 2009
significance of extracellular polymers in activated sludge. Accepted1 June 2009
497You can also read