Digital Breadcrumbs and Dietary Diversity: Testing the Limits of Cell Phone Metadata in Poverty and Impact Assessment
←
→
Page content transcription
If your browser does not render page correctly, please read the page content below
Digital Breadcrumbs and Dietary Diversity: Testing the Limits of
     Cell Phone Metadata in Poverty and Impact Assessment
    Oscar Barriga-Cabanillas1 , Joshua E. Blumenstock2 , Travis J. Lybbert3 , and Daniel
                                         Putman4
                                                 1
                                                   World Bank
                                    2
                                        University of California, Berkeley
                                        3
                                          University of California, Davis
                                        4
                                          Innovations for Poverty Action

                                             February 16, 2022

                                                     Abstract
      A series of recent papers demonstrate that cell phone metadata, in conjunction with machine
      learning algorithms, can be used to estimate the wealth of individual subscribers, and to target
      resources to poor segments of society. This paper uses survey data from an emergency cash
      transfer program in Haiti, in combination with mobile phone data from potential beneficiaries,
      to explore whether similar methods can be used for impact evaluation. A conventional regression
      discontinuity-based impact evaluation using survey data shows positive impacts of cash trans-
      fers on household food security and dietary diversity. However, machine learning predictions
      of food security derived from mobile phone data do not show statistically significant effects;
      nor do the predictions accurately differentiate beneficiaries from non-beneficiaries at baseline.
      Our analysis suggests that the poor performance is likely due to the homogeneity of the study
      population; when the same algorithms are applied to a more diverse Haitian population, per-
      formance improves markedly. We conclude with a discussion of the implications and limitations
      for predicting welfare outcomes using big data in poor countries.

JEL Classification: C8, D0, O1
Keywords: Metadata, call detail records, machine learning, cash transfers, targeting, Haiti
1 Introduction
Understanding whether a given product, program, or intervention improves livelihoods is as im-
portant as it is challenging. While established impact evaluation techniques can provide credible
evidence of impact, they can also be expensive because they typically require active survey-based
data collection. As individuals – rich and poor – generate data through their use of information
and communication technologies, new opportunities emerge to leverage these passive records to
understand behavior, preferences, and well-being. Blumenstock, Cadamuro and On (2015) first
demonstrated such an opportunity. Using metadata associated with mobile phone usage, the study
predicted wealth levels with surprising accuracy and triggered a cottage industry of similar machine
learning-based approaches to extracting meaningful signals from these Call Detail Records (CDRs).
This empirical success raised a host of intriguing possibilities. Two such possibilities, here phrased
as questions, motivate our analysis in this paper: Can CDRs identify potential beneficiaries of
means-tested programs and thereby enhance the cost-effectiveness of targeting? Can CDRs also
capture changes in wealth or well-being and thereby enable near real-time evaluation of the impact
of new programs, products or policies?
In 2016, the World Food Program (WFP) responded to a third consecutive year of drought in
Haiti with an emergency unconditional cash transfer program to protect household food security.
These transfers, which targeted the poorest households in drought-hit areas, consisted of three con-
secutive monthly disbursements via mobile money. The value of these transfers was significant, each
representing 130% of monthly average per capita income.1 We collaborated with WFP to evaluate
the impact of the cash transfers on household food security, dietary diversity and consumption.
Additionally, we partnered with the mobile network operator that facilitated these mobile money-
based transfers to obtain access to cellphone transactions data of the people that participated
in the targeting and evaluation phase of the program. In this paper, we provide a conventional
survey-based impact evaluation of the program and then use these results as a benchmark for an
alternative CDR-based impact evaluation of the same program.
As in the benchmark evaluation, we leverage the targeting threshold used by the WFP to im-
plement a regression discontinuity (RD) design that estimates the impacts of the unconditional
cash transfer program using survey data. We find the program increased household food consump-
tion and food expenditure in 0.35 and 0.31 standard deviations, respectively. For the CDR-based
alternative, we use feature engineering and a structured combinatorial method to generate several
hundred CDR metrics from the volume, intensity, timing, direction, and location of communication,
as well as the household’s position in the cellphone network.2 With this rich set of features in hand,
we deploy machine learning algorithms to predict the targeting status of beneficiaries, as well as
household food security outcomes, which we then use to replicate the RD impact evaluation.
At the outset, this cash transfer program seemed to provide an ideal setting in which to test the
viability of a CDR-based targeting and evaluation. On the targeting side, WFP uses a standard and
simple scorecard to quickly rank would-be beneficiaries in terms of wealth, and CDRs have shown
promise in predicting precisely such outcomes. On the evaluation side, the monthly transfers were
large relative to household income and were sent for three consecutive months, so it is reasonable to
expect the impacts to readily detectable. The use of a scorecard threshold for targeting beneficiaries
enables RD identification of these impacts for both survey- and CDR-based measures of well-being.
1
Based on the 2012 ECVMAS households survey.
2
For our main results we use Bandicoot, an open-source Python toolbox. See section 4.1 for details.
1Finally, the transfers were distributed via mobile money in collaboration with Haiti’s largest mobile
network operator, which enjoys a dominant 80% market share in the country. This facilitates our
ability to link scorecard responses and cash transfers to specific mobile network users.
Despite these advantages, we were not able to replicate the survey-based RD results using these
metatdata or the targeting. Our failure to replicate these impact evaluation results runs deep as all
of our the predictions of the household-level food security outcomes using our CDR features and
machine learning algorithms present low levels of accuracy. That is, in the horse race we set out to
run between conventional survey-based and novel CDR-based impact evaluation, the CDR horse
stumbled out of the gate, which ended the race before it really began. There is, however, much
to learned from this failed prediction attempt about the limits of CDR-based analyses such as the
targeting and impact evaluation applications that motivate this work.
In a postmortem assessment, we discuss why CDR predictions failed in this seemingly-ideal
setting. First, given high levels of poverty and vulnerability, cellphone ownership and, in some
regions, access to the cellphone network is low. Only 34% of the participants in the scorecard
survey reported owning a cellphone, with cellphone ownership concentrated among less vulnerable
individuals. Solely relying on cellphone data limits the population we can observe (target) and
can introduce bias as higher vulnerability levels correlate with lower levels of cellphone ownership.
Furthermore, the practice of sharing devices, more common in low income households, creates
additional challenges as it dilutes any potential signal about wealth levels in the data. Second, the
targeted geographic areas in this program were pre-selected based on drought-induced and general
vulnerability. Within these pre-selected communes, the WFP administered the scorecard to identify
specific beneficiary households. While this two-tiered approach can improve targeting, it restricts
the statistical variation we can observe in household wealth and outcomes and limits our ability
to predict outcomes using CDRs. Third, the exogenous eligibility cut-off is ideal for RD impact
evaluation, but its primary identifying assumption is that those on either side of the cut-off are
statistically indistinguishable, limiting the variation in the CDR usage patterns on both sides of the
eligibility cut-off. Finally, the primary outcomes of interest in this study are flow variables (e.g.,
food consumption) rather than stock variables, and the promising evidence of CDR predictions has
so far concentrated on the prediction of stock variables such as assets and wealth.
We empirically explore these postmortem considerations from a variety of perspectives. We
compare our data to nationally-representative data from Haiti to understand the implications of
tight (effective) targeting. The statistical variation in the primary outcomes for our WFP sample
is indeed significantly lower than for the general Haitian population. The scorecard sample, unsur-
prisingly, is more vulnerable with food insecurity levels double the national average and the total
food expenditure distribution below the 70th percentile of the overall distribution. These factors
limit the variation that machine learning models can use to recreate both the targeting and the
outcome variables. With additional tests, we find that CDR predictions improve as we increase
the variability in outcomes. To explore our ability with greater variation in the data to predict
flow variables such as food consumption, we obtained informed consent from a subsample of the
participants in the nationally representative survey and predicted their wealth levels and food ex-
penditures. We show that while we can predict wealth levels relatively well in this broader sample,
the predictions are much less reliable when it comes to flow outcomes like consumption.
In the next section, we provide a broader introduction to the use of passive data in development
economics and then describe additional details about the WFP cash transfer program. In the
methods section, we present the RD design and the various data sources we use in our analysis.
2Section 5 provides the survey-based impact estimates that serve as a benchmark for the alternative
CDR-based impact estimation. In section 6, we present our CDR-based predictions and discuss
the associated implications for CDR-based targeting and impact evaluation. We conclude with a
detailed postmortem discussion and broader reflections.
2 Passive Data in Development Economics
Reliable and up-to-date data is a key factor in the effective implementation of public policies. The
absence of official data is more acute in poor and developing countries, forcing governments to
implement public programs with limited information (Blumenstock, 2016). Collecting these data
is expensive in both monetary and administrative terms, and in many situations, it cannot be
produced with the necessary speed to attend to extraordinary demands such as relief programs
following a natural disasters.
The last few years have seen a large increase in the amount of data produced daily by private
digital transactions. This digital footprint contains information on billions of individuals, including
those living in poverty. One of these novel sources of information is the transaction data that
mobile phone subscribers create every time they make or receive a call. Users do not create this
information to contribute to any policy or research objective; instead, the data are passively created
as part of the regular network operation. While these datasets may be a step removed from the
on-the-ground outcomes policy-makers care about, advances in feature engineering and machine
learning allow us to use this information to circumvent data limitations.3
With more than 95% of the global population with mobile-phone coverage, CDR data create
a unique opportunity to address a major challenge policy-makers and researchers face in contexts
where reliable quantitative data are scarce (Blumenstock, Cadamuro and On, 2015; Blumenstock,
2016). The first applications of these methods studied how regional socioeconomic conditions create
signals that can be detected on aggregated the CDR data trail, in particular regional poverty levels
(Hernandez et al., 2017) and food security indicators (Decuyper et al., 2014). In areas where official
statistics are not recent, CDR data and machine learning methods provide an tool for updating
indicators in-between household survey rounds.
Building on the previous results, several papers demonstrate that mobile phone data can be use
to estimate outcomes at the individual level. The logic behind this approach is that phone usage
captures many behaviors that have some intuitive link with socioeconomic indicators, allowing
researchers to differentiate the most vulnerable households. As described by Björkegren and Grissen
(2015), a phone account is a financial account that captures part of a person’s expenditure, with
most of the calling behavior being an indicator of how a person manages his expenses. For example,
individuals with different income streams are likely to have call patterns indirectly linked with
socioeconomic status. These include when a person uses his phone, geographic mobility, and the
diversity of the calling network. Blumenstock, Cadamuro and On (2015) use CDRs and data from
a nationally representative survey in Rwanda to demonstrate how an individuals’ socioeconomic
status can be inferred from CDR transactions, while Blumenstock (2018) demonstrates similar
techniques can also be used to accurately predict wealth levels in an Afghan sample. In both
3
There are plenty of remote sensing applications that rely on data other than cellphone records. For example, Jean
et al. (2016) uses satellite imagery, nightlights to infer poverty in Nigeria, Tanzania, Uganda, Malawi, and Rwanda,
and Goldblatt et al. (2018) use satellite imagery and remote sensing data to characterize land cover and urbanization
in India, Mexico, and the United States.
3applications, the authors find their behavioral features can explain about 46% of the total variation
of a wealth composite index.4
The success in predicting individual-level outcomes potentially opens the door to new applica-
tions to improve public policy.5 The first application is in complementing/replacing conventional
methods used to target social programs. The importance of targeting to make anti-poverty pro-
grams more cost-effective has been widely studied (Alatas et al., 2012; Coady, Grosh and Hoddinott,
2004; Brown, Ravallion and Van de Walle, 2016). Common targeting protocols rely on adminis-
trative and survey-based measures of assets or consumption. These information is not available
in many developing, and if it is available, usually has reliability problems. Moreover, for most
practical applications to small and medium scale programs collecting this information adds a large
administrative cost. The passive nature of CDR data may provide an additional tool to improve
targeting efforts with shorter deployment times. Aiken et al. (2020) studies the extent that mobile
phone data can be used to identify ultra-poor households in the context of an anti-poverty program
in Afghanistan. In their study, a community wealth ranking and a deprivation survey provide the
ground-truth data that classifies a household as ultra-poor.6 An advantage of this study is that
a household survey was collected independently of the ultra-poor classification survey, providing
a much richer set of indicators to compared the CDR-based method accuracy. Using six months
of cellphone data, the authors find CDR-based methods have an accuracy of 70%, very similar to
standard survey-based consumption (73%) and asset-based measures (70%). Combining the infor-
mation from the CDR data and the household survey into a single classification problem provides
the best results, with an accuracy of 79%. However, as discussed in the paper, using several data
sources might not a possibility in most real-life applications.
The second potential application is the use of mobile phone transaction records to enable new
approaches to impact evaluation and program monitoring. An initial application of CDR data
to complement impact evaluation studies used the data as part of the identification strategy. One
example is (Olivieri et al., 2020) who uses cellphone records to identify the geographical distribution
of Venezuelan migrants in Ecuador to understand their impact on labor market outcomes. Other
papers have used the mobility patterns captured by the usage of mobile phones to understand how
local-level policies affected refugees’ mobility in Turkey (Beine et al., 2019), population movement in
the wake of natural disasters (Wilson et al., 2016), and the spread of infection disease (Wesolowski
et al., 2012; Milusheva, 2020). We go one step further by trying to use cellphone data to estimate
changes in welfare over time in the context of an impact evaluation study.
3 The World Food Program EMOP Initiative
In 2016, in response to a third consecutive year of drought in Haiti, the WFP conducted an
Emergency Food Assistance Program (EMOP), with the objective to improve food security of
households in the affected areas. During the program’s lifespan, it provided 46,163 households
4
Applications of these methods already exist for commercial applications, for example, providing credit scores in
settings where credit bureau are not present (Björkegren and Grissen, 2015).
5
Blumenstock, Cadamuro and On (2015) provides a complete list of potential applications of CDR data for social
research.
6
The ranking used the following questions 1. Household is financially dependent on women’s domestic work or
begging. 2. Household owns less than 800 square meters of land or is living in a cave. 3. Targeted woman is younger
than 50 years of age. 4. There are no active adult men income earners. 5. Children of school age are working for
pay. 6. The household does not own any productive assets.
4with three monthly transfers of 3050 HTG (around 50 USD) delivered via mobile money; a large
sum with each payment roughly equivalent to the minimum wage or 130% of monthly average per
capita income.7 The rapid-response nature of the program guided key decisions on the targeting
and implementation protocols, including the use of a simple scorecard mechanism to measure
vulnerability and relying on the existing mobile money infrastructure to deliver funds.
The EMOP used a three-step targeting process to select beneficiaries. During the first stage the
program’s geographical targeting was determined. The WFP, together with the Haitian government
and other organizations, conducted a nationwide emergency food security assessment to determine
the areas with the largest concentration of food-insecure households.8 To avoid duplication of aid
initiatives, the WFP focused on areas where no other actors were intervening at the time. This led
to the prioritization of 21 rural communes across the country.9
In the second stage, the WFP engaged with local stakeholders to construct a list of the families
living in the area, build trust in the program’s implementation, and tailor the scorecard question-
naire to local conditions. The result of this process was the sampling frame used to conduct the
scorecard survey, and slight modifications to the questionnaires, tailoring them to the specific farm
animals present in each region.10
The selection of beneficiaries took place during the third stage of the program’s targeting
process. The WFP administered a short survey, that official documents call scorecard survey, and
used the information to calculate the value of a vulnerability index for every household interviewed.
The objective of the vulnerability index is to measure how susceptible a household is to suffer from
food insecurity and hunger. A higher number corresponds to higher levels of vulnerability, and
therefore, greater need of the program’s assistance.11 The overall score of a household is an integer
number based on responses to questions (most of which were simple “yes” or “no” questions) about
land, animal ownership, and the presence of vulnerable people in the household, with possible scores
ranging from zero to eight.12 The scorecard exercise is a standard practice for the WFP operations
worldwide, especially when rapid delivery of funds is necessary to provide aid.
The scorecard vulnerability index follows a proxy means test approach towards identifying the
most vulnerable households in the absence of consumption based poverty indicators (Grosh and
Baker, 1995). As explained by Gazeaud (2020), a complete proxy means test requires a two step
process. First, an in-depth survey is administered to a sample of households to collect data on
consumption as well as some easily observable and verifiable correlates of consumption. These
data are used to estimate a regression of log consumption per capita on correlates of consumption.
7
Based on the 2012 ECVMAS households survey.
8
The WFP carried out the data collection together with the Haitian National Coordination for Food Security and
in collaboration with its partners (FAO, FEWS NET, OCHA and others) between November and December 2015. The
assessment measured the impact of the drought on the number of moderately and severely food insecure households.
The analysis also entailed assessing the functioning of markets and their response capacity in case of providing aid
in the form of cash. See https://docs.wfp.org/api/documents/808de753fc264d318ec818204f5c71bc/download/?g a =
2.133089166.1686038113.1625782808 − 592851595.1621481902
9
These communes are located in prioritize the Nord-Est, Artibonite, Nord, Centre, Ouest, Nippes, Grande-
Anse, Sud and Sud-Est Departments. Full details on the program’s implementation are available at:
https://docs.wfp.org/api/documents/a2e0fd284cf2431289120c36f83ffe28/download/
10
Depending on the region, questions about animal ownership included different combinations of cows, horses,
sheep, goats, and pigs.
11
The scorecard exercise is part of the Household Economic Analysis (HEA) used by the WFP. The HEA arose
from a collaboration in the early 1990s as a tool to improve the FAO ability to predict short-term changes in a
population’s access to food, see (Holzmann et al., 2008).
12
This includes children, pregnant and lactating women.
5Second, a short survey is administered to all potential beneficiary households to collect information
on the same correlates of consumption, and compute a new score using short survey information.
Unfortunately, the EMOP implementation lacks the necessary data to implement the first stage
of the identification and weighting of the correlates of the indicators, relying instead on previous
WFP experience in to choose the variables used in the construction of the index.
The implementation of the program used the vulnerability score to target aid. At the com-
mune level, the cut-off to be eligible for the program depended on the total funds assigned to the
region.13 Since the eligibility cut-offs were selected after scores were assigned taking into account
the total funds assigned to each area, households had not opportunities to try to manipulate their
vulnerability score and precise treatment status. This constitutes the basis for the evaluation of the
program using a Regression Discontinuity design, see section 5. Under the selection criteria, there
are several instances where a person with a specific score did not receive aid given the commune
where he lived but would have been eligible with the same score in another area. Most communes
required a score between three to five to grant eligibility (81% of the covered population), with
some communes requiring a vulnerability score as high as 6 (17% of the covered population). We
provide more details on how this affects our replication of the eligibility criteria using CDR data
and machine learning methods in section 6.
The use of mobile money to distribute funds makes every transaction linked to a cellphone
number. If beneficiary household did not have a SIM card to receive transfer payments, WFP and
Digicel provided one.14 Records show a total of 63,201 phone numbers receiving a transfer during
the period. As Figure 1 shows, transfers occurred at different times over the period, reaching their
peak in August 2016; however, within geographical locations (e.g., commune), transfer patterns
tend to be similar between households.
13
The total funds assigned to each communed where the results of the total population in an area, with communes
with higher population levels receiving more funds independently of the distribution of the vulnerability scores in the
commune.
14
We have access to all the mobile money transaction records, where the EMOP transfers are just one of the many
transactions.
6Figure 1: Count of WFP Transfers: 2016-2017
35,000
30,000
Total transfers
(monthly) 25,000
20,000
15,000
10,000
5,000
0
May Jun Jul Aug Sep Oct NovDec Jan FebMar Apr
2016 2017
Month
Note: Author’s calculations using mobile money transaction logs.
4 Methods
In this section, we discuss the validity of the RD design and explain how we combine the CDR data
with the formal evaluation of the program. Figure 2 provides a diagrammatic representation of our
approach towards using CDRs combined with the formal evaluation of the EMOP program. The
first part consists of the traditional approach to impact evaluation. The program’s implementation
relied on identifying households with the highest levels of vulnerability using the scorecard exercise
described above. The use of a vulnerability score to determine eligibility allows us to evaluate the
program’s impact using an RD design. We measure the outcomes using an additional in-person
survey administered seven months after the start of the program. We use both surveys as the
ground-true data to feed the prediction models. The second part of Figure 2 shows the steps we
follow to combine the CDR data with the information from the surveys. We start by processing
the CDR data to create hundreds of behavioral features for each cellphone number and match
them to individuals participating in the surveys. We face several challenges as a large percentage
of participants lacked a cellphone and, in several cases, several household heads reported the same
number as their own. After connecting the survey information with the behavioral features, we
test different algorithms to try to replicate the program assignment determined by the scorecard
vulnerability score and the program’s main outcomes as captured during the in-person survey. We
use cross-validation to limit the possibility of overfitting these models and choose the one with the
best out-of-sample performance.
The rest of this section is organized as follows. Section 4.1 explains the feature engineering pro-
cess we implement to extract useful information from the raw cellphone data. Section 4.2 describes
the different surveys available for the impact evaluation of the program and as ground-truth data
7Figure 2: Our Approach to Running a Call Detail Record Based Evaluation
for the prediction. Additionally, this section explains the process to integrate individual survey
responses with the corresponding the CDR data. Finally, section 4.3 discusses the identification
strategy using an RD design.
4.1 Feature engineering
Our objective with the cellphone transaction data is two-fold. First, we want to predict the eligi-
bility status from the scorecard survey. Second, we want to predict the program’s main outcome
variables and used the prediction to replicate the results from the impact evaluation of the program.
In its raw format, CDR data provides a detailed account of each cellphone number activity. We
want to extract information about each user’s behavioral patterns that correlate with his socioe-
conomic characteristics. For this, we use feature engineering on the cellphone transaction data to
compute behavioral indicators that capture aggregate aspects of each individual’s mobile phone
usage. In essence, for each phone number, we construct a vector of values that represent usage
patterns and link them back to the survey responses of individual i. We generate the features
using Bandicoot, an open-source toolbox for CDR analysis. The program creates metrics similar
to other feature engineering methods used in the literature, such as Blumenstock, Cadamuro and
On (2015). Its main advantage is that it provides a ready-to-use and computationally optimized
method to extract features from cellphone metadata.15
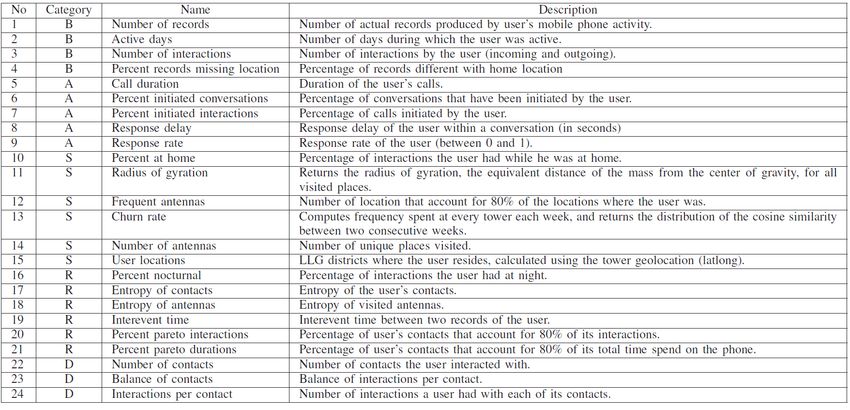
Indicators include information about an individual’s overall behavior (average call duration
and percent initiated conversations, percent of nocturnal interactions, inter-event time between
two phones calls), spatial patterns based on cell tower locations (the number of unique antennas
visited and the radius of gyration), social network (the entropy of their contacts and the balance
of interactions per contact), and recharge patterns (including the average amount recharged and
15
For a full description of the method, see De Montjoye, Rocher and Pentland (2016).
8the time between recharges) (De Montjoye, Rocher and Pentland, 2016). Each feature is calculated
as a week-level mean, standard deviations, median, min, max, kurtosis, and skewness, as well as
additional statistics disaggregated over weekdays, weekends, and working and night hours. Figure
1A explains the process to calculate individual features.
Since the features represent week-level statistics, we must decide how many days of cellphone
transaction data to include in the feature generating process. Two forces are at play. First, a
wider time window provides a more diverse set of transactions from which to extract information.
On the other hand, we must consider how much the outcome we want to predict varies during
this time window. In principle, outcomes with little variation over time benefit from using long
series of cellphone data as the different features can capture more information. Applications that
predict individual-level wealth levels, a variable that during normal times presents little variation
over time, extract features from one year to six months of CDR data (Blumenstock, Cadamuro and
On, 2015; Aiken et al., 2020). There is evidence on how changes in the size of the ground-true data
affect the prediction capacity of CDR-based models and how a models’ accuracy decays over time
(Blumenstock, Cadamuro and On, 2015; Lazer et al., 2014). However, to the best of our knowledge,
there is no evidence on how the length of the time series of CDR data affects predictive capacity,
and how that relates to the variability over time of the predicted outcomes. Considering that we
are interested in food security outcomes from individuals who live in regions affected by a natural
disaster, we expect that the observed levels at the time of the survey were affected by both the
shock and coping strategies. We have no prior about the optimal number of months of pre-survey
CDR data to create the features. Instead, we opt to compute features using three different time
windows preceding the date a person was surveyed: Fifteen days, one month, and six months.
To calculate the time window, we omit the week preceding the survey to avoid changes in calling
patterns in expectation to be interviewed.
For each individual, we extract a total of 2,148 behavioral features in each of the three time
windows. We implement two initial filters on the features that make each time window includes a
slightly different set of variables. First, we drop any feature with more than 50% of missing values.
Second, we eliminate those with a variance below 0.02. Finally, to avoid models that contain highly
correlated features that do not provide additional information, we calculate a correlation matrix
for all the features and eliminate all but one for those with a correlation above 0.98.16 Table 1
shows the number of features available for each time window and survey combination.
4.2 Data: Description and integrated sample
Since our main application uses CDR to replicate the program’s targeting and impact evaluation,
we are constrained by our ability to match the survey responses with the cellphone data. To
explain this process, we first describe the available CDR data. Then for each survey, we detail
the sample we can match and provide descriptive information to understand how the remaining
sample compares with the overall population. Table 1 summarizes the samples of the scorecard
and in-person surveys, and shows the specific samples we are able to match to the cellphone data.
16
This approach is similar to Aiken et al. (2020)
9Table 1: Data sources directly collected from participants
Survey
Scorecard In-person
Sampling
Unit of analysis Household Household
Data collection period Apr. - Sept 2016 Dec. 2016
Location 21 communes 2 communes
Observations 58,881 1,137
Beneficiaries 46,163 (78.4%) 697 (61.3%)
Cellphone related data (% of total sample)
Owns a phone 20,190 (34.3%) 1,076 (94.6%)
Phones matches 13,780 (68.3%) 872 (81.0%)
Numbers that match (% of matched numbers)
Beneficiaries 10,491 (76.1%) 506 (58.0%)
Non-beneficiaries 3,289 (23.9%) 366 (42%)
Sample with features
Fifteen-days 12,739 797
Thirty-days 13,142 825
Six-months 13,682 855
Features available
Fifteen-days 1,355 1,265
Thirty-days 1,457 1,394
Six-months 1,315 1,303
Note: Features available after filtering those with more that of 50% missing
values, a variance of less that 0.02, and correlations above 0.98
Call Detail Records
Digicel is the largest cellphone company in Haiti. Besides providing cellphone services, the company
operates the largest mobile money platform in the country. In 2016, it partnered with the WFP
to deliver funds to beneficiaries using its mobile money platform. As part of the partnership with
the WFP, Digicel provided cellphone records containing all the transactions made, in the network,
between August 2015 and May 2017. All the information is anonymized, and we cannot see the
content of calls or text messages. The CDR data covers all the evaluation cycle, including several
months before each survey took place. Figure 3 shows how all the data sources overlap. For each
type of transaction, we can observe:
• Calls: Anonymized numbers for the caller and the receiver, time of the call, duration of the
call, and cellphone towers connecting the call.
• Text message: Anonymized numbers for the sender and the recipient, time of the text message,
and the closest tower to the party that sent the text message.
10During the period, a total of 29,907,850 transactions took place, broken down into 12,523,717
calls, 17,384,133 text messages. From this transaction, we extract behavioral features for three
different time windows.
Figure 3: Program’s timeline: Data availability and implementation
Impact Evaluation Timeline: Data Coverage, Key Events and Project Dates
CDR Data 1/1/2016 - 3/1/2017
EMOP 4/1/2016 - 12/31/2016
Transfer Data 4/1/2016 - 3/31/2017
Rainy Season 4/15/2016 - 10/31/2016
Hurricane Season 6/15/2016 - 11/15/2016
WFP State of Emergency - Matthew 10/4/2016 - 2/25/2017
In-person suvey 12/14/2016 - 12/23/2016
Phone survey 4/18/2017 - 4/25/2017
Jan Mar May Jul Sep Nov 2017 Mar May
10/4/2016
Hurricane Matthew
Scorecard
This survey provides the basis for eligibility for the program. The WFP conducted the scorecard
exercises between April and mid-September 2016.17 It constitutes the final step of the WFP three-
step targeting strategy. The survey took place in regions the WFP had previously identified as
the hardest hit by the 2016 drought, with only households living in the pre-screened candidate
communes participating in the survey. Eligibility depends on a commune-specific score. Due to the
rapid response nature of the survey, the scorecard survey is not as thorough as an LSMS survey
and lacks a full module on assets and consumption. 18
A total of 58,881 households participated in the scorecard survey. Using the vulnerability
score and the program’s financial constraints, the WFP determined 46,163 (78.4%) eligible for
the program. Considering that cellphone ownership in Haiti was below 50%, it is not surprising
that in a vulnerable population, such as ours, only 20,190 (34.3%) of the participants reported
having a cellphone number.19 Since our application relies on matching individual survey responses
to cellphone records, we are limited to participants with a cellphone number that matches our
records. We are able to recover the CDR data for a total of 13,780 (68.3%) of the respondents
with a phone, a number that is close to the market share of Digicel. As Table 2 shows, the share
of beneficiaries in the sample of cellphone owners is marginally lower than in the overall sample
(76.1%), as a consequence of cellphone ownership being positively correlated with wealth and
negatively correlated with the vulnerability score. Additionally, we find a statistically significant
17
Data collection was planned from April until August. The schedule was extended to account for initial delays
and the inclusion of additional areas.
18
Similar sampling methodology and questionnaires are standard for the WFP operations worldwide, especially
when rapid delivery of funds is necessary to provide aid. The WFP website provides more details about how
interventions are implemented and current programs: https://www.wfp.org/emergency-programming
19
A minority of participants in the survey (174) reported a phone number that was also reported by another
household. We omit their answers from the study.
11difference in the vulnerability score within the group of cellphone owners. In particular, numbers
that match our records have the lowest average vulnerability levels; see last two columns of Table
2. We are not aware of the cause of this apparent self-selection into different carriers. However,
this highlights the intrinsic limitations of CDRs as a targeting tool.
We extract behavioral features for the 13,780 individuals with matched cellphone records. As
Table 1 shows, the number of subscribers with features increases with the length of the time
window, and it is always below the total number of numbers in the network. In the presence
of sparse cellphone usage, short time windows are less likely to capture any activity.20 For the
six-month window, the only reason for a number not presenting activity is that the respondent
activated the number in the week before participating in the survey, and therefore is not included
in the feature extraction process.21
Table 2: Vulnerability score by cellphone ownership status
Cellphone Ownership Sig. diff.
(i) No (ii) Other operator (iii) In network (i) -(iii) (ii)-(iii)
Panel (a): Scorecards survey
Vulnerability Score 0.74 0.41 0.32 *** ***
(1.55) (1.28) (1.27)
Beneficiary (%) 79.19 78.52 76.13
Households 38,691 6,410 13,780
Panel (b): In-person survey
Vulnerability Score 0.54 0.17 -0.11 *** ***
(1.18) (1.25) (1.28)
Beneficiary (%) 85.25 68.14 58.03
Households 61 204 872
Note: A higher vulnerability score makes a household more likely to participate in the program.
We only have access to the transaction data for the number in the participating network.
In-Person Survey
To measure the impact of the program, we collected an in-person survey in December of 2016.
The survey collects information for a total of 1,137 people in two regions in the south of Haiti:
Aquin (801) and Fonds-Verrettes (336).22 The sampling of this survey targeted people around the
eligibility threshold as it is the main tool to evaluate the program’s impact using a RD strategy.
The original scorecard survey in those two communes included 16,637 people. In contrast to the
scorecard survey, this survey includes detailed questions on food consumption and expenditures,
occupation, livestock holdings, and family composition. The share of beneficiaries in the sample is
61.3%, which is 17 percentage points lower than in the general population. The rate of cellphone
ownership stands at 94.6%; a number that represents a large increment from the 44% captured by
20
Sparse activity (low demand for communication) correlates with low-income levels that limit cellphone usage.
21
Ownership of a number is lost if no recharge takes place during three consecutive months.
22
Aquin is on the southwestern peninsula, and Fonds-Verrettes, which is inland, southeast of Port Au Prince.
12the scorecard survey in the same communes.23 We are able to recover the CDR data for a total
of 872 of the respondents (81.0% of the respondents with a phone). In this sample, the share of
beneficiaries is 3 percentage points lower than in the general population (58.0%). We also observe
that respondents with a cellphone have lower vulnerability levels, see Panel (b) of Table 2. As
expected, the number of individuals with features increases with the time window, see Table 1.
Additional Data: Nationally representative survey
As mentioned before, the emergency nature of the intervention implies that the survey data is
concentrated in areas affected by the 2016 drought. We use a nationally representative survey
of 4,267 households interviewed between May and October 2018 (FinScope, 2018). These data
set provides a sample with greater socio-economic variation, which allows to put the participating
population in context, and test the extend that a narrow sampling limits our capacity to predict the
main outcomes of the program. 24 The questionnaire is close to an LSMS survey but has several
modules focused on access to financial services. Using the questions available, we harmonized food
consumption and food security variables to reflect as close as possible the WFP surveys.
A key advantage of using this survey is that for a subset of participants we are able to link
their responses with their individual CDR data. For this, we conducted a follow-up call where
participants provided ‘informed consent’ to access their cellphone records. Since participation in
the Finscope survey was in person, we only contacted those who provided a phone number at the
time of the survey. Between January and March 2021 we made four attempts to contact each
number. Out of 2,870 participants with a phone number, we can use the CDR data for 1,132
cellphone lines.25
Table 3 shows differences in household composition, location, wealth, and food security by
phone ownership status (see columns 2 and 3). As expected, people who own a phone tend to be
younger and are more likely to live in urban areas. Phone ownership is correlated with higher levels
of wealth and lower levels of food insecurity.26 When we look for differences across the population
with a phone an interesting dynamic appear. First, active lines at the time of our follow-up survey,
but whose data we lack permission to use in this study, present highest levels of wealth (columns
5 and 6). These lines include people who were contacted and explicitly declined to participate and
numbers that did not answer in any of the three contact attempts. Second, data suggests there is a
correlation between joining a particular cellphone network and wealth, with cellphone owners who
belong to a network other than Digicel (column 3) presenting lower wealth levels and being more
likely to live in rural areas. There is an apparent self-selection by location and wealth levels into
a person’s decision to contribute his data and choosing a particular network. This raises several
23
The rate of phone ownership is close to 95% for both beneficiaries and non-beneficiaries. This larger than average
rate of cellphone ownership is caused by the sampling strategy and not the result of the WPF providing SIM cards
to eligible households.
24
The sample can be disaggregated at the urban/rural level and seven regions, including the Port-au-Prince
metropolitan area. Given the limited data sources available in Haiti, this is the survey closest to the time of the
program. The latest LSMS survey in Haiti took place in 2011.
25
The Finscope survey has information for a 4,267 people, but only 2,870 (67%) provided a phone number had a
phone, of which only 1,960 were part of the Digicel network. The IRB approved that we could link survey answers
with CDR data in the case where the original survey participant was contacted and provided informed consent (519
cellphone numbers), and when a line had been disconnected for more than six months, making impossible to re
connect with the original survey respondent (613 cellphone numbers). A total of 167 people refused to participate,
and 661 active numbers did not answer to any of our contact attempts.
26
In this case, the PCA to compute the wealth index omitted cellphone ownership from the calculation.
13questions about who we are able to predict socioeconomic indicators using cellphone data, specially
when most studies only gather data from one cellphone provider.
Table 3: Descriptive stats Finscope sample
Owns phone Owns phone: Number in Network-
(1) (2) (3) (4) (5) (6)
No Yes Sig. diff. (i) No Yes Sig. diff.
Yes-No (ii) Matched (iii) No consent (iv) No answer (i)-(ii,iii,iv) (ii)-(iii,iv)
Age HH head 49.62 44.64 *** 43.34 44.4 47.07 46.19 *** ***
(16.24) (14.61) (14.07) (14.48) (12.93) (15.73)
HH size 3.34 3.88 *** 3.82 3.93 3.66 3.96
(1.86) (1.99) (2.08) (1.92) (1.99) (1.97)
Urban 0.62 0.86 *** 0.83 0.89 0.93 0.85 ***
(0.49) (0.34) (0.38) (0.31) (0.25) (0.35)
Food insecure 0.54 0.49 *** 0.5 0.49 0.41 0.49
(0.5) (0.5) (0.5) (0.5) (0.49) (0.5)
Wealth index -0.42 0.2 *** 0.05 0.19 0.64 0.32 *** ***
(0.7) (0.89) (0.84) (0.73) (0.92) (1.11)
Obs. 1,398 2,869 909 1,132 167 661
Note: Author’s calculations using Finscope 2018 and CDR data. Phone ownership is determined at the
household head level. Columns 3 to 6 include only those with a cellphone. Column 3 includes cellphone
owners with a line in a different network. Column 4 includes numbers that agreed to participate as well as
those that were deactivated in the six months prior to our follow-up survey; we can only match the survey
answers of these numbers with their CDR transaction data.
4.3 Regression discontinuity
The WFP conducted its standard scorecard survey to calculate a vulnerability score for each house-
hold in the areas affected by drought. The running score provides us with the basis to evaluate the
impact of the intervention using a RD evaluation. The WFP’s scorecard surveys were administered
before the cutoffs were determined, elimination the possibility that households could precisely ma-
nipulate their eligibility status. In this way, we achieve randomization around the cut-off to assess
the impact between beneficiaries and non-beneficiaries using a traditional regression discontinuity
design. Due to the running variable being discrete, it is relatively difficult to run the regular di-
agnostics to detect precise manipulation of scorecard responses. This type of targeting is one of
the bluntest used by WFP – used when information needs to be quickly gathered so fund or food
assistance can be distributed. While it is manipulable in that those interviewed can misrepresent
their asset holdings, household demographics, and occupations, doing so precisely would be ex-
tremely difficult without either the cut-off score and question set (which differed from area to area)
or the locally committed budget of the program, the per household expenditure, and a prior about
the responses of all others taking the same survey. Figure 4 shows the score distributions for each
commune.
Our Regression Discontinuity design takes the form:
Yi = f (Si ) + ρ1 Ti + εi (1)
where Yi is the outcome variable f (Si ) is some function of the running variable (in this case, Si is
14the normalized targeting score), and Ti is an indicator variable which tracks whether Si is above
or below the threshold which determines treatment status. Conditional on local randomization
at the boundary between beneficiary and non-beneficiary status, ρˆ1 estimates the Local Average
Treatment Effect (LATE) of those at the margin between beneficiary and non-beneficiary status
(Imbens and Lemieux, 2008; Lee and Lemieux, 2010).27
Figure 4: Distributions of Normalized Scores by Commune
Note: Author’s calculations using scorecard survey. Cut-off (at zero) is marked with red. The
heterogeneity of normalized scores by location around the cut-off does not suggest a consistent
pattern of bunching near the cut-off.
We are limited in the forms f can take due to the discrete nature of the running variable. We
commit to a linear functional form as our preferred specification.28
Yi = µ1 + δ1 Si + γ1 Si Ti + ρ1 Ti + ε1i (2)
The main assumption for the RD design is that those who are just beneficiaries should have
similar observable characteristics to the those who just miss the cut-off for beneficiary status. A
27
In this case, we estimate the LATE for a household with a score of zero. A possible robustness check would
instead estimate the LATE for a household with a score of -0.5 or 1. Given the linear specification described below,
we expect this choice should not matter much.
28
Despite the advantages of splines and local linear regressions, we suggest that these usual choices for f will not
be worth exploring. In fact, even third order polynomials may be subject to issues at the boundary point, due to a
limited number of values of the running variable.
15common approach to falsifying regression discontinuity designs is to use a density test for manipu-
lation of the running variable. These allow us to test for discontinuities in the distribution, which
would suggest that beneficiaries have bunched, for example, directly above the cut-off (Mccrary,
2008; Cattaneo et al., 2017). Boilerplate falsification tests for manipulation of the running variable
tend to over-reject in the case of a discrete running variable. These tests tend to depend on the
assumption that as sample size increases; the sample size adjacent to the cut-off will also increase.
With coarse variables, however, the area local to the cut-off does not “fill in.” Thus the density
estimation tends to yield precise but misspecified density estimates on either side of the discon-
tinuity. Moreover, the issues caused by the violation of this assumption become worse as sample
sizes increase and the running variable coarsens. Hence, these tests are of little use in a falsification
exercise and in our context will tend to reject even when manipulation is not present (Frandsen,
2016).
We use a test proposed by Frandsen (2016) which adjusts the McCrary test for use with a
discrete running variable. The intuition here is the same as in other similar tests – changes in
the rate that probability mass is accumulated at a cut-off will indicate bunching in or out of
treatment. We test for continuity of baseline covariates around the treatment threshold. Baseline
characteristics were collected only for treated households, making them of little use. Therefore, we
utilize plausibly invariant characteristics of households from the in-person survey. Balance tests on
the selected variables can be found in Table 4.29 We are not able to reject the null hypothesis that
there is no discontinuity in the distribution at the cutpoint. This result gives us confidence that
households could not precisely target their locations in terms of normalized score.30
29
Specific animal assets contribute to the treatment status. These depend on cut-offs about exactly how many
animals of a given type a household owns. Hence, we include in the balance test a continuous animal stocks aggregated
into tropical livestock units. Poultry is not used to determine eligibility so it is also included in balance test.
30
This test is controlled by a parameter k ≥ 0 which scales the bound the second order finite difference of the
probability mass function. A larger value of k allows for more deviation from linearity in point local to the cut-off,
while k = 0 requires the distribution to be linear at the cut-off. Too low of a k will tend to result in overrejection
and too low will be underpowered. For arbitrarily small values of k > 0 (e.g., k = 1e − 64), We fail to reject the null
hypothesis (p = 1.000)
16Table 4: Individual characteristics: balance Table
Normalized Score
t-stat t-stat
Variablehouseholds consuming food across more days, but restricting meal sizes or number of meals.31
Results of the RD estimations are presented in Table 5. We find an increase in the expenditure
and consumption of food (measured in HTG) as well as the nutritional intake of beneficiary house-
holds in the week prior to the survey. In particular, the program increase food expenditure in 224.5
HTG, and food consumption (including donations and food consumption) in 282.1 HTG. However,
we do not just see more spending by beneficiary households; we also see greater nutritional intake
over the week before the survey as measured by the FCS. In particular, we see a 5.9 unit increase
in the FCS of a base FCS of 40.6 units, significant at a 95% confidence level. To get a sense of
magnitude in terms of food consumption, we can think about this in terms of food categories over
the course of the week. This should be equal to an additional day and a half of proteins or dairy,
two days of pulses, three days of cereals, or six days of fruits and/or vegetables. This increase
in food consumption and nutritional intake is coupled with an increase in the diet diversity. We
see an approximately 0.50 unit increase in the DDS, significant at the 99% confidence level. This
magnitude corresponds to every other household consuming an additional category of food during
the week, and a 5.8pp decrease in the share of consumption going to cereals, see Table 5.
We do not find evidence that the transfer program reduces the usage of coping mechanisms. For
the CSI, beneficiary households have a 0.80 unit reduction in CSI (not significant at any standard
level). Similarly, we see little evidence of impact on disaggregated coping strategies. We suspect
our measurement of the impact on coping mechanisms is limited by the occurrence of hurricane
Matthew. The acute stress may have wiped out access to certain strategies for coping with risk,
while ensuring that accessible strategies are used almost universally. Figure 2A presents a graphical
validation of the RD results at the score cut-off.
Table 5: Effect of Cash Transfer on Indices of Food Security
RD specification
(1) (2) (3) (4) (5) (6)
Food Food
FCS DDS CSI Share Cereal
Expenditure Consumption
Beneficiary 5.880∗ 0.499∗∗ -0.796 224.5∗ 282.1∗∗ -0.0582∗
(2.494) (0.164) (1.483) (91.78) (96.36) (0.0269)
Normalized Score -1.844 -0.155 0.938 -48.36 -66.84 0.0393∗∗
(1.432) (0.0973) (0.840) (47.69) (48.41) (0.0146)
Beneficiary X 1.411 0.0549 -1.153 62.42 54.99 -0.0418∗
Normalized Score (1.753) (0.117) (1.040) (62.72) (65.93) (0.0182)
Observations 1132 1132 1132 1132 1132 1130
R2 0.206 0.192 0.100 0.224 0.208 0.161
Standard errors in parentheses
∗ ∗∗ ∗∗∗
p < 0.05, p < 0.01, p < 0.001
Note: Outcomes variables are part of the in-person questionnaire collected seven months after the cash
transfer implementation.
31
Additionally, only some of the improvement in household welfare is captured by the FCS or DDS because cash
transfers might serve as a substitute for coping strategies otherwise used by the household (Maxwell and Caldwell,
2008).
186 CDR-based Targeting and Evaluation
6.1 Predicting eligibility status
An emergency response intervention requires a fast mechanism to identify potential beneficiaries. In
a context with limited resources, the necessity for speed leads to the implementation of rapid surveys
that identify the most vulnerable with a restricted set of questions. Our objective is to replicate
the program’s assignment of eligibility status using CDR data. We assume the scorecard exercise
represents a “gold-standard” against which we evaluate the capacity of CDR-based methodology to
replicate the identification of beneficiaries. The vulnerability score acts a proxy means test for the
consumption level of participant households, providing a cost-effective way to target aid (Del Ninno
and Mills, 2015).32 As the program lacks any other targeting mechanisms, it is not possible to assess
any miss-classification of potential beneficiaries either by inclusion or exclusion33 For our purposes,
the scorecard exercise provides the ground-truth data for our analysis, and we assume it perfectly
identifies different vulnerability levels, with households with higher scores being objectively more
vulnerable.
There are two main concerns about the usage of the scorecard survey as a targeting tool. First,
this methodology assumes the underlying regressions are error-free or measured with random error.
The program’s implementation of the scorecard survey did not validate the scores against food
consumption –the proxied outcome–and relied instead on previous WFP experience to choose the
variables included in the scorecard survey. This makes it impossible to quantify how effective the
scorecard survey is in distinguishing vulnerability levels across households. We recognize that the
validation of the targeting tool is a relevant concern to guarantee the proper implementation of
social programs. However, assessing the targeting tools is outside the scope of this paper since
our objective is to explore how CDR-based methods, can complement existing strategies. Second,
the WFP used commune-specific eligibility thresholds that were determined by the availability of
resources for each region, allowing for cases where two households with the same vulnerability
score have different eligibility status. Considering that the differences in the cut-offs are small and
households could not precisely target their eligibility status, we assume this to be an additional
form of random miss-classification error that introduces noise into the CDR-based models.34
To evaluate the extent that cellphone usage patterns differ by eligibility status, we perform
a two-sided t-test comparing the means across each sample. We follow (Khaefi et al., 2019) and
classify features into five groups that reflect similar information content. Table 4A provides more
details of the classification:
1. Basic phone usage, e.g., call, text, interactions
2. Active user behavior, e.g., call duration, percent initiated conversations, response delay
3. Spatial behavior, e.g., frequent antennas, number of antennas, the radius of gyration
32
There is ample evidence that similar methods are more efficient and cost-effective than a universal allocation
(Houssou et al., 2019).
33
Systematic reviews of the methodology reveal that it tends to yield relatively low inclusion errors but high
exclusion errors (Brown, Ravallion and Van de Walle, 2018).
34
To reduce the miss-classification error from the community-specific thresholds, we implement additional tests
where we only use the information from the households at the tails of the vulnerability index distribution. Since these
households have the highest (lowest) levels of vulnerability, they would have been eligible (ineligible) independently
of the commune they live. We do not see significant differences in our results.
19You can also read