COSMOS-Europe: a European network of cosmic-ray neutron soil moisture sensors
←
→
Page content transcription
If your browser does not render page correctly, please read the page content below

Earth Syst. Sci. Data, 14, 1125–1151, 2022
https://doi.org/10.5194/essd-14-1125-2022
© Author(s) 2022. This work is distributed under
the Creative Commons Attribution 4.0 License.

           COSMOS-Europe: a European network of cosmic-ray
                   neutron soil moisture sensors
            Heye Reemt Bogena1, , Martin Schrön2, , Jannis Jakobi1 , Patrizia Ney1 , Steffen Zacharias2 ,
                       Mie Andreasen3 , Roland Baatz1 , David Boorman4 , Mustafa Berk Duygu5 ,
       Miguel Angel Eguibar-Galán6 , Benjamin Fersch7 , Till Franke8 , Josie Geris9 , María González Sanchis10 ,
       Yann Kerr11 , Tobias Korf1 , Zalalem Mengistu12 , Arnaud Mialon11 , Paolo Nasta13 , Jerzy Nitychoruk14 ,
       Vassilios Pisinaras15 , Daniel Rasche16 , Rafael Rosolem17 , Hami Said18 , Paul Schattan19 , Marek Zreda20 ,
               Stefan Achleitner19 , Eduardo Albentosa-Hernández6 , Zuhal Akyürek5 , Theresa Blume16 ,
       Antonio del Campo10 , Davide Canone24 , Katya Dimitrova-Petrova9 , John G. Evans4 , Stefano Ferraris24 ,
                Félix Frances6 , Davide Gisolo24 , Andreas Güntner16 , Frank Herrmann1 , Joost Iwema25 ,
               Karsten H. Jensen21 , Harald Kunstmann7,22 , Antonio Lidón10 , Majken Caroline Looms21 ,
            Sascha Oswald8 , Andreas Panagopoulos15 , Amol Patil22 , Daniel Power17 , Corinna Rebmann2 ,
          Nunzio Romano13 , Lena Scheiffele8 , Sonia Seneviratne23 , Georg Weltin18 , and Harry Vereecken1
                 1 Agrosphere          Institute (IBG-3), Forschungszentrum Jülich GmbH, 52425 Jülich, Germany
         2 Department       of Monitoring and Exploration Technologies, Helmholtz Centre for Environmental Research
                                                       GmbH, 04318 Leipzig, Germany
                             3 Geological Survey of Denmark and Greenland, 1350 Copenhagen, Denmark
                                    4 UK Centre for Ecology & Hydrology, Wallingford, OX108BB, UK
                                       5 Water Resources Laboratory of Civil Engineering Department,

                                          Middle East Technical University, 06800 Ankara, Turkey
                                 6 Research Institute of Water and Environmental Engineering (IIAMA),

                                          Universitat Politècnica de València, 46022 Valencia, Spain
          7 Karlsruhe Institute of Technology, Campus Alpine (IMK-IFU), 82467 Garmisch-Partenkirchen, Germany
             8 Institute of Environmental Science and Geography, University of Potsdam, 14476 Potsdam, Germany
                     9 Northern Rivers Institute, School of Geosciences, University of Aberdeen, Aberdeen, UK
                           10 Hydraulic and Environmental Engineering Department, Universitat Politècnica

                                                      de València, 46022 Valencia, Spain
                  11 CNES, CNRS, INRAE, IRD, UPS, CESBIO Université Toulouse 3, 31401 Toulouse, France
                               12 Norwegian Water Resources and Energy Directorate, 0301 Oslo, Norway
       13 Department of Agricultural Sciences, AFBE Division, University of Naples Federico II, Portici, Naples, Italy
             14 Faculty of Economic Sciences and Technology, Pope John Paul II State School of Higher Education,

                                                        95/97, Biala Podlaska, Poland
                       15 Soil and Water Resources Institute, Hellenic Agricultural Organization “DEMETER”,

                                                     57400 Sindos, Thessaloniki, Greece
                 16 Section Hydrology, GFZ German Research Centre for Geosciences, 14473 Potsdam, Germany
                            17 Department of Civil Engineering, University of Bristol, BS81TH Bristol, UK
              18 Department of Nuclear Sciences and Applications, Soil and Water Management and Crop Nutrition

                         Laboratory, Joint FAO/IAEA Centre of Nuclear Techniques in Food and Agriculture,
                                            International Atomic Energy Agency, Vienna, Austria
                                   19 Institute of Geography, University of Innsbruck, Innsbruck, Austria
                   20 Department of Hydrology and Atmospheric Sciences, University of Arizona, Tucson, USA
                                     21 Department of Geosciences and Natural Resource Management,

                                              University of Copenhagen, Copenhagen, Denmark
                             22 Institute of Geography, University of Augsburg, 86159 Augsburg, Germany

Published by Copernicus Publications.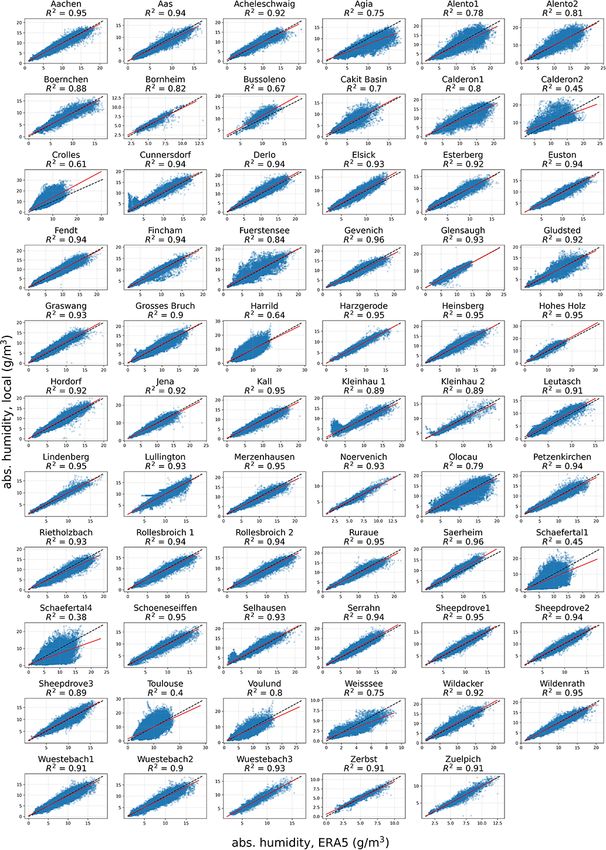
1126                                   H. R. Bogena et al.: A European network of cosmic-ray neutron soil moisture sensors

             23 Department
                         of Environmental Systems Science, CHN N 11, ETH Zürich, 8092 Zurich, Switzerland
              24 Department
                          of Regional and Urban Planning, Polytechnic University of Turin, 10125 Turin, Italy
         25 Wageningen Environmental Research, Wageningen University & Research, Wageningen, the Netherlands
                                     These authors contributed equally to this work.

                                 Correspondence: Heye R. Bogena (h.bogena@fz-juelich.de)

                                 Received: 24 September 2021 – Discussion started: 20 October 2021
                          Revised: 20 January 2022 – Accepted: 3 February 2022 – Published: 11 March 2022

       Abstract. Climate change increases the occurrence and severity of droughts due to increasing temperatures,
       altered circulation patterns, and reduced snow occurrence. While Europe has suffered from drought events in the
       last decade unlike ever seen since the beginning of weather recordings, harmonized long-term datasets across
       the continent are needed to monitor change and support predictions. Here we present soil moisture data from 66
       cosmic-ray neutron sensors (CRNSs) in Europe (COSMOS-Europe for short) covering recent drought events.
       The CRNS sites are distributed across Europe and cover all major land use types and climate zones in Europe.
       The raw neutron count data from the CRNS stations were provided by 24 research institutions and processed
       using state-of-the-art methods. The harmonized processing included correction of the raw neutron counts and a
       harmonized methodology for the conversion into soil moisture based on available in situ information. In addition,
       the uncertainty estimate is provided with the dataset, information that is particularly useful for remote sensing
       and modeling applications. This paper presents the current spatiotemporal coverage of CRNS stations in Europe
       and describes the protocols for data processing from raw measurements to consistent soil moisture products. The
       data of the presented COSMOS-Europe network open up a manifold of potential applications for environmental
       research, such as remote sensing data validation, trend analysis, or model assimilation. The dataset could be
       of particular importance for the analysis of extreme climatic events at the continental scale. Due its timely
       relevance in the scope of climate change in the recent years, we demonstrate this potential application with a
       brief analysis on the spatiotemporal soil moisture variability. The dataset, entitled “Dataset of COSMOS-Europe:
       A European network of Cosmic-Ray Neutron Soil Moisture Sensors”, is shared via Forschungszentrum Jülich:
       https://doi.org/10.34731/x9s3-kr48 (Bogena and Ney, 2021).

1   Introduction                                                    fies temperature and moisture anomalies and intensifies the
                                                                    direct effects of drought and soil water stress. In this re-
The years 2003, 2010, 2015, and 2018 are considered as              spect, ground-based soil moisture measurements are indis-
the most notable years of the 21st century in Europe in             pensable to better understand the land-surface–atmosphere
terms of summer drought and also witnessed numerous heat-           interactions leading to droughts and soil water stress.
related deaths (Stott et al., 2004; Ionita et al., 2017; Laaha et      Recent advances in measurement techniques, such as
al., 2017; Schuldt et al., 2020; Sutanto et al., 2020) and ex-      cosmic-ray neutron probes, allow continuous non-invasive
tensive forest fires (Fink et al., 2004; Grumm, 2011; Turco et      soil moisture measurements that integrate over scales beyond
al., 2017). This has stimulated a debate on how changes in the      the traditional point measurement (Zreda et al., 2012; Bogena
occurrence and characteristics of drought are related to cli-       et al., 2015; Andreasen et al., 2017b). In the 1950s it was dis-
matic variability (e.g., Hanel et al., 2018; Hisdal et al., 2001;   covered that neutron scattering could be used as a method of
Seneviratne et al., 2012; Sheffield et al., 2012). During the       measuring soil moisture (e.g., Gardner and Kirkham, 1952),
most recent heat wave in 2018, daily temperature anoma-             and this was to become the main means of quantifying wa-
lies reached up to 14 ◦ C in Scandinavia and central Europe         ter storage in soils for the next three decades. The neutron
and impacted the energy and carbon balance of European              probe contains a radioactive source that generates fast neu-
terrestrial ecosystems (Graf et al., 2020). This heat wave          trons that are decelerated by the hydrogen of the soil water to
was exacerbated by a drought caused by a persistent cir-            thermal neutrons, so that the detected thermal neutron count
culation anomaly (Kornhuber et al., 2019), which addition-          rate is closely related to the soil water content. Thanks to
ally fostered unprecedented wildfires in Europe (e.g., Yiou         the pioneering work of Topp et al. (1980), from the 1980s
et al., 2020). Recently, Humphrey et al. (2021) have shown          the electromagnetic measurement technology became estab-
that soil moisture variability explains 90 % of the interan-        lished for simple and continuous monitoring of soil moisture
nual variability in global carbon uptake. The corresponding         dynamics. As a result, neutron probes were hardly used any-
feedback between soil moisture and the atmosphere ampli-            more, and interest in neutron scattering in soils declined un-

Earth Syst. Sci. Data, 14, 1125–1151, 2022                                          https://doi.org/10.5194/essd-14-1125-2022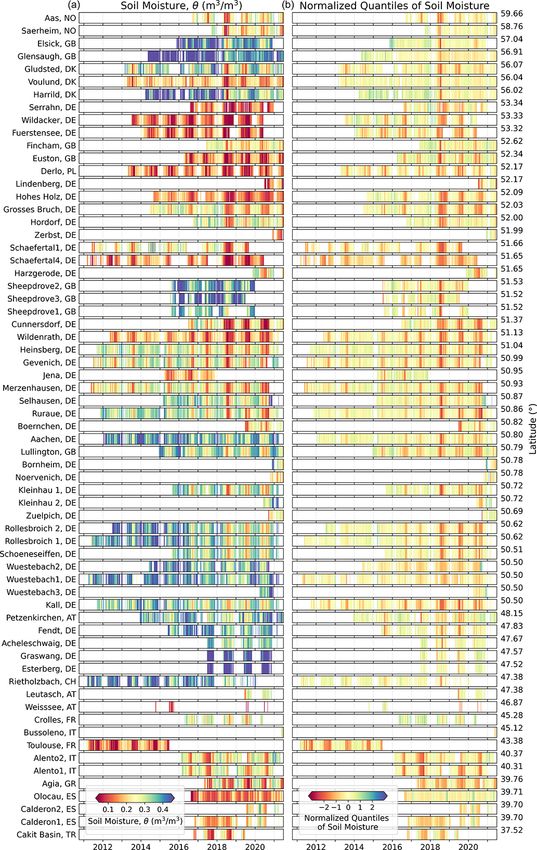
H. R. Bogena et al.: A European network of cosmic-ray neutron soil moisture sensors                                                1127

til the introduction of the cosmic-ray neutron measurement
method (Zreda et al., 2008) generated renewed interest. Re-
cently, neutron scattering is again considered one of the most
promising soil moisture measurement techniques, as cosmic
neutron sensors (CRNSs) provide non-invasive soil moisture
at the field scale with an effective radius of 130 to 240 m and
a penetration depth of 15 to 55 cm depending on soil wet-
ness (Köhli et al., 2015; Schrön et al., 2017). In contrast to
the classical active neutron probe, the CRNS is placed above
ground and detects cosmogenic neutrons. The CRNS can be
calibrated by comparing the neutron count rate with gravi-
metric soil moisture sampling data averaged over the CRNS
footprint by a weighting function (Schrön et al., 2017). The
CRNS shows excellent data acquisition reliability and can be
applied also in vegetated areas with low to medium biomass
such as cropped fields (Rivera Villarreyes et al., 2011; Franz
et al., 2013) and forests (Bogena et al., 2013; Heidbüchel
et al., 2016; Vather et al., 2020). During the last decade,
several studies applied and progressed the CRNS technique
both on stationary and mobile platforms up to the scale of
square kilometers (Fersch et al., 2020; Schrön et al., 2018)
and by monitoring stations installed in a broad variety of cli-
mate conditions, namely continental (e.g., Baatz et al., 2014),
temperate (e.g., Evans et al., 2016), semi-arid (e.g., Zreda
et al., 2012), and tropical (e.g., Hawdon et al., 2014). The
advantages of the CRNS technique have promoted its appli-
cation in various fields, such as hydrology (e.g., Dimitrova-
Petrova et al., 2020a; Schattan et al., 2020), snow monitoring
(e.g., Bogena et al., 2020; Schattan et al., 2017), precipita-
tion monitoring (Franz et al., 2020), vegetation monitoring
                                                                     Figure 1. Locations of the COSMOS-Europe sites (the symbols
(e.g., Franz et al., 2013; Jakobi et al., 2018), validation of re-
                                                                     show the climatic zone to which they belong) as well as sites, which
mote sensing products (e.g., Montzka et al., 2017; Duygu and
                                                                     are currently under construction or sites whose data we could not
Akyürek, 2019), land surface modeling (e.g., Shuttleworth et         use.
al., 2013; Baatz et al., 2017; Brunetti et al., 2019; Iwema
et al., 2017, Patil et al., 2021), and agricultural management
(e.g., Finkenbiner et al., 2018; Li et al., 2019).                   2   Overview of the COSMOS-Europe sites
   According to Andreasen et al. (2017a), there are currently
more than 200 stationary CRNSs operated worldwide, often             For the COSMOS-Europe dataset presented here, CRNS data
as regional networks in hydrological observatories (e.g., Bo-        from 66 sites in 12 European countries (in alphabetical or-
gena et al., 2018; Kiese et al., 2018; Liu et al., 2018) or in en-   der: Austria, Denmark, France, Germany, Greece, Italy, Nor-
tire countries (Zreda et al., 2012; Hawdon et al., 2014; Evans       way, Poland, Spain, Switzerland, Turkey, United Kingdom)
et al., 2016). This paper introduces the network of existing         were collected. The geographical distribution and location of
CRNS stations in Europe (COSMOS-Europe for short) and                the COSMOS-Europe sites is shown in Fig. 1. The key en-
how the data are processed in a harmonized way. We present           vironmental and soil-related physical properties at the sites
the current instrumentation and the protocols developed to           are given in Table 1. The key physical and soil-related site
process the raw measurements and how the CRNS stations               properties relevant to CRNS processing are summarized in
have been recalibrated to derive soil moisture in a more con-        Table 2.
sistent way. Based on the processed CRNS soil moisture time             The COSMOS-Europe sites cover eight climatic zones
series, we then performed a brief analysis on the spatiotem-         (following the Köppen–Geiger climate classification; Beck
poral occurrence of drought events in Europe.                        et al., 2018), with the vast majority of stations located in
                                                                     the humid continental climate zone (n = 34) and in the
                                                                     temperate oceanic climate zone (n = 21). The remaining
                                                                     sites are located in six further climate zones. According to
                                                                     site owner information, the majority of COSMOS-Europe
                                                                     sites are managed grassland (n = 23) and cropland (n = 23),

https://doi.org/10.5194/essd-14-1125-2022                                            Earth Syst. Sci. Data, 14, 1125–1151, 2022
H. R. Bogena et al.: A European network of cosmic-ray neutron soil moisture sensors
https://doi.org/10.5194/essd-14-1125-2022
Table 1. General information of the COSMOS-Europe sites (ordered based on latitude).
Station Country Affiliation Detector Geographic Alt. Main Mean air Mean annual Climate Time
coordinates land use temp. precip. class. period
lat long (m) (◦ C) (mm) start end
Aas1 Norway, NO NVE 59.664 10.762 72 Grassland 6.2a 1240a Dfb 09.2016 07.2021
Saerheim1 Norway, NO NVE 58.761 5.651 91 Grassland 7.7a 2500a Cfb 09.2017 07.2021
Elsick8 Scotland, GB Univ. Aberdeen CRS1000/B 57.039 −2.186 95 Cropland 12.0 800 Cfb 11.2015 12.2020
Glensaugh6 Scotland, GB COSMOS-UK CRS2000/B 56.914 −2.562 399 Moorland 7.0 1109 Cfb 05.2014 06.2021
Gludsted2 Denmark, DK HOBE CRS1000/B 56.071 9.334 86 Plantation 8.2 1050 Dfb 02.2013 06.2021
Voulund2 Denmark,DK HOBE CRS1000/B 56.036 9.156 67 Cropland 8.2 1050 Dfb 02.2013 06.2021
Harrild2 Denmark, DK HOBE CRS1000/B 56.022 9.155 66 Heathland 8.2 1050 Dfb 03.2014 06.2021
Serrahn7 Germany, DE TERENO/GFZ CRS1000 53.339 13.174 96 Forest 9.7a 580 Dfb 08.2016 12.2020
Wildacker7 Germany, DE TERENO/GFZ CRS1000 53.330 13.199 96 Forest 9.7a 580 Dfb 07.2013 12.2020
Fuerstensee7 Germany, DE TERENO/GFZ CRS1000 53.319 13.122 66 Grassland 9.7a 580 Dfb 01.2014 01.2021
Fincham6 England, GB COSMOS-UK CRS2000/B 52.618 0.511 15 Cropland 10.5a 613 Cfb 06.2017 06.2021
Euston6 England, GB COSMOS-UK CRS2000/B 52.383 0.785 18 Grassland 10.0 600 Cfb 03.2016 06.2021
Derlo Poland, PL Univ. Warsaw CRS1000 52.170 23.369 129 Grassland 7.5 550 Dfb 04.2013 06.2021
Lindenberg16 Germany, DE UFZ CRS2000 52.165 14.121 72 Grassland 9.2 576 Dfb 06.2020 today
Hohes Holz7 Germany, DE TERENO/UFZ CRS2000/B 52.090 11.226 217 Forest 10.0a 820a Dfb 08.2014 today
Grosses Bruch7 Germany, DE TERENO/UFZ CRS1000 52.030 11.105 80 Cropland 9.9a 845a Dfb 07.2014 today
Hordorf7 Germany, DE TERENO/UFZ CRS1000 51.997 11.179 82 Cropland 10.0a 818a Dfb 06.2020 today
Zerbst Germany, DE UFZ 2x CRS1000 51.993 12.126 74 Grassland 10.4a 847a Dfb 06.2020 today
Schaefertal1 Germany, DE Univ. Potsdam CRS1000 51.657 11.043 425 Cropland 9.9a 951a Dfb 10.2010 09.2019
Schaefertal4 Germany, DE Univ. Potsdam CRS1000 51.655 11.049 399 Cropland 9.9a 951a Dfb 09.2010 06.2020
Harzgerode7 Germany, DE TERENO/UFZ CRS2000 51.652 11.137 405 Grassland 7.6 582 Dfb 11.2019 05.2021
Sheepdrove25 England, GB Univ. Bristol CRS 2000/B 51.528 −1.468 204 Cropland 9.5 815 Cfb 06.2015 12.2019
Sheepdrove35 England, GB Univ. Bristol CRS 2000/B 51.523 −1.486 182 Cropland 9.5 815 Cfb 07.2015 07.2019
Sheepdrove15 England, GB Univ. Bristol CRS 2000/B 51.515 −1.458 197 Cropland 9.5 815 Cfb 07.2015 12.2019
Earth Syst. Sci. Data, 14, 1125–1151, 2022
Cunnersdorf Germany, DE UFZ CRS1000 51.370 12.557 140 Cropland 10.5a 868a Dfb 06.2016 today
Wildenrath7 Germany, DE TERENO/FZJ CRS1000 51.133 6.169 72 Forest 10.3 722 Cfb 04.2012 today
Heinsberg7 Germany, DE TERENO/FZJ CRS1000 51.041 6.104 58 Cropland 10.3 722 Cfb 09.2011 today
Gevenich7 Germany, DE TERENO/FZJ CRS1000 50.989 6.324 107 Cropland 10.3 718 Cfb 07.2011 today
Jena Germany, DE Univ. Potsdam CRS2000/B 50.951 11.625 140 Grassland 9.9 612 Dfb 03.2015 11.2017
Merzenhausen7 Germany, DE TERENO/FZJ CRS1000 50.930 6.297 91 Cropland 10.3 718 Cfb 02.2011 today
Selhausen7 Germany, DE TERENO/FZJ CRS2000/B 50.866 6.447 101 Cropland 10.3 718 Cfb 03.2015 today
Ruraue7 Germany, DE TERENO/FZJ CRS1000 50.862 6.427 100 Grassland 10.3 718 Cfb 11.2011 today
Boernchen Germany, DE GFZ CRS2000/B 50.819 13.800 571 Cropland 8.9a 986a Dfb 06.2019 06.2021
Aachen7 Germany, DE TERENO/FZJ CRS1000 50.799 6.025 232 Cropland 10.3 865 Cfb 01.2012 today
Lullington6 England, GB COSMOS-UK CRS2000/B 50.794 0.189 199 Heath 10.0 825 Cfb 12.2014 06.2021
Bornheim9 Germany, DE ADAPTER/FZJ Styx V1 50.785 6.956 67 Cropland 10.8a 1071a Cfb 10.2020 today
Noervenich9 Germany, DE ADAPTER/FZJ Styx V1 50.781 6.537 140 Cropland 10.5a 1030a Cfb 11.2020 today
Kleinhau17 Germany, DE TERENO/FZJ CRS2000B 50.722 6.372 374 Grassland 9.0 614 Cfb 08.2015 today
Kleinhau215 Germany, DE MOSES/FZJ CRS2000B 50.718 6.399 394 Reforestation 9.0 614 Cfb 06.2020 today
1128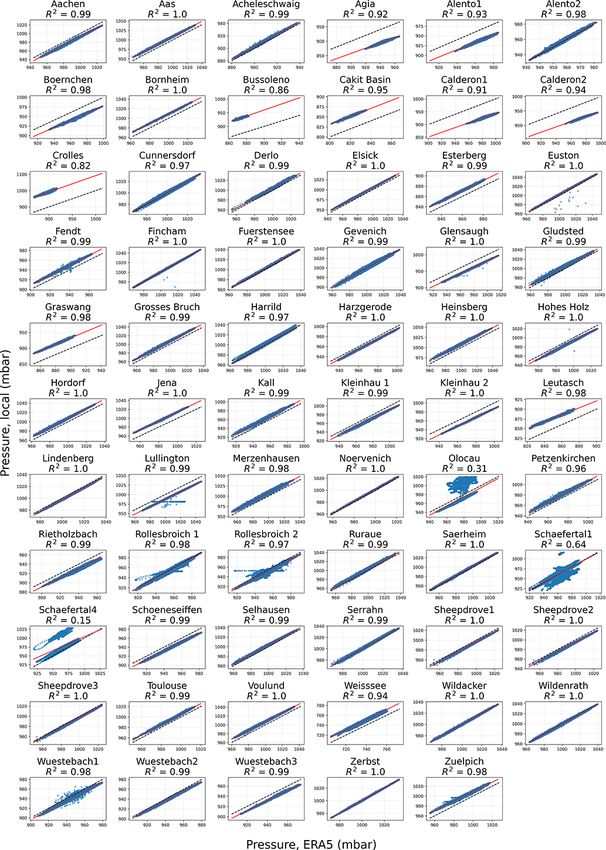
Table 1. General information of the COSMOS-Europe sites (ordered based on latitude).
Station Country Affiliation Detector Geographic Alt. Main Mean air Mean annual Climate Time
coordinates land use temp. precip. class. period
lat long (m) (◦ C) (mm) start end
Zuelpich9 Germany, DE ADAPTER/FZJ Styx V1 50.692 6.717 158 Cropland 10.4a 1009a Cfb 09.2020 today
Rollesbroich27 Germany, DE TERENO/FZJ CRS1000 50.624 6.305 506 Grassland 7.0 1018 Dfb 07.2012 today
Rollesbroich17 Germany, DE TERENO/FZJ CRS1000 50.622 6.304 515 Grassland 7.0 1018 Dfb 05.2011 today
Schoeneseiffen7 Germany, DE TERENO/FZJ CRS2000B 50.515 6.376 611 Grassland 7.0 870 Dfb 08.2015 today
Wuestebach27 Germany, DE TERENO/FZJ CRS2000B 50.505 6.331 607 Forest 7.0 1180 Dfb 06.2014 today
Wuestebach17 Germany, DE TERENO/FZJ CRS1000 50.503 6.333 605 Forest 7.0 1180 Dfb 02.2011 today
Wuestebach37 Germany, DE TERENO/FZJ CRS2000B 50.503 6.336 605 Reforestation 7.0 1180 Dfb 03.2020 today
Kall7 Germany, DE TERENO/FZJ CRS1000 50.501 6.526 505 Grassland 8.0 857 Dfb 09.2011 today
Petzenkirchen4 Austria, AT IAEA CRS1000/B 48.155 15.148 278 Cropland 10.0a 1065a Dfb 12.2013 today
https://doi.org/10.5194/essd-14-1125-2022
Fendt7 Germany, DE TERENO/KIT CRS2000/B 47.832 11.060 595 Grassland 8.4a 1630a Dfb 06.2015 03.2021
Acheleschwaig7 Germany, DE TERENO/KIT CRS2000/B 47.666 10.994 867 Grassland 7.0a 1805a Dfb 06.2017 03.2021
Graswang7 Germany, DE TERENO/KIT CRS2000/B 47.571 11.033 863 Grassland 5.4a 1948a Dfb 06.2017 03.2021
Esterberg7 Germany, DE TERENO/KIT CRS2000/B 47.516 11.158 1267 Grassland 4.3a 2062a Dfc 06.2017 03.2021
Zugspitze12 Germany, DE UFZ CRS1000 47.416 10.979 2900 Bare rock/glacier −4.3 2085 ET 10.2015 today
Rietholzbach Switzerland, CH ETH Zürich CRS1000 47.381 8.993 755 Grassland 7.1 1460 Dfb 12.2010 02.2020
Leutasch3 Austria, AT Univ. Innsbruck CRS2000/B 47.376 11.162 1111 Grassland 4.0a 2155a Dfc 12.2018 today
Weisssee3 Austria, AT Univ. Innsbruck CRS1000, CRS2000/B 46.873 10.714 2464 Sparse Vegetation −2.7a 1547a ET 02.2014 today
Crolles France, FR CESBIO CRS1000 45.281 5.901 230 Grassland 7.5 900 Cfb 07.2016 06.2018
Bussoleno Italy, IT Univ. Polit Turin Finapp 45.118 7.162 625 Forest 12.6 792 Cfb 11.2020 today
Toulouse France, FR CESBIO CRS1000 43.385 1.292 188 Grassland 13.6 1028a Cfa 02.2011 08.2018
Alento210 Italy, IT Univ. Naples CRS2000/B 40.365 15.184 453 Orchard 15.4 1215 Csa 02.2016 08.2021
Alento110 Italy, IT Univ. Naples CRS2000/B 40.311 15.229 671 Forest 13.6 1255 Csa 02.2016 08.2021
Agia14 Greece, GR PHO CRS2000/B 39.755 22.717 1032 Shrubland 12.5 1003 Csb 03.2017 today
Olocau Spain, ES UFZ CRS1000 39.707 −0.517 415 Shrubland 16.2a 544a BSk 01.2017 09.2020
Calderona1 Spain, ES Univ. Valencia CRS2000/B 39.708 −0.457 785 Shrubland 16.6a 525a BSk 10.2016 06.2021
H. R. Bogena et al.: A European network of cosmic-ray neutron soil moisture sensors
Calderona2 Spain, ES Univ. Valencia CRS2000/B 39.708 −0.457 789 Shrubland 16.6a 525a BSk 07.2019 06.2021
Cakit Basin13 Turkey, TR METU CRS2000/B 37.515 34.498 1459 Shrubland 9.8 338 BSk 11.2016 07.2019
a Derived from ERA5 data. 1 Part of the groundwater and soil moisture monitoring network of the Norwegian water resources and energy directorate operated since 1998 and 1999, respectively. 2 Part of the Danish Hydrological Observatory, HOBE
(http://www.hobe.dk/, last access: 2 March 2022). Data are partly published by Andreasen et al. (2019; 2020) with more information on the field sites. 3 Part of the Moosbeere network operated by the University of Innsbruck. The Weisssee station is located
on rocky terrain and not suited for soil moisture analysis. 4 Part of the Hydrological Open Air Laboratory (HOAL, https://hoal.hydrology.at/the-hoal, last access: 2 March 2022), which is a cooperation project between the Federal Agency for Water
Management (BAW Petzenkirchen) and the Vienna University of Technology (TU Wien). More information about the site can be found in Blöschl et al. (2016). 5 Located at the Sheepdrove Organic Farm in the UK. More information about the site can be
found in Iwema et al. (2021), Schrön et al. (2017), and Berthelin et al. (2020). 6 Part of the COSMOS-UK network operated by the UK Centre for Ecology & Hydrology. Further information about the sites and COSMOS-UK is presented in Cooper et
al. (2021). 7 Part of the German Terrestrial Environmental Observatories (TERENO) network (https://www.tereno.net/, last access: 2 March 2022). 8 The CRNS is placed at the corner of three adjacent agricultural fields. Further information about the site can
be found Dimitrova-Petrova et al. (2020a; 2020b; 2021). 9 Part of the ADAPTER (ADAPT TERrestrial systems) project (https://www.adapter-projekt.de/, last access: 2 March 2022; Ney et al., 2021). 10 Part of Alento Hydrological Observatory (AHO) in
southern Italy established in 2016 by the University of Naples in cooperation with Forschungszentrum Jülich GmbH (Romano et al., 2018; Nasta et al., 2020). 11 Due to a malfunction, the detector had to be replaced. To ensure a consistent time series, the
neutron counts 1 year before and after the replacements were compared, and the time series after the replacement were adjusted accordingly. 12 The Zugspitze sensor is located in the Schneefernerhaus (UFS) observatory and surrounded by rocky mountain
terrain and not suited for soil moisture analysis. 13 Operated by the Water Resources Laboratory of Middle East Technical University. 14 Part of the Pinios Hydrologic Observatory (PHO) in central Greece established in 2017 by the Soil and Water Resources
Institute, Hellenic Agricultural Organization “DEMETER”, in cooperation with Forschungszentrum Jülich GmbH (Pisinaras et al., 2018; Bogena et al., 2020). 15 Part of the MOSES (Modular Observation Solutions for Earth Systems) project
(https://www.ufz.de/moses/, last access: 2 March 2022). 16 DWD – Deutscher Wetterdienst (2021).
Earth Syst. Sci. Data, 14, 1125–1151, 2022
1129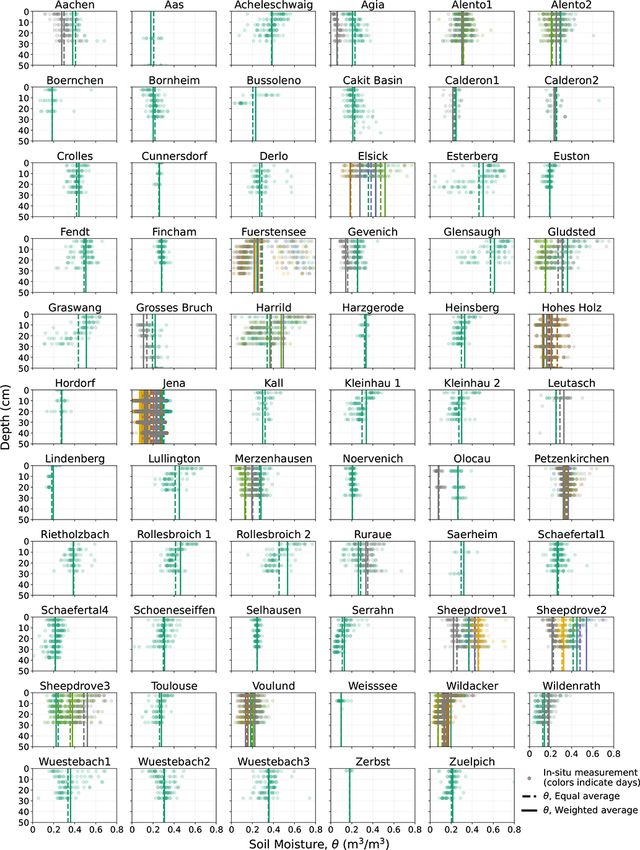
H. R. Bogena et al.: A European network of cosmic-ray neutron soil moisture sensors
https://doi.org/10.5194/essd-14-1125-2022
Table 2. Physical quantities of the COSMOS-Europe sites.
Station Porosity Bulk Soil Lattice Cutoff N0b Mean raw Mean corrected Mean Soil Mean Mean References
density1 organic water1 rigidity epithermal epithermal soil moisture Footprint Footprint
carbon1 neutrons neutrons moisture range depth radius
(g cm−3 ) (g g−1 ) (g g−1 ) (GV) (cts h−1 ) (cts h−1 ) (cts h−1 ) (m3 m−3 ) (m3 m−3 ) (m) (m)
Aas, NO 0.579 1.029 0.082a 0.034a 1.21 2788 1744 1484 0.227 0.058–0.463 0.256 155.6 –
Saerheim, NO 0.496 1.146 0.150a 0.016a 1.31 2861 1863 1552 0.218 0.00–0.455 0.229 146.8 –
Elsick, GB 0.587 0.997 0.094 0.032 1.61 3071 1828 1537 0.392 0.124–0.587 0.187 118.7 Dimitrova-Petrova et al. (2020a)
Glensaugh, GB 0.838 0.356 0.182 0.012 1.59 2807 1834 1185 0.469 0.200–0.837 0.464 121.6 Cooper et al. (2021)
Gludsted, DK 0.637 0.814 0.163 0.002 1.87 1560 849 778 0.297 0.059–0.634 0.243 120.5 Andreasen et al. (2019, 2020)
Voulund, DK 0.453 1.388 0.045 0.004 1.87 1677 1135 1078 0.187 0.000–0.361 0.208 155.3 Andreasen et al. (2019, 2020)
Harrild, DK 0.642 0.873 0.086 0.001 1.87 1423 792 715 0.383 0.028–0.642 0.228 121.1 Andreasen et al. (2019, 2020)
Serrahn, DE 0592 1.014 0.064 0.002 2.50 769 551 491 0.124 0.013–0.285 0.326 168.8 Heinrich et al. (2018)
Wildacker, DE 0.577 1.095 0.025 0.003 2.50 799 613 563 0.115 0.009–0.245 0.368 183.4 Heidbüchel et al. (2016)
Fuerstensee, DE 0.559 1.135 0.031 0.002 2.51 1085 794 740 0.134 0.011–0.323 0.326 174.5 Heinrich et al. (2018)
Fincham, GB 0.507 1.283 0.019 0.007 2.65 2655 1785 1656 0.236 0.091–0.346 0.213 147.7 Cooper et al. (2021)
Euston, GB 0.529 1.214 0.029 0.003 2.69 2667 1951 1833 0.145 0.003–0.280 0.301 174.0 Cooper et al. (2021)
Derlo, PL 0.453 1.430 0.015a 0.043 2.79 1128 846 756 0.136 0.000–0.352 0.232 168.1 Zreda et al. (2015)
Lindenberg, DE 0.442 1.454 0.019a 0.012a 2.80 1999 1643 1461 0.136 0.000–0.298 0.263 173.1 –
Hohes Holz, DE 0.561 1.136 0.031a 0.038 2.81 743 561 459 0.143 0.046–0.283 0.326 168.8 Wollschläger et al. (2017)
Grosses Bruch, DE 0.534 1.176 0.050 0.048 2.85 903 568 516 0.233 0.086 – 0.410 0.215 134.2 Wollschläger et al. (2017)
Hordorf, DE 0.506 1.278 0.025a 0.043a 2.87 1067 700 625 0.249 0.074–0.475 0.190 135.2 –
Zerbst, DE 0.438 1.408 0.058 0.018a 2.81 1141 865 755 0.130 0.000–0.231 0.211 162.1 –
Schaefertal1, DE 0.537 1.185 0.037 0.010 2.91 1168 985 675 0.233 0.058–0.536 0.216 146.1 Wollschläger et al. (2017)
Schaefertal4, DE 0.607 1.010 0.033 0.010 2.91 968 906 618 0.143 0.000–0.606 0.327 174.4 Wollschläger et al. (2017)
Harzgerode, DE 0.506 1.282 0.021a 0.047a 2.97 2013 1774 1169 0.253 0.093–0.423 0.188 139.2 –
Sheepdrove2, GB 0.566 1.100 0.046 0.031 2.90 2724 1774 1425 0.385 0.197–0.566 0.180 119.7 Iwema et al. (2021)
Sheepdrove3, GB 0.586 1.048 0.046 0.031 2.90 2698 1683 1377 0.419 0.213–0.586 0.182 118.8 Iwema et al. (2021)
Sheepdrove1, GB 0.480 1.335 0.033 0.031 2.90 2636 1818 1471 0.348 0.174–0.480 0.158 122.3 Iwema et al. (2021)
Cunnersdorf, DE 0.428 1.491 0.018 0.030 2.94 1079 808 699 0.201 0.004–0.424 0.198 151.2 –
Wildenrath, DE 0.565 1.126 0.025 0.002 2.98 964 684 628 0.173 0.039–0.375 0.290 166.9 Bogena et al. (2018)
Heinsberg, DE 0.530 1.215 0.026 0.010 3.03 1192 725 713 0.259 0.064–0.440 0.211 138.8 Bogena et al. (2018)
Gevenich, DE 0.496 1.318 0.014 0.013 3.04 1158 782 715 0.257 0.056–0.496 0.215 127.2 Bogena et al. (2018)
Earth Syst. Sci. Data, 14, 1125–1151, 2022
Jena, DE 0.482 1.340 0.025 0.028 3.09 2229 1621 1432 0.175 0.065–0.245 0.220 159.6 Fischer et al. (2015, 2019)
Merzenhausen, DE 0.500 1.310 0.012 0.015 3.09 1143 767 715 0.238 0.063–0.440 0.210 147.6 Bogena et al. (2018)
Selhausen, DE 0.514 1.276 0.010 0.023 3.10 997 652 583 0.295 0.081–0.514 0.186 132.8 Bogena et al. (2018)
Ruraue, DE 0.575 1.102 0.022 0.020 3.05 1049 665 598 0.286 0.071–0.526 0.220 134.5 Bogena et al. (2018)
Boernchen, DE 0.592 1.037 0.042 0.006 3.10 2762 2811 1599 0.222 0.080–0.410 0.250 150.6 –
Aachen, DE 0.571 1.112 0.023 0.033 3.15 1134 764 605 0.369 0.147–0.570 0.185 122.9 Bogena et al. (2018)
Lullington, GB 0.676 0.821 0.047 0.005 3.03 2524 1515 1329 0.308 0.125–0.643 0.280 129.3 Cooper et al. (2021)
Bornheim, DE 0.513 1.276 0.011 0.021 3.07 2343 1503 1350 0.303 0.151–0.513 0.181 133.1 –
Noervenich, DE 0.524 1.250 0.010 0.019 3.15 2195 1673 1380 0.213 0.123–0.346 0.225 155.9 –
Kleinhau1, DE 0.599 1.019 0.042 0.030 3.09 905 710 493 0.296 0.078–0.478 0.221 131.9 Bogena et al. (2018)
Kleinhau2, DE 0.622 0.897 0.110 0.024 3.09 2576 1965 1286 0.341 0.183–0.545 0.215 122.5 –
Zuelpich, DE 0.487 1.343 0.012 0.016 3.12 1920 1403 1190 0.247 0.062–0.348 0.196 145.7 –
Rollesbroich2, DE 0.623 0.944 0.058 0.027 3.19 1043 855 536 0.347 0.121–0.623 0.215 127.2 Bogena et al. (2018)
Rollesbroich1, DE 0.596 1.032 0.039 0.032 3.10 1146 936 600 0.352 0.094–0.595 0.199 126.9 Bogena et al. (2018)
Schoeneseiffen, DE 0.609 1.000 0.038 0.036 3.19 950 897 504 0.305 0.111–0.519 0.214 131.8 Bogena et al. (2018)
Wuestebach2, DE 0.832 0.417 0.070 0.024 3.28 2530 1910 1110 0.388 0.209–0.831 0.457 124.3 Bogena et al. (2018)
Wuestebach1, DE 0.713 0.697 0.088 0.025 3.28 1289 853 608 0.395 0.204–0.688 0.265 123.5 Bogena et al. (2018)
1130
Wuestebach3, DE 0.687 0.770 0.078 0.028 3.28 866 763 415 0.392 0.238–0.616 0.242 123.4 Bogena et al. (2018)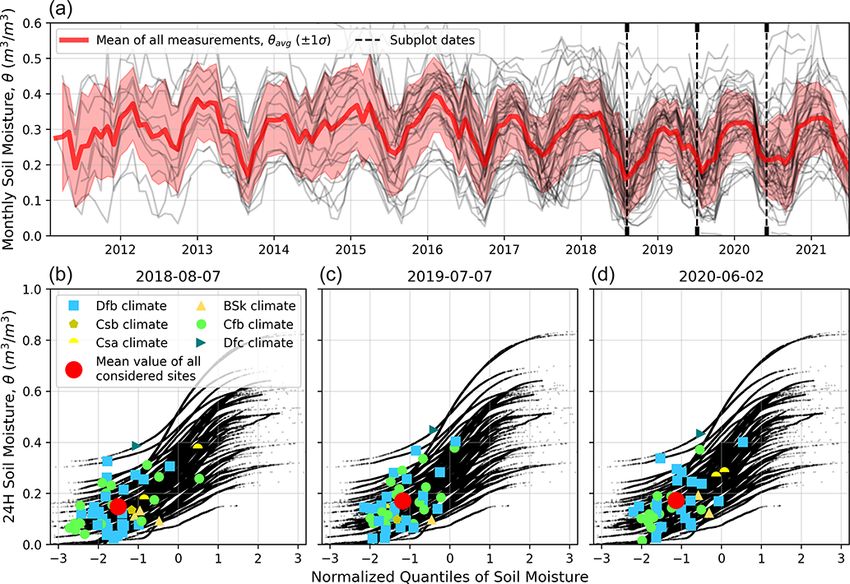
Station                     Porosity       Bulk          Soil         Lattice       Cutoff             Nb0      Mean raw       Mean corrected         Mean              Soil      Mean        Mean     References
                                                                                        density1       organic      water1       rigidity                    epithermal         epithermal          soil         moisture    Footprint   Footprint
                                                                                                       carbon1                                                 neutrons            neutrons        moisture         range       depth      radius
                                                                                        (g cm−3 )      (g g−1 )     (g g−1 )      (GV)        (cts h−1 )       (cts h−1 )         (cts h−1 )      (m3 m−3 )     (m3 m−3 )         (m)         (m)

https://doi.org/10.5194/essd-14-1125-2022
                                              Kall, DE                      0.625        0.959         0.038        0.037          3.22            1262             984                    662     0.319      0.135–0.604       0.221       128.3    Bogena et al., 2018
                                              Petzenkirchen, AT             0.501        1.317         0.004        0.039          4.06            1344             986                    750     0.352      0.154–0.501       0.159       125.2    Franz et al. (2016, 2020)
                                              Fendt, DE                     0.719        0.725         0.030        0.011          4.08            2318            1937                   1127     0.384      0.242–0.535       0.277       124.7    Fersch et al. (2020)
                                              Acheleschwaig, DE             0.658        0.853         0.063        0.023          4.15            2333            2557                   1163     0.337      0.161–0.466       0.233       128.8    –
                                              Graswang, DE                  0.728        0.690         0.045        0.037          4.23            2335            2308                   1052     0.474      0.303–0.613       0.253       125.3    Kiese et al. (2018)
                                              Esterberg, DE                 0.757        0.567         0.125        0.094          4.25            2213            2870                    933     0.520      0.324–0.699       0.272       130.8    –
                                              Zugspitze, DE                   –             –          –            –              4.17               –               –                      –       –                  –           –           –    –
                                              Rietholzbach, CH              0.617        0.964         0.052        0.032          4.22            1150            1101                    569     0.397      0.162–0.589       0.194       126.2    Seneviratne et al. (2012)
                                              Leutasch, AT                  0.552        1.120a        0.0601       0.0511         4.28            2056            3002                   1038     0.272      0.085–0.373        0.18       136.3    Schattan et al. (2019a, b)
                                              Weisssee, AT                  0.562        1.110a        0.0471       0.0311         4.42            1103            3971                    521     0.070      0.000–0.152       0.467       232.4    Schattan et al. (2019a, b)
                                              Crolles, FR                   0.368        1.612         0.040        0.039          4.90             928             671                    538     0.262      0.035–0.368       0.133       127.5    –
                                              Toulouse, FR                  0.486        1.354         0.008        0.030          5.51             890             706                    623     0.139      0.013–0.311        0.27       174.8    –
                                              Bussoleno, IT                 0.521        1.230a        0.032a       0.052a         4.72            2158            2524                   1302     0.193      0.057–0.410       0.218       152.6    –
                                              Alento2, IT                   0.560        1.126         0.037        0.055          6.87            2029            1743                   1153     0.243      0.070–0.475       0.212       135.4    Nasta et al. (2020)
                                              Alento1, IT                   0.652        0.858         0.075        0.036          6.87            1814            1739                    971     0.243      0.091–0.479       0.268       134.2    Nasta et al. (2020)
                                              Agia, GR                      0.511        1.258         0.031a       0.059          7.17            1988            2948                   1183     0.210      0.052–0.511       0.216       165.2    Pisinaras et al. (2018)
                                              Olocau, ES                    0.453        1.426         0.017        0.005          7.36             777             757                    558     0.144      0.010–0.321       0.258       182.6    –
                                              Calderona1, ES                0.542        1.177         0.032        0.006          7.36            1980            2420                   1251     0.193      0.112–0.400       0.251       166.7    González-Sanchis et al. (2020)
                                              Calderona2, ES                0.514        1.252         0.029a       0.0421         7.36             871            1013                    515     0.237      0.117–0.507       0.226       161.6    González-Sanchis et al. (2020)
                                                                                                                                                                                                                                                                                      H. R. Bogena et al.: A European network of cosmic-ray neutron soil moisture sensors

                                              Cakit Basin, TR               0.433        1.482         0.014a       0.0541         8.37            1798            3826                   1103     0.177      0.061–0.391       0.202       185.8    Duygu and Akyürek (2019)
                                             1 Weighted after Schrön et al. (2017). a From SoilGrids. b N : calibration parameter of the cosmic ray neutron probe calibration function (Eq. 8).
                                                                                                         0

Earth Syst. Sci. Data, 14, 1125–1151, 2022
                                                                                                                                                                                                                                                                                      1131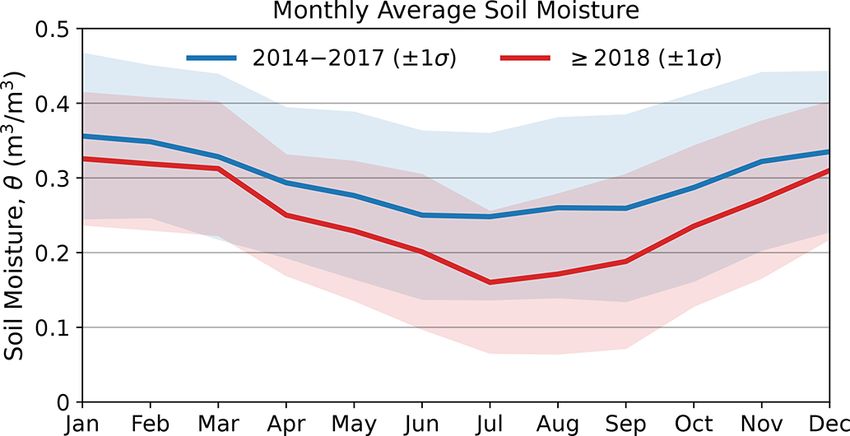
1132                                   H. R. Bogena et al.: A European network of cosmic-ray neutron soil moisture sensors

while the remaining sites are covered by forest (n = 7), for-       cilitated a more accurate extraction of the soil moisture sig-
est clear-cut (n = 1), shrubland (n = 5), heathland (n = 2),        nal from the cosmic-ray neutron data. The processing frame-
orchard/plantation (n = 2), bare rock/glacier (n = 1), moor-        work is described below, while its technical implementation
land (n = 1), and sparse vegetation (n = 1).                        is supported by public tools and software libraries dedicated
   The soils of the COSMOS-Europe sites range from                  to CRNS research, e.g., Corny by Schrön (2021) and Crspy
organic soils with a high organic matter content (max:              by Power et al. (2021).
0.173 g g−1 ) to mineral soils with very low organic matter
content (min: 0.004 g g−1 ). This variability is also reflected     3.1   Data pre-processing
in the wide range of soil porosities ranging from 0.365 to
0.841. Two of the sites, Weisssee and Zugspitze, are located        In a first step, all datasets, i.e., raw neutron counts and sup-
in rocky, alpine terrain. The Weisssee data only show lim-          porting data, were aggregated to hourly time steps. Subse-
ited and short snow-free periods where soil moisture data are       quently, following Zreda et al. (2008), a running 24 h average
available and with high uncertainties due to the difficult soil     with a minimum of 12 measurements in the smoothing win-
sampling in that area. The data from Zugspitze are not used         dow was used to reduce the inherent noise of the raw neutron
for soil moisture analysis due to the absence of soil but offer     counts and to reduce the measurement uncertainty.
great potential for other hydrological studies, such as snow           To ensure data consistency, the raw neutron counts were
water equivalent monitoring.                                        screened for data quality. Suspicious neutron count rates
   The measurements of neutron count rates and correspond-          (Nraw ) that fulfill one of the following conditions were
ing correction data (i.e., atmospheric pressure and air humid-      flagged.
ity) at the COSMOS-Europe sites cover very different peri-
ods of time (cf. Fig. 2 and Table 1). The shortest time se-           – Extreme single outliers: Nraw 10 000
ries comes from the Zerbst site, which was put into operation           counts per hour (cts h−1 ).
in late 2020. The longest time series from the Wuestebach1
                                                                      – Positive suspicious peaks: Nraw >24 h moving average
site spans a period of approximately 10 years (mid-2011 to
                                                                        +2 times the standard deviation of the 24 h rolling sum.
present). The average length of the observation periods of all
sites is 5.7 years (±2.78).                                           – Negative suspicious peaks: Nraw
H. R. Bogena et al.: A European network of cosmic-ray neutron soil moisture sensors 1133 Figure 2. Availability of atmospheric pressure, absolute humidity, and neutron count rates at the COSMOS-Europe sites (sorted by descend- ing latitude). The dates of the local reference soil sampling for CRNS calibration are also shown. The timeline shown ends in June 2021, while data and calibration dates for some sensors extend to November 2021. https://doi.org/10.5194/essd-14-1125-2022 Earth Syst. Sci. Data, 14, 1125–1151, 2022
1134                                  H. R. Bogena et al.: A European network of cosmic-ray neutron soil moisture sensors

negative influences to avoid inexperienced users using unre-      regionally variable values for β according to Desilets and
alistic soil moisture data.                                       Zreda (2003) and Desilets et al. (2006), but found only neg-
   The local air temperature, air humidity, and atmospheric       ligible variations over Europe. However, future work should
pressure data needed for the correction of raw neutron counts     further investigate the influence of local β variability on the
often contained gaps due to measurement failure or due to         atmospheric pressure correction.
removing suspicious data using max/min filters (see Fig. 2).
These data gaps were filled with ERA5 data following the          3.2.2   Air humidity correction
idea of Power et al. (2021). To ensure consistency of the data,
linear regression models of the individual data time series       We accounted for the effect of atmospheric water vapor fluc-
were created to scale the ERA5 data to the local data prior       tuations on neutron count rate using the approach of Rosolem
to gap filling. Linear regression is necessary to compensate      et al. (2013):
for differences in bias and slope, e.g., because due to the low
                                                                  Ch = 1 + αh,                                                (3)
spatial resolution of ERA5 (∼ 31 km), the average altitude,
humidity, and atmospheric pressure for the ERA5 grid does         with α = 0.0054 and h the absolute humidity (g m−3 ) mea-
not match those at the COSMOS-Europe site. These devia-           sured at 2 m height.
tions occur especially in the high mountains due to strong el-
evation differences, e.g., for atmospheric pressure at the Leu-
                                                                  3.2.3   Incoming neutron correction
tasch site (see Fig. A2). The regression analysis showed that
the ERA5 data mostly agreed well with the local measure-          The galactic cosmic radiation, or incoming radiation I (t),
ments (Figs. A1 and A2), with mean correlations between           that penetrates the upper atmosphere varies in time mainly
ERA5 and local measurements of 0.95 for atmospheric pres-         due to the well-known 11-year cycle of the solar activ-
sure and 0.86 for absolute humidity. When the correlation         ity. At high solar power (the solar maximum), the stronger
coefficients for humidity and atmospheric pressure were less      solar magnetic field deflects a larger proportion of galac-
than 0.7 and 0.8, respectively, the local measurements were       tic particles away from Earth and reduces I (t). Conversely,
replaced entirely by ERA5 data to avoid inconsistencies in        during low solar activity (the solar minimum) the weaker
the gap-filled time series.                                       solar magnetic field allows more galactic protons to en-
                                                                  ter the atmosphere increasing I (t). Shorter-term fluctuations
3.2     Correction of raw neutron counts                          have a similar effect on I (t) but with lower amplitude.
                                                                  Changes in the shape of the geomagnetic field, which oc-
Variations of the incoming cosmic-ray intensity can have          cur on timescales from years to decades, are of secondary
many causes, from galactic and solar disturbances to atmo-        importance compared to temporal fluctuations of I (t). These
spheric and meteorological influences. Most of these anoma-       temporal variations are measured locally with so-called neu-
lies are expected to change proportionally in every domain        tron monitors (NM), which are sensitive to high-energy sec-
of the neutron energy spectrum and thus can be addressed by       ondary neutrons (>20 MeV) but insensitive to local envi-
applying a set of correction factors,                             ronmental factors (Simpson, 2000). The incoming radiation
                                                                  varies also spatially with strong gradients from the pole
N = Nraw · Cp · Ch · Cinc · Cveg .                         (1)    to the Equator, corresponding to the cutoff rigidity of the
                                                                  Earth’s magnetic field. A worldwide network of NM sta-
The determination of the correction factors is explained in
                                                                  tions provides near-real-time access to incoming cosmic-ray
the following.
                                                                  data (https://www.nmdb.eu/, last access: 2 March 2022). As-
                                                                  suming that the incoming radiation along the rigidity lines
3.2.1    Atmospheric pressure correction                          is similar, a nearby NM should be able to provide repre-
Since the cosmic-ray flux through the atmosphere is expo-         sentative data for other places on Earth with similar cutoff
nentially attenuated as a function of the traversed cumula-       rigidity Rcut . The local Rcut can be estimated for individual
tive mass, measured neutron count rates can be normalized         CRNS stations using approaches provided by Bütikofer et
to standard atmospheric pressure by applying the standard         al. (2007). Since every detector comes with an individual ef-
pressure correction approach (Desilets and Zreda, 2003):          ficiency, the value I (t) could be normalized with an arbitrary
                                                                  but constant reference Iref , which we chose to be 150 cts h−1 .
Cp = eβ(P −P0 ) ,                                          (2)    However, NM stations are rare, representing only a few lat-
                                                                  itudes and often not providing continuous signals over long
where Cp is atmospheric pressure correction factor, P0 is the     periods of time. The NM at Jungfraujoch (Switzerland) is one
reference atmospheric pressure (1013.25 hPa), P is the ac-        of the few stations that provides reliable long-term data that
tual atmospheric pressure, and β = 0.0076 is the baromet-         can be used for COSMOS stations in Europe due its central
ric coefficient that is related to the local mass attenuation     location. Hence, scaling of the Jungfraujoch signal is needed
length of neutrons in air. We also tested the application of      to match the widespread distribution of COSMOS stations

Earth Syst. Sci. Data, 14, 1125–1151, 2022                                        https://doi.org/10.5194/essd-14-1125-2022
H. R. Bogena et al.: A European network of cosmic-ray neutron soil moisture sensors 1135
in Europe. According to Schrön et al. (2016), the intensity annulus A are arithmetically averaged and thus receive the
correction factor can be calculated as follows: same weights, which are calculated according to the weight-
ing scheme of Schrön et al. (2017). More specifically, θhoriz
I
Cinc = 1 + γ − 1 −1 , (4) is integrated over the entire domain to find the radii r1 and
Iref r2 that define the five annuluses A(r1 , r2 ) within which all
in which I is the count rate of incoming cosmic-ray neutrons samples are equally averaged:
of a neutron monitoring station, Iref is the incoming count 5
rate at an arbitrary time, and is an amplitude scaling factor 1X
θhoriz = θA ,where θA = hθr i ∀r ∈ (r1 , r2 )
to adjust for the mentioned geomagnetic effects. It depends 5 A=1
on the cutoff rigidity of the local site and the neutron moni- Zr2 Z∞
tor used (see, e.g., Hawdon et al., 2014). For this paper, we A
with Wr dr = Wr dr. (7)
use the approach from Hawdon et al. (2014) to bridge the 5
r1 0
regional difference of cutoff rigidities between the local site
and the NM. In particular, this method ensures that soil samples taken us-
ing the outdated COSMOS scheme (25, 75, 200 m), which
3.2.4 Biomass correction assumed larger CRNS footprints, are not double weighted.
Due to the long distances of the COSMOS sampling scheme,
Biomass can affect neutron count rates and should be con-
there may be no soil samples in one annulus. In this case, the
sidered when large temporal changes in biomass occur at
samples in the next larger ring receive double the weight; i.e.,
a CRNS site. Therefore, we consider the biomass correc-
the soil samples taken at 25 m distance are also representative
tion method proposed by Baatz et al. (2015) using the dry
for the soil moisture in the first annulus around the sensor.
biomass B in kg m2 :
This problem does not arise for COSMOS-Europe sites sam-
Cveg = [1 − 0.009248B]−1 . (5) pled according to the revised weighting scheme of Schrön et
al. (2017), as soil samples were also taken in the near field of
This correction was applied at the Wuestebach1 site, where a the CRNS (i.e., 2–10 m distances). The in situ reference soil
large change in biomass had occurred in the CRNS footprint moisture of COSMOS-Europe sites and the weighted aver-
area due to clear-cutting of a forest. For the other sites, there ages used for the CRNS soil moisture calibration are pre-
were no strong biomass changes or no detailed information sented in Fig. A4.
on biomass changes was available. As soon as changes in the
biomass occur or information for a site is available, these can 3.3.2 Conversion of neutron count rate to soil moisture
be taken into account.
To convert neutron count rates to soil moisture, we used the
conventional relationship between neutrons and soil moisture
3.3 Sensor calibration
initially introduced by Desilets et al. (2010). According to
3.3.1 In situ reference soil data Köhli et al. (2021), it can be expressed in an equivalent but
more unambiguous formulation with fewer parameters:
For the calibration, we used in most cases available infor-
mation on gravimetrically measured soil moisture from soil 0.0808 1 − N/Nmax
samples taken within the CRNS footprint. The soil samples θ (N) = − 0.115 ≡ p0 , (8)
N/N0 − 0.372 p1 − N/Nmax
were weighted vertically according to Schrön et al. (2017);
i.e., for each sample at depth d and penetration depth D, we where Nmax is the maximum neutron flux under dry condi-
evaluate the weight in the representative sample volume (d1 tions which mainly depends on the individual detector sen-
to d2 ) to generate the profile average soil moisture: sitivity. Parameters p0 = −0.115, p1 = 0.346, and Nmax =
1.075 · N0 can be derived from the parameters used so far
P Zd2 in the Desilets equation. Calibrated values for N0 of the
θd wd
θprofile = P , where wd = wd dd ∝ Wd1 − Wd2 . (6) COSMOS-Europe sites are given in Table 2.
wd Hydrogen in the organic matter as well as the lattice water
d1
content of soils affects how epithermal neutrons interact with
In addition, we applied horizontal weighting of the verti- the soil and thus affects the shape of the calibration function
cally averaged in situ soil moisture according to Schrön et (Zreda et al., 2012). We accounted for this effect by fitting
al. (2017). For this, regions of equal contribution (annuluses Nmax of the calibration to the total soil water, which is the
of 20 % quantiles) to the neutron signal were defined depend- sum of the water equivalents of lattice water and organic mat-
ing on the local conditions (i.e., atmospheric pressure, air hu- ter and the gravimetrically measured reference soil moisture.
midity, average soil moisture) that influence the spatial sen- The volumetric soil moisture is then obtained by subtract-
sitivity of the CRNS. All sampling points that fall within an ing the lattice and organic matter water from CRNS total soil
https://doi.org/10.5194/essd-14-1125-2022 Earth Syst. Sci. Data, 14, 1125–1151, 20221136 H. R. Bogena et al.: A European network of cosmic-ray neutron soil moisture sensors
moisture multiplied with the soil density. We averaged the organic carbon), air humidity, and pressure. Subsequently,
soil property values, in case multiple calibration dates were we obtained the average penetration depth (i.e., D86 ) follow-
available. In order to increase the signal-to-noise ratio of the ing Schrön et al. (2017), additionally considering the influ-
neutron counts we applied a moving average with a window ence of soil bulk density.
size of 24 h for the Nmax calibration. It should be noted that a
24 h window is well suited for drought studies but may mask 3.6 Normalized quantiles of soil moisture
the signal from wetting events, which tend to occur much
faster. As suggested by Cooper et al. (2021), we use normalized
quantiles to better indicate extreme soil moisture situations.
First, the soil moisture values are normalized relative to the
3.4 Soil moisture uncertainty
minimal and maximal observed soil moisture of the consid-
The statistical uncertainty of CRNS-derived soil moisture ered time series; i.e., the soil moisture values (θ ) are scaled
scales with the number of counts in a given period. How- between 0 and 1 (p):
ever, this count rate is inversely related to soil moisture, so
drier soils result in more accurate measurements (Desilets et p = (θ − θmin ) θmax /θmin , (10)
al., 2010; Bogena et al., 2013). In addition, the size of the
where θmin is the minimum observed soil moisture and θmax
CRNS detector determines the count rate, i.e., a larger detec-
is the maximum observed soil moisture. Subsequently, p is
tor volume improves the count statistics and thus reduces the
used to obtain the quantile represented by each soil moisture
uncertainty of the soil moisture product (Weimar et al., 2020;
value:
Schrön et al., 2021). Different neutron detectors with dif-
ferent sizes and efficiencies are used in this study, so it is Q = θsort (p · n) , (11)
important to consider the CRNS-specific uncertainty (e.g.,
when using the data for validations). Due to the non-linearity where θsort represents the soil moisture values sorted in in-
of the neutron–soil-moisture relationship, the propagated un- creasing order and n is the total number of soil moisture ob-
certainty ±σθ is highly asymmetric (Iwema et al., 2021). For servations. From Q the median of all soil moisture values
simplicity, it can be estimated by a symmetrical approxima- (θmed ) is subtracted, and the variance is scaled by dividing by
tion approach suggested by Jakobi et al. (2020): the standard deviation (θSD ) to obtain the normalized quan-
tiles of soil moisture (Qnorm ):
± σθ = θ (N ) − θ (N ∓ σN )
p2 Nmax Qnorm = (Q − θmed ) /θSD . (12)
σθ ≈ σN
(N − p3 Nmax )4 Each Qnorm is then plotted against an observed value of the
q
(N − p3 Nmax )4 + 8σN2 (N − p3 Nmax )2 + 15σN4 , (9) CRNS estimated soil moisture.
where the
√ count rate N follows from the Desilets equation, 3.7 Implementation of the data processing
σN = C Nraw is its Gaussian uncertainty, and p2 = 0.0752,
p3 = 0.346. We provide both the symmetric and asymmet- The raw neutron counts and meteorological data were con-
ric uncertainty of the CRNS-based soil moisture products in verted into a uniform data structure (Fig. A5b) and stored
order to facilitate applications where only one of the two op- in a database within the decentralized data infrastructure
tions can be used. It is important to note that these stochas- TEODOOR (TEreno Online Data repOsitORy, Kunkel et
tic uncertainty estimates do not account for other (system- al., 2013). The data pre-processing, corrections, calibration,
atic) uncertainties, e.g., due to unconsidered biomass effects and uncertainty estimation were implemented in the pro-
(Avery et al., 2016), N0 calibration errors, and unconsidered gramming language Python. These scripts were applied to
variations in incoming neutron flux (Baroni et al., 2018), at- the raw data stored in the database using Node-RED, a graph-
mospheric pressure (Gugerli et al., 2019), and air humidity ical tool for deploying workflows (Node-RED, 2021). Node-
(Iwema et al., 2021). Please note that additional uncertain- RED offers the possibility to connect different data flows in
ties may have occurred when filling gaps in the air pressure a simple way, using so-called nodes. Each node has a de-
and humidity data with ERA5 data. fined and unique task. When data are transmitted to a node,
the node can process these data and then transmit them to
the next node. In this way, different corrections or other im-
3.5 CRNS footprint radius and penetration depth
plementations in the data post-processing can be added or
The footprint radius (i.e., R86 ) was obtained as the 86 % removed individually. As an interface for accessing the data
cumulative contribution quantile of the weighting functions in the TERENO database, the Sensor Observation Service
from Schrön et al. (2017). For this, we integrated the weights (SOS) of Open Geospatial Consortium was used. Here, the
up to 600 m distance considering the influences of soil mois- data are processed by a separate proxy that forwards the re-
ture (as the sum of the CRNS soil moisture, lattice water, and quests to a virtual Python environment. In the last step, the
Earth Syst. Sci. Data, 14, 1125–1151, 2022 https://doi.org/10.5194/essd-14-1125-2022H. R. Bogena et al.: A European network of cosmic-ray neutron soil moisture sensors 1137
processed data were written back directly to the database via This finding confirms results by Cooper et al. (2021) for
email or SOS. the United Kingdom, who in particular suggested hetero-
The raw data as well as the processed data are acces- geneity of soil properties as an explanation for the variabil-
sible via the TERENO Data Discovery Portal (DDP) at ities, and results of Dong and Ochsner (2018), who found
http://www.tereno.net (last access: 2 March 2022). The data that soil moisture at the regional scale is more controlled by
portal enables the query, visualization, and access to data and soil texture than precipitation. However, when comparing the
metadata of the stations presented in this paper. Additionally, three events, it becomes evident that 2018 had more locations
detailed information on each CRNS station is provided in the with pronounced extremes and that these occurred predomi-
metadata (Fig. A5a) and can be retrieved from the data portal. nantly in the climate zone Cfb, while 2018 was not notably
different from other drought years in the monthly soil mois-
4 Results and discussion ture averages shown in Fig. 4 (upper subplot). This demon-
strates again the advantage of normalized soil moisture quan-
4.1 Spatiotemporal occurrence of drought events in tiles for a more in-depth analysis of extreme events.
Europe Finally, we investigated whether the CRNS data allow us
to draw conclusions about longer-term trends in soil mois-
The provision of a continental-scale dataset on soil moisture ture in Europe. For this, we contrasted monthly mean soil
dynamics opens up numerous possibilities for analysis, es- moisture from 2014–2017 with monthly mean soil moisture
pecially with respect to large-scale climatic and hydrological from 2018 to 2021 in Fig. 5, using the 26 sites fully cov-
applications. In the following, we present first analyses on ering this period. From Fig. 5, it is evident that as of 2018,
the spatiotemporal occurrence of drought events in Europe soil moisture was lower not only in the summer months but
based on the processed time series of CRNS soil moisture. throughout the year. Although the considered soil moisture
Figure 3 visualizes the results of the CRNS soil mois- data cover only 7 years, they can be considered as an indica-
ture processing for the COSMOS-Europe sites. The CRNS tor of the magnitude and direction of the trend in soil water
soil moisture (left subplot) shows strong temporal variations supply that Europe can expect as climate change progresses.
as well as large differences between the COSMOS-Europe
sites. Due to these strong variations in CRNS soil mois-
ture, similarities in the absolute values are difficult to dis- 4.2 How representative and accessible is the soil
cern, e.g., the impact of large-scale drought events on CRNS moisture data?
soil moisture. Therefore, following the approach of Cooper The representativeness of the individual stations for the de-
et al. (2021), Fig. 3 also presents the normalized quantiles picted land use type and geographical location is relevant,
of CRNS soil moisture (right subplot) to better indicate ex- especially with regard to the validation of large-scale model
treme soil moisture situations, i.e., to better distinguish be- applications of remote sensing products, which usually show
tween “normal low” soil moisture and “extremely low” soil coarser spatial resolutions and correspondingly “averaged”
moisture. In this way, the widespread impacts on the recent representation of site properties (e.g., Colliander et al., 2017;
drought events of 2018, 2019, and 2020 on CRNS soil mois- Montzka et al., 2020). In a few cases, the COSMOS-Europe
ture in Europe become more apparent. The 2018 drought, in sites represent larger site heterogeneity. This is reflected in
particular, is clearly visible with pronounced negative val- particular in the resulting larger variability of soil moisture in
ues in the normalized soil moisture quantiles across all lat- the in situ calibration data measured for the individual sites
itudes, indicating that the whole of Europe was affected by (see Fig. A4). An example is the CRNS station at the Fuer-
the drought. stensee site in Germany (Rasche et al., 2021). The footprint
In the following, we explore if CRNS soil moisture infor- represented by the CRNS measurement at this site includes a
mation can be a valuable basis for more accurate assessment sand lens in the center of the footprint, which is surrounded
of the uniqueness and potential impacts of drought events by peat soils. The resulting heterogeneity, particularly of soil
at regional to continental scales. In Fig. 4 the monthly mean properties such as bulk density, soil organic matter content,
CRNS soil moisture of all COSMOS-Europe sites since 2011 and lattice water, challenges the harmonized data process-
are presented, along with the spatial mean and SD (upper ing applied for COSMOS-Europe and leads to greater uncer-
subplot). tainty in the derived soil moisture product, which is not easy
Despite the different time series lengths, the seasonal vari- to quantify.
ations in soil moisture can be clearly seen. We selected three While aspects such as soil heterogeneities or varying land
drought events to examine differences in soil moisture be- use can be of great importance for local or CRNS method-
tween sites, with all data for the period of record presented ological questions, this is rather an obstacle for large-scale
as normalized quantiles of soil moisture for each site (Fig. 4, questions. Especially with regard to the future develop-
lower subplot). It is evident that sites even within the same ment of the European network of CRNS stations, attention
climate zone with broadly similar weather patterns can have should be paid to the selection of sites that guarantee a
very different ranges and extremes of soil moisture. high representativeness and homogeneity. With respect to the
https://doi.org/10.5194/essd-14-1125-2022 Earth Syst. Sci. Data, 14, 1125–1151, 2022You can also read