Assessment of the Current and Future Saltwater Intrusion Into the Cai River in Nha Trang, Vietnam jbhj - B. van Kessel P.T. Kockelkorn T.R ...
←
→
Page content transcription
If your browser does not render page correctly, please read the page content below

Assessment of the Current and
                                Future Saltwater Intrusion Into the
                                Cai River in Nha Trang, Vietnam
                                jbhj                         B. van Kessel
                                                           P.T. Kockelkorn
                                                                T.R. Speelman
                                                                   T.C. Wierikx
Technische Universiteit Delft
Assessment of the Current and
Future Saltwater Intrusion Into the
 Cai River in Nha Trang, Vietnam
                                           by

                            B. van Kessel           4552318
                            P.T. Kockelkorn         4477499
                            T.R. Speelman           4448332
                            T.C. Wierikx            4460510

                                     Final version
                               Submitted on June 30, 2021

    Course:              Civil Engineering Consultancy Project (CIE4061-09)
    Project duration:    April, 2021 – July, 2021
    Project committee:   Dr. T.A. Bogaard         Delft University of Technology
                         Dr. ir. A. Blom          Delft University of Technology
                         Ir. J.L.F. Eulderink     Delft University of Technology
                         Dr. Mai Van Cong         Thuyloi University
                         Dr. Dinh Nhat Quang      Thuyloi University
                         Dr. Mai Cao Tri          Hanoi University of Civil Engineering

   An electronic version of this report is available at http://repository.tudelft.nl/.

                            Cover picture by K. Dobrev, 2019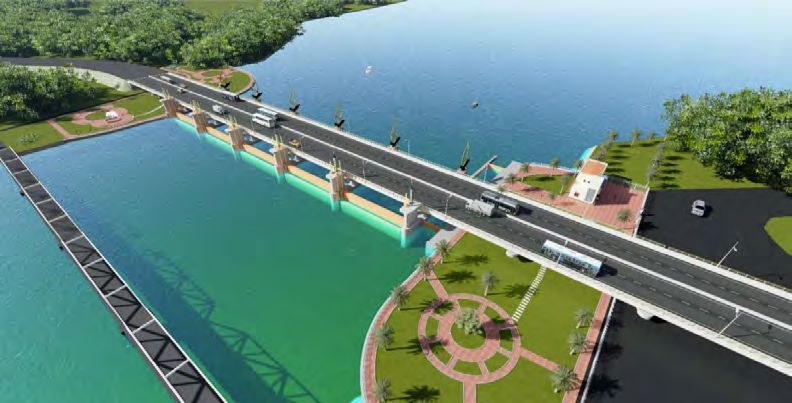
Preface
We have written this report for the Civil Engineering Consultancy Project at the Delft University of Technology
in the Netherlands in collaboration with the Thuyloi University and the Hanoi University of Civil Engineering
in Vietnam. As we are all civil engineering students from different disciplines, we had to study this specific
subject extensively before we could make a proper start. In that process, we have learnt a lot. We gained not
only hydrological knowledge but also academic skills. Initially, this project was planned to be completely dif-
ferent to us. When the four of us came together for the first time, nobody had heard of Covid-19. We wanted
to do this project abroad, but of course, this was not possible anymore after the start of the pandemic. We
still wanted to start with the project despite the fact that we were not allowed to go to Vietnam and we have
not regretted this choice for a second. Working from home and the university, we were strongly motivated to
achieve a great result.

We have received valuable feedback and input from different people towards the completion of this report.
Firstly, we would like to thank Ir. Juliette Eulderink for setting up the project and putting us in touch with
Vietnam. We are very grateful for all the help of our supervisors. Without the weekly tips, input and enthu-
siasm of not only Juliette but also Dr. Thom Bogaard and Dr. Ir. Astrid Blom this research would not be as
good as it is now. Also, the experience of our Vietnamese supervisors Dr. Mai Van Cong, Dr. Dinh Nhat Quang
and Dr. Mai Cao Tri helped us a lot. Especially by being able to collect so much data on the Cai River, they
enabled us to perform extensive analyses. It is unfortunate we were not able to meet in person, but maybe
we will sometime in the future!
     In the process, we also got help from some other people than our supervisors. We would like to thank
Prof. Dr. Ir. Hubert Savenije for giving valuable insights into the application of the analytical model and Dr.
Ir. Bas van Maren for assisting us with the numerical model. Furthermore, we are grateful to Tung Dao MSc
for his help with translating and interpreting Vietnamese documents.

Overall, we are satisfied with the results of this research. It is great to see how much work can be done by four
students in two months time. We hope there will be follow-up research capable of validating our models and
investigating the other topics that play a role in the Cai River basin. For now, we hope you enjoy the read!

                                                                                                    B. van Kessel
                                                                                                 P.T. Kockelkorn
                                                                                                  T.R. Speelman
                                                                                                    T.C. Wierikx

                                                                                                Delft, June 2021

                                                       iii
Summary
The Cai River is located in the South Central part of Vietnam, runs through the city of Nha Trang and flows out
in the South China Sea. The Cai River basin has a tropical monsoon climate which is characterised by a yearly
dry and wet season. Due to this climate, the discharge in the Cai River shows high seasonal fluctuations. In
the dry season, the low discharge can lead to significant saltwater intrusion into the Cai River. The saltwater
intrusion is undesirable because water with salinity higher than 0.25 kg/m3 is not usable for domestic and
agricultural purposes. Future changes in climate are likely to impact the magnitude and profile of the salt-
water intrusion and could possible worsen the negative effects. Therefore, this report analysed what factors
influence the magnitude and profile of the saltwater intrusion. Together with projections linked to climate
change scenarios, insight was obtained on the development of the saltwater intrusion by applying an analyt-
ical and numerical model. Finally, this research analysed the effect of a saltwater intrusion prevention dam.

The river discharge has a significant impact on saltwater intrusion. In order to analyse the river discharge,
this research set up the water balance of the Cai River basin and quantified the incoming and outgoing water
via respectively precipitation and evapotranspiration. Within the system, the water is used in various ways
before it returns to the river or evaporates. A closed water balance on a monthly basis is required in order to
link the discharge to the system parameters. However, it was found that 37% more water seemed to leave the
basin compared to the water that enters the basin. The discharge data was the most likely source of error.
Due to this imbalance error and data gaps, this research did not succeed in closing the water balance.
    Besides the discharge, boundary conditions like the seawater level of the South China Sea and the bathy-
metry of the Cai River determine the magnitude and profile of the saltwater intrusion. The boundary condi-
tions are important input parameters for the models used. Different climatological processes affect the sea
level and the tides affect the fluctuations of the sea level. This paper obtained data on all boundary conditions
and analysed the tidal spectrum to use as input for the numerical model.
    Future expected change in terms of maximum saltwater intrusion was analysed by looking at the pro-
jections on the water balance and the boundary conditions. This research concluded that the precipitation
and the water demand increases, but the trend of evapotranspiration shows no increase into the future. With
some uncertainty, the discharge was expected to slightly increase during all months of the year. Climate
change projections expect the sea level to rise by approximately 35-45 cm through to the year 2070, depend-
ing on the specific climate change scenario used. The river mouth width was expected to show no natu-
ral changes into the future since it is constrained by human construction works. Human interventions can
change the future bathymetry, but this was beyond the scope of this research.

The saltwater intrusion was modelled with both an analytical model (based on Savenije, 2006) and a numer-
ical model (in Delft3D). The results of both models were analysed and compared to each other and to in situ
measurements. It was concluded that the discharge is the strongest driver in salinity changes based on the
results of the models. The most significant change in boundary conditions in the past 20 years is the widening
of the river mouth from 130 to 438 m, which potentially increased salinity by 2-3 kg/m3 at approximately 5
km from the river mouth. The intrusion length is not influenced significantly by changes in the river mouth
width. Based on all drivers of saltwater intrusion, freshwater usage has a limited effect and will likely remain
as such. Future changes in discharge were expected to have a substantially larger effect, but discharge is
mainly human-controlled in the dry season and the extend of saltwater intrusion can therefore also be con-
trolled.

A saltwater intrusion prevention dam showed to be effective in the conceptualized simulations when the
gates are at their highest position. For lower positions of the gates, it decreases the salinity values upstream
of the dam, but the saltwater intrusion length remains roughly constant. Simulations of different dam posi-
tions showed that the dam situated 2.7 km from the river mouth is the most effective. However, the reliability
of the effects of the dam on salinity values remains low, because of minor model validation due to a lack of
data from measurements. The dam could have a reduced effectiveness in this specific estuary, because the
estuary of the Cai River is well-mixed, especially for low discharges (20 m3 /s or lower). The sea level rise can

                                                       iv
Summary                                                                                                      v

increase salinity values up to 2.5 kg/m3 in 2070 till 8 km from the river mouth and saltwater could reach up to
1 km further if all other factors remain constant.

Based on the methods, results and discussion, the authors proposed several ways towards improving the re-
sults of this research and further additional research on the same topic. More elaborate in situ measurements
of the salinity would contribute greatly to the validation and accuracy of both models. Next to acquiring more
in situ data, more accuracy in predictions of the future saltwater intrusion can be obtained by improving the
models themselves. Examples of the possible improvements of the models and their results are detailed salin-
ity measurements in the Cai River and real-time operations of the dam during the numerical simulation.
Contents

Preface                                                                                                                                                                   iii
Summary                                                                                                                                                                   iv
List of Figures                                                                                                                                                          viii
List of Tables                                                                                                                                                             x
1   Introduction                                                                                                                                                           1
    1.1 Research Goal and Questions . . . . . . . . . . . . . . . . . . . . . . . . . . . . . . . . . . .                                                                  2
    1.2 Methodology . . . . . . . . . . . . . . . . . . . . . . . . . . . . . . . . . . . . . . . . . . .                                                                  3
    1.3 Structure of the Report . . . . . . . . . . . . . . . . . . . . . . . . . . . . . . . . . . . . . .                                                                3
2   Water Balance                                                                                                                                                          5
    2.1 Rainfall . . . . . . . . . . . . . . . . . . . . . . . . . . . . . . . . . .                                     .   .   .   .   .   .   .   .   .   .   .   .     6
        2.1.1 Current Situation . . . . . . . . . . . . . . . . . . . . . . . . .                                        .   .   .   .   .   .   .   .   .   .   .   .     6
        2.1.2 Trend Analysis . . . . . . . . . . . . . . . . . . . . . . . . . . .                                       .   .   .   .   .   .   .   .   .   .   .   .     7
    2.2 Evapotranspiration . . . . . . . . . . . . . . . . . . . . . . . . . . . .                                       .   .   .   .   .   .   .   .   .   .   .   .     8
        2.2.1 Current Situation . . . . . . . . . . . . . . . . . . . . . . . . .                                        .   .   .   .   .   .   .   .   .   .   .   .     8
        2.2.2 Trend Analysis . . . . . . . . . . . . . . . . . . . . . . . . . . .                                       .   .   .   .   .   .   .   .   .   .   .   .     8
    2.3 Runoff . . . . . . . . . . . . . . . . . . . . . . . . . . . . . . . . . .                                       .   .   .   .   .   .   .   .   .   .   .   .     8
        2.3.1 Current Situation . . . . . . . . . . . . . . . . . . . . . . . . .                                        .   .   .   .   .   .   .   .   .   .   .   .     9
        2.3.2 Trend Analysis . . . . . . . . . . . . . . . . . . . . . . . . . . .                                       .   .   .   .   .   .   .   .   .   .   .   .    10
    2.4 Water Demand . . . . . . . . . . . . . . . . . . . . . . . . . . . . . .                                         .   .   .   .   .   .   .   .   .   .   .   .    11
        2.4.1 Irrigation. . . . . . . . . . . . . . . . . . . . . . . . . . . . . .                                      .   .   .   .   .   .   .   .   .   .   .   .    11
        2.4.2 Domestic Water Use . . . . . . . . . . . . . . . . . . . . . . . .                                         .   .   .   .   .   .   .   .   .   .   .   .    11
        2.4.3 Tourism . . . . . . . . . . . . . . . . . . . . . . . . . . . . . .                                        .   .   .   .   .   .   .   .   .   .   .   .    12
        2.4.4 Water Reservoirs and Minimum Discharge. . . . . . . . . . . . .                                            .   .   .   .   .   .   .   .   .   .   .   .    12
        2.4.5 Influence of Anthropogenic Water Demand on the Water Balance .                                             .   .   .   .   .   .   .   .   .   .   .   .    12
    2.5 Quantified Yearly Water Balance . . . . . . . . . . . . . . . . . . . . .                                        .   .   .   .   .   .   .   .   .   .   .   .    13
        2.5.1 Discussion . . . . . . . . . . . . . . . . . . . . . . . . . . . . .                                       .   .   .   .   .   .   .   .   .   .   .   .    14
    2.6 Quantified Monthly Water Balance . . . . . . . . . . . . . . . . . . . .                                         .   .   .   .   .   .   .   .   .   .   .   .    15
    2.7 Projections . . . . . . . . . . . . . . . . . . . . . . . . . . . . . . . .                                      .   .   .   .   .   .   .   .   .   .   .   .    16
        2.7.1 Temperature and Rainfall . . . . . . . . . . . . . . . . . . . . .                                         .   .   .   .   .   .   .   .   .   .   .   .    16
        2.7.2 Water Demand . . . . . . . . . . . . . . . . . . . . . . . . . . .                                         .   .   .   .   .   .   .   .   .   .   .   .    16
    2.8 Conclusions on the Water Balance . . . . . . . . . . . . . . . . . . . .                                         .   .   .   .   .   .   .   .   .   .   .   .    17
3   Boundary Conditions                                                                                                                                                   19
    3.1   Sea Level and Tides . . . . . . . . . . . .   .   .    .   .   .   .   .   .   .   .   .   .   .   .   .   .   .   .   .   .   .   .   .   .   .   .   .   .    19
    3.2   Bathymetry . . . . . . . . . . . . . . . .    .   .    .   .   .   .   .   .   .   .   .   .   .   .   .   .   .   .   .   .   .   .   .   .   .   .   .   .    21
    3.3   Future Expected Change . . . . . . . . .      .   .    .   .   .   .   .   .   .   .   .   .   .   .   .   .   .   .   .   .   .   .   .   .   .   .   .   .    21
    3.4   Saltwater Intrusion Dam . . . . . . . . .     .   .    .   .   .   .   .   .   .   .   .   .   .   .   .   .   .   .   .   .   .   .   .   .   .   .   .   .    22
    3.5   Conclusions on the Boundary Conditions.       .   .    .   .   .   .   .   .   .   .   .   .   .   .   .   .   .   .   .   .   .   .   .   .   .   .   .   .    22
4   Saltwater Intrusion                                                                                                                                                   24
    4.1 Theoretical Background. . . . . . . . . . . . . . . . . .                        .   .   .   .   .   .   .   .   .   .   .   .   .   .   .   .   .   .   .   .    24
        4.1.1 Types of Intrusion Mechanisms . . . . . . . . . .                          .   .   .   .   .   .   .   .   .   .   .   .   .   .   .   .   .   .   .   .    24
        4.1.2 Types of Mixing . . . . . . . . . . . . . . . . . .                        .   .   .   .   .   .   .   .   .   .   .   .   .   .   .   .   .   .   .   .    25
        4.1.3 Types of Intrusion Curve Shapes . . . . . . . . . .                        .   .   .   .   .   .   .   .   .   .   .   .   .   .   .   .   .   .   .   .    25
    4.2 Salinity Measurements and the Situation in the Cai River .                       .   .   .   .   .   .   .   .   .   .   .   .   .   .   .   .   .   .   .   .    26
    4.3 Conclusions on the Saltwater Intrusion Data . . . . . . .                        .   .   .   .   .   .   .   .   .   .   .   .   .   .   .   .   .   .   .   .    27

                                                            vi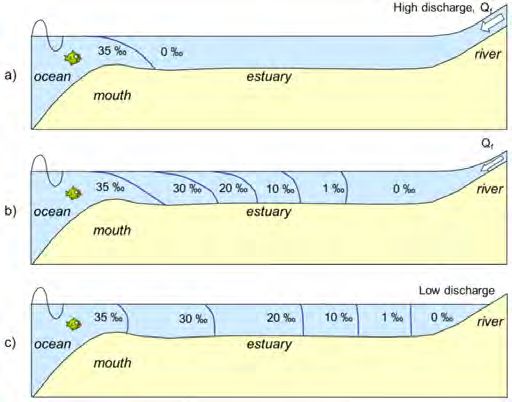
Contents                                                                                                                                                                      vii

5   Analytical and Numerical Models of Saltwater Intrusion                                                                                                                    28
    5.1 Analytical Model . . . . . . . . .    .   .   .   .   .   .   .   .   .   .   .   .   .   .   .   .   .   .   .   .   .   .   .   .   .   .   .   .   .   .   .   .   28
        5.1.1 Derivation and Application      .   .   .   .   .   .   .   .   .   .   .   .   .   .   .   .   .   .   .   .   .   .   .   .   .   .   .   .   .   .   .   .   29
        5.1.2 Calibration . . . . . . . . .   .   .   .   .   .   .   .   .   .   .   .   .   .   .   .   .   .   .   .   .   .   .   .   .   .   .   .   .   .   .   .   .   30
    5.2 Numerical Model . . . . . . . . .     .   .   .   .   .   .   .   .   .   .   .   .   .   .   .   .   .   .   .   .   .   .   .   .   .   .   .   .   .   .   .   .   31
        5.2.1 Computational Grid . . . .      .   .   .   .   .   .   .   .   .   .   .   .   .   .   .   .   .   .   .   .   .   .   .   .   .   .   .   .   .   .   .   .   31
        5.2.2 Boundaries. . . . . . . . .     .   .   .   .   .   .   .   .   .   .   .   .   .   .   .   .   .   .   .   .   .   .   .   .   .   .   .   .   .   .   .   .   32
        5.2.3 Physical Parameters . . . .     .   .   .   .   .   .   .   .   .   .   .   .   .   .   .   .   .   .   .   .   .   .   .   .   .   .   .   .   .   .   .   .   32
        5.2.4 Simulations . . . . . . . .     .   .   .   .   .   .   .   .   .   .   .   .   .   .   .   .   .   .   .   .   .   .   .   .   .   .   .   .   .   .   .   .   33
        5.2.5 Modelling of the Dam . . .      .   .   .   .   .   .   .   .   .   .   .   .   .   .   .   .   .   .   .   .   .   .   .   .   .   .   .   .   .   .   .   .   33
6   Results of the Models and Discussion                                                                                                                                      35
    6.1 Analytical Model . . . . . . . . . . . . . . . . . . . .                          .   .   .   .   .   .   .   .   .   .   .   .   .   .   .   .   .   .   .   .   .   35
        6.1.1 Varying Input Parameters . . . . . . . . . . . .                            .   .   .   .   .   .   .   .   .   .   .   .   .   .   .   .   .   .   .   .   .   36
        6.1.2 Sensitivity and Uncertainty Analysis . . . . . . .                          .   .   .   .   .   .   .   .   .   .   .   .   .   .   .   .   .   .   .   .   .   37
    6.2 Numerical Model . . . . . . . . . . . . . . . . . . . .                           .   .   .   .   .   .   .   .   .   .   .   .   .   .   .   .   .   .   .   .   .   39
        6.2.1 Varying Input Parameters . . . . . . . . . . . .                            .   .   .   .   .   .   .   .   .   .   .   .   .   .   .   .   .   .   .   .   .   40
    6.3 Discussion of the Results and Limitations. . . . . . . .                          .   .   .   .   .   .   .   .   .   .   .   .   .   .   .   .   .   .   .   .   .   43
        6.3.1 Validation of the Numerical and Analytical Model                            .   .   .   .   .   .   .   .   .   .   .   .   .   .   .   .   .   .   .   .   .   43
        6.3.2 Result Interpretation . . . . . . . . . . . . . . .                         .   .   .   .   .   .   .   .   .   .   .   .   .   .   .   .   .   .   .   .   .   44
7   Conclusions and Recommendations                                                                                                                                           47
    7.1 Conclusions. . . . . . . . . . . . . . . . . . . . . . . . . . . . . . . . . . . . . . . . . . . . 47
    7.2 Recommendations . . . . . . . . . . . . . . . . . . . . . . . . . . . . . . . . . . . . . . . . 48
References                                                                                                                                                                    50
A Appendix                                                                                                                                                                    53
    A.1   Freshwater Demand per Sector . . . . . . . . . . . .                        .   .   .   .   .   .   .   .   .   .   .   .   .   .   .   .   .   .   .   .   .   .   53
    A.2   Bed Roughness Calculation . . . . . . . . . . . . . .                       .   .   .   .   .   .   .   .   .   .   .   .   .   .   .   .   .   .   .   .   .   .   55
    A.3   Input Data Processing. . . . . . . . . . . . . . . . .                      .   .   .   .   .   .   .   .   .   .   .   .   .   .   .   .   .   .   .   .   .   .   58
    A.4   Water Demand Appendix . . . . . . . . . . . . . . .                         .   .   .   .   .   .   .   .   .   .   .   .   .   .   .   .   .   .   .   .   .   .   59
          A.4.1 Domestic Water Use . . . . . . . . . . . . . .                        .   .   .   .   .   .   .   .   .   .   .   .   .   .   .   .   .   .   .   .   .   .   59
          A.4.2 Projections . . . . . . . . . . . . . . . . . . .                     .   .   .   .   .   .   .   .   .   .   .   .   .   .   .   .   .   .   .   .   .   .   60
    A.5   Tides . . . . . . . . . . . . . . . . . . . . . . . . .                     .   .   .   .   .   .   .   .   .   .   .   .   .   .   .   .   .   .   .   .   .   .   61
    A.6   Estuarine Richardson Number . . . . . . . . . . . .                         .   .   .   .   .   .   .   .   .   .   .   .   .   .   .   .   .   .   .   .   .   .   63
    A.7   Delft3D Input . . . . . . . . . . . . . . . . . . . . .                     .   .   .   .   .   .   .   .   .   .   .   .   .   .   .   .   .   .   .   .   .   .   64
    A.8   Distributions of the Uncertainty Analysis Parameters .                      .   .   .   .   .   .   .   .   .   .   .   .   .   .   .   .   .   .   .   .   .   .   68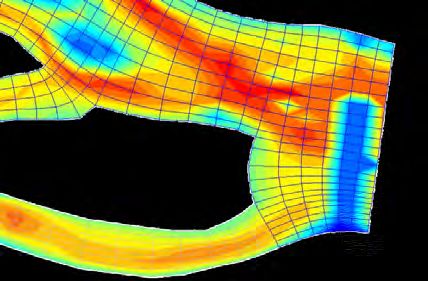
List of Figures

1.1 Location and DEM of the Nha Trang Cai River Basin in Khanh Hoa, Vietnam. . . . . . . . . . . .                         1
1.2 The First 15 km of the Cai River Estuary, its Freshwater Pumping Stations and the Location of
    the Future Dam. The Location of the Pumping Stations and the Dam Follows From the Dam
    Reports [10, 39]. . . . . . . . . . . . . . . . . . . . . . . . . . . . . . . . . . . . . . . . . . . . . . . . .      2
1.3 A Flowchart of the Research Process. The Blue Cells Indicate the Input Data, the Numbered
    Orange Cells Indicate the Corresponding Research Questions and the Arrow Text Denotes the
    Process or Technique Used to Answer the Research Question (GEE Stands for Google Earth En-
    gine). . . . . . . . . . . . . . . . . . . . . . . . . . . . . . . . . . . . . . . . . . . . . . . . . . . . . . .     3

2.1 Schematization of a Water Balance of a River Basin. . . . . . . . . . . . . . . . . . . . . . . . . . . .              5
2.2 Monthly Averaged Rainfall Measurements From in Situ and Remote Sensing Data From 1977 to
     2015 [2, 3] . . . . . . . . . . . . . . . . . . . . . . . . . . . . . . . . . . . . . . . . . . . . . . . . . . .     6
2.3 Average Yearly Precipitation From 1977 to 2015 in the Cai River Basin Relative to the Precipita-
     tion in Dong Trang [3] . . . . . . . . . . . . . . . . . . . . . . . . . . . . . . . . . . . . . . . . . . . .        7
2.4 Calibrated Yearly Averages From 1977 to 2015 of Precipitation in the Cai River Basin. . . . . . . .                    7
2.5 Monthly Averages of Evapotranspiration in the Cai River Basin From 2001 to 2016 [10, 33] . . . .                       9
2.6 Yearly Averages of Evapotranspiration in the Cai River Basin [10, 33]. . . . . . . . . . . . . . . . . .               9
2.7 Monthly Average Discharge of the Cai River at Dong Trang [1]. . . . . . . . . . . . . . . . . . . . .                  9
2.8 Discharge at Dong Trang and Nha Trang During December 2017 [1, 10] . . . . . . . . . . . . . . .                       9
2.9 Sample Probability Density Function of Daily Averaged Discharge at Dong Trang From 1983 to
     2016. . . . . . . . . . . . . . . . . . . . . . . . . . . . . . . . . . . . . . . . . . . . . . . . . . . . . . .    10
2.10 Cumulative Distribution Function of Daily Averaged Discharge at Dong Trang From 1983 to 2016.                        10
2.11 Cumulative Contribution to the Total Discharge at Dong Trang From 1983 to 2016. . . . . . . . .                      10
2.12 Yearly Trends in Runoff at Dong Trang. . . . . . . . . . . . . . . . . . . . . . . . . . . . . . . . . . .           10
2.13 Water Demand per Month for the Year 2015 in the Cai River Basin. [12] . . . . . . . . . . . . . . .                  12
2.14 The Ratio of Water Demand per Category in the Cai River Basin in 2015 for the Whole Year (a)
     and for the Dry Season (b). [12] . . . . . . . . . . . . . . . . . . . . . . . . . . . . . . . . . . . . . . .       13
2.15 The Location and Capacity of the Reservoirs With a Capacity Larger Than 1 Million m3 . . . . . .                     14
2.16 Schematization of the Yearly Water Balance of the Cai River Basin. . . . . . . . . . . . . . . . . . .               14
2.17 Monthly Water Balance. . . . . . . . . . . . . . . . . . . . . . . . . . . . . . . . . . . . . . . . . . . .         15
2.18 Projected Development of the Water Demand per Sector in the Cai River Basin. [12] . . . . . . .                      16
2.19 (Projected) Water Demand in the Cai River Basin per Month for the Years 2015, 2025 and 2035.
     [12] . . . . . . . . . . . . . . . . . . . . . . . . . . . . . . . . . . . . . . . . . . . . . . . . . . . . . . .   17

3.1 Mean Sea Level per Month Relative to Overall Mean Sea Level at Nha Trang. . . . . . . . . . . . .                     19
3.2 Sea Level Relative to Mean Sea Level at Qui Nhon Between 1977 and 2013. Obtained from the
    Hydro-meteorological and Environmental Station Network Center [18]. . . . . . . . . . . . . . . .                     19
3.3 Velocity Vectors in the South China Sea Obtained From Shaw and Chao (1994) [37]. Transport
    Near Central Vietnam is in August in the Eastern Direction (a) and in December in the South-
    Western Direction (b). . . . . . . . . . . . . . . . . . . . . . . . . . . . . . . . . . . . . . . . . . . . .        20
3.4 Bathymetry of the Cai River Estuary. . . . . . . . . . . . . . . . . . . . . . . . . . . . . . . . . . . . .          21
3.5 Change Over Time in Width of the Cai River Mouth in Nha Trang Obtained From Google Earth.                             22
3.6 An Impression of the Saltwater Intrusion Dam at Nha Trang. [39] . . . . . . . . . . . . . . . . . . .                 23
3.7 The Potential Locations of the Saltwater Intrusion Dam as Presented in the Technical Dam Re-
    port [39]. . . . . . . . . . . . . . . . . . . . . . . . . . . . . . . . . . . . . . . . . . . . . . . . . . . . .    23

4.1 Saltwater Intrusion of the Stratified Type (a), the Partially Mixed Type (b) and the Well-mixed
    Type (c). [35] . . . . . . . . . . . . . . . . . . . . . . . . . . . . . . . . . . . . . . . . . . . . . . . . . .    24

                                                          viii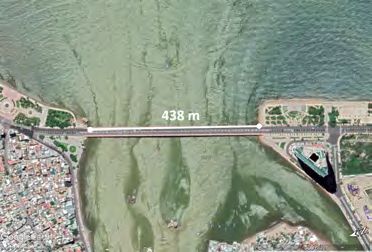
List of Figures ix
4.2 Resultant Hydrostatic Forces Driving Vertical Net Circulation. The Left-hand Side of the Figure
Is Downstream. [35] . . . . . . . . . . . . . . . . . . . . . . . . . . . . . . . . . . . . . . . . . . . . . 25
4.3 The Different Types of Saltwater Intrusion Curve Shapes. [35] . . . . . . . . . . . . . . . . . . . . . 26
4.4 The Vertical Salinity Distribution Along the Cai River at HWS in 1998 [26]. . . . . . . . . . . . . . 27
4.5 Salinity Measurements in 2005, 2006 and From February to July 2016 [10, 11]. . . . . . . . . . . . 27
4.6 Monthly Averaged Discharge in 1998, 2005, 2006, 2016 Compared to Long Term Average [1]. . . . 27
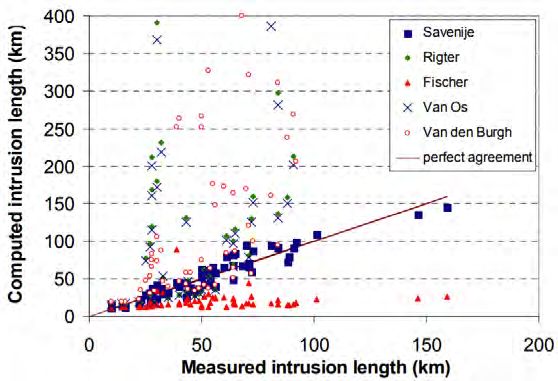
5.1 Salinity Intrusion Length Computed by Several Methods. [25] . . . . . . . . . . . . . . . . . . . . . 28
5.2 Semi-logarithmic Plot of the Estuary Geometry With the Measured Width and Simulated Width
B and Depth h in m and Cross-sectional Area A in m 2 Along the Estuary Axis. . . . . . . . . . . . 30
5.3 Logarithmic Plot of the Optimized Dispersion at the Inflection Point and the Discharge . . . . . 31
5.4 Overview of the Arrangement of Variables in the Staggered Arakawa C-grid. [9] . . . . . . . . . . 32
5.5 Map of the Bathymetry of the Delft3D Model. . . . . . . . . . . . . . . . . . . . . . . . . . . . . . . 32
5.6 Input for the Boundary Condition on the Seaward Side of the Model Based on the Tidal Con-
stituents. . . . . . . . . . . . . . . . . . . . . . . . . . . . . . . . . . . . . . . . . . . . . . . . . . . . . 33
5.7 Adapted Bathymetries for the Different River Mouth Widths in the Numerical Model. . . . . . . 33
5.8 Grid Adaptions for the Different Dam Locations. . . . . . . . . . . . . . . . . . . . . . . . . . . . . 34
6.1 Analytically Computed Saltwater Intrusion Curves of TA, LWS and HWS With the Parameters in
Table 6.1 as Input Values. The inflection point of the TA curve is indicated in the figure. . . . . . 36
6.2 The Analytically Modelled Effect of Changes in River Discharge Q f on the Salinity. . . . . . . . . 36
6.3 The Analytically Modelled Effect of Changes in Mean Water Depth h on the Salinity. . . . . . . . 37
6.4 The Analytically Modelled Effect of Changes in the Effective River Mouth Width B 0 on the Salinity. 37
6.5 Results of the Sensitivity Analysis for the Analytical Model With on the X-axis the Normalised Pa-
rameter Value and on the Y-axis the Normalised Saltwater Intrusion Length. Table 6.1 provides
a description of the symbols. . . . . . . . . . . . . . . . . . . . . . . . . . . . . . . . . . . . . . . . . 38
6.6 Probability Density of the Error of the TA and HWS Saltwater Intrusion Length Computed Using
a Monte Carlo Analysis. . . . . . . . . . . . . . . . . . . . . . . . . . . . . . . . . . . . . . . . . . . . 39
6.7 Numerical Simulation of the Depth Averaged Saltwater Intrusion Curve. . . . . . . . . . . . . . . 40
6.8 Numerical Simulation of the TA Saltwater Intrusion for Two Different Discharges Q f . . . . . . . . 40
6.9 The Numerically Modelled Effect of Changes in River Discharge Q f on the Salinity. . . . . . . . . 41
6.10 Numerically Modelled TA Salinity Curves for Three Different Widths of the River Mouth. . . . . . 41
6.11 Numerically Modelled TA Salinity Curves for Different Values of Sea Level Rise. . . . . . . . . . . 41
6.12 Numerically Modelled TA Salinity Curves for Different Dam Levels at Location 1. . . . . . . . . . 42
6.13 Numerically Modelled TA Salinity Curves for Different Dam Levels at Location 2. . . . . . . . . . 42
6.14 Numerically Modelled TA Salinity Curves for Different Dam Locations With a Crest Height of +1
m. . . . . . . . . . . . . . . . . . . . . . . . . . . . . . . . . . . . . . . . . . . . . . . . . . . . . . . . . 42
6.15 Numerical Simulation of the TA Saltwater Intrusion for Different Dam Levels at Location 1 for a
Discharge of 10 m3 /s. . . . . . . . . . . . . . . . . . . . . . . . . . . . . . . . . . . . . . . . . . . . . . 42
6.16 The TA and HWS Results of the Analytical Model and the Numerical Model Compared to the In
Situ Measurements. . . . . . . . . . . . . . . . . . . . . . . . . . . . . . . . . . . . . . . . . . . . . . . 43
6.17 Modelled Saltwater Intrusion Length Normalized at Q f = 10 m3 /s Against Discharge. . . . . . . . 45
6.18 Comparison of Analytical and Numerical Model Sensitivity to Sea Level Rise or Water Depth
Increase. . . . . . . . . . . . . . . . . . . . . . . . . . . . . . . . . . . . . . . . . . . . . . . . . . . . . 45
6.19 Comparison of Analytical and Numerical Model Sensitivity to River Mouth Width. . . . . . . . . 45
A.1 Locations of the Bed Samples. . . . . . . . . . . . . . . . . . . . . . . . . . . . . . . . . . . . . . . . 55
A.2 Grading Curve of the Bed Composition in the Cai River. . . . . . . . . . . . . . . . . . . . . . . . . 56
A.3 Chézy roughness coefficient as a function of the water depth d . . . . . . . . . . . . . . . . . . . . 57
A.4 Manning roughness coefficient as a function of the water depth d . . . . . . . . . . . . . . . . . . . 57
A.5 Monthly Rainfall Measurements at Dong Trang From in Situ and Remote Sensing Data. . . . . . 58
A.6 Monthly Rainfall Measurements at Nha Trang From in Situ and Remote Sensing Data. . . . . . . 58
A.7 Population Growth in the Cai River Basin. . . . . . . . . . . . . . . . . . . . . . . . . . . . . . . . . 59
A.8 Distribution of the Freshwater Demand Per Sector Over the Whole Year and in the Dry Season
(Jan-Aug) [12]. . . . . . . . . . . . . . . . . . . . . . . . . . . . . . . . . . . . . . . . . . . . . . . . . . 60
A.9 Tidal Spectrum off the Coast of Nha Trang Showing the Tidal Constituents and Amplitudes. . . . 61
A.10 Tidal Constituents and Amplitudes measured off the coast of Nha Trang. . . . . . . . . . . . . . . 62
List of Tables

2.1 Trends in Precipitation in the Cai River Basin. . . . . . . . . . . . . . . . . . . . . . . . . . . . . . .            8
2.2 Trends in Evapotranspiration in the Cai River Basin. . . . . . . . . . . . . . . . . . . . . . . . . . .               8
2.3 Trends in Runoff in the Cai River Basin. . . . . . . . . . . . . . . . . . . . . . . . . . . . . . . . . . .          11
2.4 Projections of Climate Change for the RCP4.5 Scenario for the Khanh Hoa Province Determined
    by the Ministry of Natural Resources and Environment [41] including 10% and 90% confidence
    interval. . . . . . . . . . . . . . . . . . . . . . . . . . . . . . . . . . . . . . . . . . . . . . . . . . . . . .   16
2.5 Projections of Climate Change for the RCP8.5 Scenario for the Khanh Hoa Province Determined
    by the Ministry of Natural Resources and Environment [41] including 10% and 90% confidence
    interval. . . . . . . . . . . . . . . . . . . . . . . . . . . . . . . . . . . . . . . . . . . . . . . . . . . . . .   16

3.1 Tidal Constituents and Amplitudes. . . . . . . . . . . . . . . . . . . . . . . . . . . . . . . . . . . . .            20
3.2 Sea Level Rise Projections for the Coast of Vietnam Determined by the Ministry of Natural Re-
    sources and Environment [41] with a 10% and 90% confidence interval. . . . . . . . . . . . . . . .                    21

5.1 Estuary Geometry Parameter Estimations. . . . . . . . . . . . . . . . . . . . . . . . . . . . . . . . .               29

6.1   Initial Values of the Parameters Used in the Analytical Model. . . . . . . . . . . . . . . . . . . . . .            35
6.2   Slopes of the Parameters at (1, 1). . . . . . . . . . . . . . . . . . . . . . . . . . . . . . . . . . . . . . .     38
6.3   Parameters and Distributions for the Uncertainty Analysis. . . . . . . . . . . . . . . . . . . . . . .              38
6.4   α-values for the Relative Contribution to the Total Uncertainty of the Saltwater Intrusion Length
      Resulting From the FORM. . . . . . . . . . . . . . . . . . . . . . . . . . . . . . . . . . . . . . . . . .          39

A.1 Water Demand per Sector per Month of the Year in mm. . . . . . . . . . . . . . . . . . . . . . . . .                  54
A.2 Bed Composition at the Different Measurement Locations and the Average and Cumulative Val-
    ues. . . . . . . . . . . . . . . . . . . . . . . . . . . . . . . . . . . . . . . . . . . . . . . . . . . . . . . .    56
A.3 Correlation Between in Situ and Remote Sensing Rainfall Measurements. . . . . . . . . . . . . . .                     58
A.4 Input Parameters for the Numerical Delft3D Model. . . . . . . . . . . . . . . . . . . . . . . . . . .                 65
A.5 Parameters and Distributions for the Uncertainty Analysis. . . . . . . . . . . . . . . . . . . . . . .                68

                                                           x
1
Introduction
The Cai River flows through the Khanh Hoa province in South Central Vietnam. The river flows out into the
South China Sea at Nha Trang. The Cai River basin has an area of 1892 km2 and is shown on the map of
Figure 1.1. Khanh Hoa has a tropical monsoon climate with an annual mean temperature of 26.7 ◦ C, every
year has a dry season from January to August and a wet season from September to December. These seasonal
differences cause a large variation in the river. In the dry season, the mean discharge of the Cai River is about
30 m3 /s and in the wet season, the discharge can be up to 20 times higher [26]. The Cai River serves two
main functions for the local population: freshwater supply and shipping. Seasonal differences and freshwater
demand pose multiple hydrological problems in the Cai River basin like flooding, saltwater intrusion, coastal
erosion and excessive sediment deposition.
Cities
River network
Elevation (m)
0
400
800
1200
1600
2000
Basin outline
Figure 1.1: Location and DEM of the Nha Trang Cai River Basin in Khanh Hoa, Vietnam.
This research focused on the problem of the saltwater intrusion into the Cai River in Vietnam. In the dry
season, the saltwater can intrude the river up to 15 kilometres posing some serious problems regarding fresh-
water supply (drinking water, irrigation and industrial water). If the river water exceeds the allowable salinity
11.1. Research Goal and Questions 2
limit of 0.25 kg/m3 , the water cannot be used for freshwater supply [39]. In the past, the exceedance of this
limit has lead to temporary shutdowns of five freshwater pumping stations and some factories creating wa-
ter scarcity and costing millions of dollars [39]. Figure 1.2 shows the first 15 km of the estuary including the
pumping stations.
Tackling these problems requires full comprehension of the saltwater intrusion, its causes and its con-
sequences. If it is understood why and how the saltwater intrusion happens and what influences the mag-
nitude of it, the local government can make educated choices to mitigate or moderate the negative effects.
The length of the saltwater intrusion is mainly influenced by the river discharge, river bathymetry, sea level
and tidal flows [35]. Especially river discharge plays a crucial role in the saltwater intrusion process as a high
discharge is able to push back the saltwater. Several models demonstrate that it is even the most important
process impacting the intrusion length [22]. Not only natural processes like rainfall and evapotranspiration
but also human interventions like water use and damming influence river discharge. Therefore, analysing
the development of the saltwater intrusion requires a complete water balance of the area.
Measures to reduce saltwater intrusion are necessary because future changes in climate and freshwater
demand are likely to increase the problem [17]. A rising sea level and an increase in periods of drought by
climate change and a lower river discharge by an increasing freshwater demand are believed to worsen the
problem of saltwater intrusion [22]. Insight into how the intrusion will exactly change over time is valuable for
decision-making. There is already a proposed solution to the saltwater intrusion problem: a dam upstream
of Nha Trang (the location of the dam can be seen in Figure 1.2). This dam should prevent the saltwater to
intrude further upstream in the dry season and prevent floods in the wet season. Many analyses have been
performed to investigate the effects of the dam [10, 39]. However, research on the saltwater intrusion into the
Cai River in general and the effect of the dam on the saltwater intrusion is missing. This research provides a
first analysis on this subject.
109.10°E 109.20°E
12.28°N
12.28°N
12.26°N
12.26°N
109.10°E 109.20°E
Pumping Stations Dam OpenStreetMap
Figure 1.2: The First 15 km of the Cai River Estuary, its Freshwater Pumping Stations and the Location of the Future Dam. The Location
of the Pumping Stations and the Dam Follows From the Dam Reports [10, 39].
1.1. Research Goal and Questions
The goal of this research was to make a quantitative hydrological analysis of the development of saltwater
intrusion into the Cai River in Nha Trang, Vietnam over the past 30 years and into the future. This goal was
achieved with the help of the following research questions:
1. How has the saltwater intrusion changed in the Cai River over the past 30 years?
2. How has the freshwater use in the Cai River basin changed over the past 30 years?
3. What is the local climate in the Cai River basin and (how) has it changed over the past 30 years?
4. What is the Cai River bathymetry and (how) has it changed over the past 30 years?
5. To what extent do (future changes in) freshwater use, local climate and bathymetry influence the salt-
water intrusion in the Cai River?
6. What is the expected future change in saltwater intrusion in the Cai River (e.g. by the realisation of a
saltwater intrusion dam)?1.2. Methodology 3
1.2. Methodology
The proposed research questions in the previous section acted as guidance for obtaining the research goal.
The flowchart of Figure 1.3 gives an overview of the research processes. Please note that a period of 30 years
was chosen, as this was considered long enough to determine trends, while also still staying within the range
of available data.
Question 1 was answered by a literature study. In the past, there have been four salinity measurement cam-
paigns in the Cai River [10, 11, 26]. Data, as presented in the research papers, was analysed to judge its quality
and usefulness to this research.
Questions 2, 3 and 4 focus on the drivers of changes in salinity. The freshwater use (question 2) is obtained
from official government documents, but this does not span the entire period of interest.
Climate data (question 3) is widely available. Rainfall data was obtained from remote sensing techniques
and calibrated with in situ precipitation data. Research in the North of Vietnam has shown that remote sens-
ing is not very accurate for daily precipitation events, but on a monthly basis, it can be considered sufficiently
reliable [19]. Within this research, more focus was put on the long term trend and yearly numbers than ex-
treme events, which makes remote sensing data a usable option for obtaining precipitation data with higher
temporal and spatial resolution than in situ data.
River bathymetry (question 4) was obtained from drawings provided by Dr. Quang. Furthermore, this
research investigated dredging activities in the river estuary and changes in the river mouth width to describe
changes in the bed profile.
The data obtained by answering these four questions was used to find a correlation between the driving
forces (i.e. freshwater use, local climate and bathymetry) and the resulting saltwater intrusion. A water bal-
ance was set up by combining the data obtained from questions 2 and 3. The discharge, resulting from this
analysis, was used as input along with the river bathymetry and seaward boundary conditions to model the
saltwater intrusion by both an analytical model and a numerical model. Subsequently, salinity data obtained
in question 1 was used to calibrate and validate the models.
Question 5 is about the expected future change in saltwater intrusion based on water balance projections
by using the correlation between the driving forces and the saltwater intrusion. This was done by changing
the input parameters for the analytical and numerical model. The input for the hydrodynamical model was
also altered to include the saltwater intrusion prevention dam and a changing bathymetry to answer research
question 6.
5. Influence of
Literature study 1. Salwater Model parameters on
Relevant data intrusion simulations saltwater
intrusion
2. Freshwater
Literature and GEE GIS
use
6. Expected
future change
River discharge Projections due to climate
and human
influence
Literature study GIS 3. Local climate
Relevant data
Dam design
Literature study 4. River
Relevant data bathymetry
Figure 1.3: A Flowchart of the Research Process. The Blue Cells Indicate the Input Data, the Numbered Orange Cells Indicate the
Corresponding Research Questions and the Arrow Text Denotes the Process or Technique Used to Answer the Research Question (GEE
Stands for Google Earth Engine).
1.3. Structure of the Report
This report starts with an analysis of the water balance of the Cai River basin in Chapter 2. This chapter
gives an overview of the effect of human activities and local climate on river discharge and therefore answers1.3. Structure of the Report 4 research questions 2 and 3 by determining trends in freshwater use and local climate. In Chapter 3 the bound- ary conditions that are required for the models are given. This chapter answers also question 4 about the Cai River bathymetry. In both chapters 2 and 3, also projections for changes in the parameters are given at the end of the chapters. Next, Chapter 4 gives some relevant background information on saltwater intrusion as well as collected salinity data of the Cai River. To answer question 1, an attempt was made to determine a trend in the extend of saltwater intrusion. All the above chapters form the basis to make an analytical and numerical model of the saltwater intrusion. These models are introduced in Chapter 5 and their results are presented and discussed in Chapter 6. The sensitivity of multiple parameters on the model was investigated to make projections of the saltwater intrusion. This was done to answer research questions 5 and 6. Lastly, Chapter 7 provides conclusions and recommendations of this research.
2
                                                                                         Water Balance
The discharge of the Cai River has a significant influence on the extent of the saltwater intrusion. It is, there-
fore, important to understand and quantify the processes that determine the discharge. The water balance
of the Cai River basin was analysed in order to achieve this. All important factors of the water balance are
displayed in Figure 2.1. The inflow of the basin consists of precipitation in the catchment area. The outflow
of the basin consists of evapotranspiration and river runoff or discharge. The characteristics of the outflow
are determined by separate storage mechanisms which are represented by the rectangular boxes. Those spe-
cific mechanisms were identified because elaborate data on this was present from The Khanh Hoa Ministry
of Agriculture and Rural Development and The Institutes of Water Resources Planning [12]. Many hydro-
logical processes that take place in a basin were not separately treated as the level of detail was too high for
the purpose of this research, instead, they were all included in the ‘Basin’ box. Those processes include, but
are not limited to, groundwater flow, infiltration and percolation. The precipitation and evapotranspiration
data were measured or estimated using remote sensing and validated and calibrated using in situ ground
measurements.
     This chapter treats several parameters of the water balance separately. Sections 2.1, 2.2 and 2.3 discuss
precipitation, evapotranspiration and runoff respectively. They provide answers to research question 3; What
is the local climate in the Cai River basin and (how) has it changed over the past 30 years? Section 2.4 presents
the water use data, answering research question 2; How has the freshwater use in the Cai River basin changed
over the past 30 years? The findings of those sections are then combined to obtain a quantified water balance
in Section 2.5 and 2.6. Lastly, Section 2.7 discusses the expected future changes in the water balance’s main
parameters.

                                                                    Precipitation in basin               Storage

           Evapotranspiration

                                       Irrigation

                                   Water reservoirs                         Basin                          Runoff

                                  Industrial water use

                                                                                     Tourism and
                                                         Domestic water use
                                                                                recreational water use

                                Figure 2.1: Schematization of a Water Balance of a River Basin.

                                                              5
2.1. Rainfall 6
2.1. Rainfall
The rainfall can be measured both in situ as well as using remote sensing. In the Cai River basin, rainfall is
measured in situ measured at two locations: Dong Trang and Nha Trang (the locations of the rain gauges
are shown in Figure 2.3) [2]. The advantage of in situ data is that it has high temporal availability and is
accurate. The downside is its low spatial availability, i.e. it cannot take into account the spatial variability
within the region. Remote sensing data, on the other hand, is a more inaccurate estimation but has high
spatial availability [19]. This research used the TerraClimate data set for remote sensing rainfall data [3]. It
should be noted that this data set does not solely consist of remote sensing data, but combines remote sensing
data with reanalysis and ground-based stations. However, since this is a global model, it is considered less
accurate than the in situ measurements at Dong Trang and Nha Trang.
2.1.1. Current Situation
Figure 2.2 shows monthly averages for the two measurement locations. The seasonal pattern in the basin is
clearly visible: a dry season in the first months of the year and a wet season from September to December.
In the figure, the error bars represent the variability (1 σ) between the years. Interestingly, the standard de-
viations for the in situ measurements were substantially higher. A possible explanation could be that remote
sensing did not capture extreme events very well, hence leading to lower variability.
600 In Situ 600 In Situ
Average Precipitation [mm/month]
Average Precipitation [mm/month]
Remote Sensing Remote Sensing
500 500
400 400
300 300
200 200
100 100
0 0
Jan Feb Mar Apr May Jun Jul Aug Sep Oct Nov Dec Jan Feb Mar Apr May Jun Jul Aug Sep Oct Nov Dec
(a) Dong Trang (b) Nha Trang
Figure 2.2: Monthly Averaged Rainfall Measurements From in Situ and Remote Sensing Data From 1977 to 2015 [2, 3]
Equation 2.1 shows the obtained correlation between in situ and remote sensing data. Herein, p IS and p RS
refer to the precipitation from in situ and remote sensing measurements respectively, both in mm. The cor-
relation coefficient R 2 is often used as a measure of correlation, ranging from -1 to 1. 1 indicates perfect
correlation, 0 indicates no correlation and -1 indicates perfect negative correlation. The fit had an R 2 of 0.66
in this case, which is not very strong, but still indicates that a correlation is present. The results suggested that
remote sensing measurements tend to underestimate the rainfall. Appendix A.3 provides a more elaborate
data analysis.
p IS = 1.38 · p RS − 6.64 (2.1)
Remote sensing is capable of capturing the local differences, although the remote sensing data is considered
less accurate. Analysis of the remote sensing data showed that a clear spatial rainfall pattern is present in the
basin. Figure 2.3 shows precipitation relative to the measurement station in Dong Trang. In this figure, the
western rain gauge is located at Dong Trang and the eastern rain gauge is located at Nha Trang. It is visible
that both measurement locations were situated in relatively dry areas of the basin: the Western part of the
Cai River basin consists of a mountainous area and rainfall was up to 50% higher there. It was decided to
use a combination of in situ and remote sensing data for obtaining a water balance representing the entire
research area; the model uses the spatial pattern from remote sensing but calibrated with the correlation from
Equation 2.1. After these corrections, the yearly rainfall averaged over the entire basin was computed to be
1635 mm.2.1. Rainfall 7
Relative Precipitation (%)
-10
0
+10
+20
+30
+40
+50
Rain gauges
Basin outline
Figure 2.3: Average Yearly Precipitation From 1977 to 2015 in the Cai River Basin Relative to the Precipitation in Dong Trang [3]
2.1.2. Trend Analysis
Yearly averages over the past 30 years were computed to investigate whether the rainfall has changed over
the past 30 years, as Figure 2.4 shows. For the purpose of this report, not only yearly trends were considered
relevant, but trends in the dry and wet season as well. Therefore, the average monthly rainfall was computed
for both the dry and wet season.
The outcome, depicted in the figure, indicated an increase in average rainfall over the years in the wet
season. The precipitation in the dry season, which is of most significance for the saltwater intrusion, has re-
mained constant over the years. These trends are quantified in Table 2.1. The R 2 values indicated a very weak
correlation between the years and precipitation amounts. The high variability of the precipitation between
the years and the relatively small trends caused a low correlation coefficient. However, in this context the goal
is not to predict a dependent variable (precipitation) based on an independent variable (time), which makes
it hard to evaluate trends based purely on R2 . Therefore, the probability of no trend has also been indicated
in the table, as a measure for trend significance. The probability of no trend is defined here as the two-sided
Trendline Total Year
Trendline Dryseason Dry Season
Trendline Rainseason Wet Season
350
300
Rainfall [mm/month]
250
200
150
100
50
0
1960 1970 1980 1990 2000 2010 2020
Year
Figure 2.4: Calibrated Yearly Averages From 1977 to 2015 of Precipitation in the Cai River Basin.2.2. Evapotranspiration 8
p-value for a hypothesis test, where the null hypothesis is a trend of 0. This indication, therefore, pointed out
that the trend is significant for the wet season, despite its low R 2 .
In conclusion, trends in precipitation are present; the data suggested that rainfall has increased dur-
ing the wet season, but not during the dry season. An average monthly increase in precipitation of 0.3
mm/month/year amounted to 3.6 mm/year2 . This is in accordance with the literature, where it is mentioned
that precipitation increases in the coastal zones and that the precipitation slope in the South-Central area
of Vietnam of the past 30 years is around 5 mm/year2 [20]. This strengthens the likelihood of the data and
processing techniques being reliable.
Table 2.1: Trends in Precipitation in the Cai River Basin.
Trend [mm/month/year] R2 Probability of no Trend
Entire Year 0.30 0.044 0.16
Dry Season (Jan-Aug) -0.003 0.0 0.98
Wet Season (Sep-Dec) 0.56 0.084 0.021
2.2. Evapotranspiration
Remote sensing can also measure actual evapotranspiration, which for simplicity will be called evapotran-
spiration (ET) in this report. Several methods have been developed that yield estimates. The data set used for
this trend analysis made use of the Penman-Monteith equation and used daily meteorological reanalysis data
combined with satellite data such as vegetation property dynamics, albedo and land cover [33]. Furthermore,
ET was also measured in situ at one location within the Cai River basin [10].
2.2.1. Current Situation
The data from remote sensing was available over the past 20 years with an eight-day time interval. These
data were converted to monthly data. Figure 2.5 displays a comparison of the in situ data and the remote
sensing data. Their averages amounted to nearly the same of 116.5 and 118.8 mm/month for remote sensing
and in situ, respectively. However, on a monthly basis, they did significantly differ. A similar approach as in
Subsection 2.1.1 was applied, but the correlation was found to be too weak (R2 = 0.046) to use for calibration.
It was decided to only use the remote sensing data for the water balance analysis. In this way, the spatial
gradient of ET was taken into account. Since the yearly totals of in situ and remote sensing measurements
were similar, remote sensing was deemed to be reliable enough for water balance analysis. It was found that
the total yearly ET on average is 1326 mm/year.
2.2.2. Trend Analysis
To investigate changes, the trend in ET over the years was computed. Averaged over the entire year, the ET
showed no long-term trend. Trends did emerge when separating the wet season and dry season, but these
were still not significant. Figure 2.6 shows these trends and a quantification is shown in Table 2.2. One can
conclude that the overall measured ET has shown no significant change. The ET during the dry season also
remained constant. Only ET during the wet season showed a slight increase over the past 20 years.
Table 2.2: Trends in Evapotranspiration in the Cai River Basin.
Trend [mm/day/year] R2 Probability of no Trend
Entire Year 0.0005 0.00 0.91
Dry season (Jan-Aug) 0.0015 0.034 0.75
Wet season (Sep-Dec) 0.0080 0.034 0.45
2.3. Runoff
The runoff in the Cai River basin equals the discharge of the Cai River at the river mouth. No extensive dis-
charge data is available at Nha Trang (near the river mouth). However, daily discharge data was available at
Dong Trang, approximately 30 km upstream.2.3. Runoff 9
Trendline Dry Season
Average Evapotranspiration [mm/month]
Trendline Dry Season Wet Season
160 In Situ Trendline Wet Season
140 Remote Sensing
4.25
Evapotranspiration [mm/day]
120
4.00
100
3.75
80
3.50
60
40 3.25
20 3.00
0 2.75
Jan Feb Mar Apr May Jun Jul Aug Sep Oct Nov Dec 2001 2006 2011 2016 2021
Year
Figure 2.5: Monthly Averages of Evapotranspiration in the Figure 2.6: Yearly Averages of Evapotranspiration in the Cai
Cai River Basin From 2001 to 2016 [10, 33] River Basin [10, 33].
2.3.1. Current Situation
Discharge data from 1983 to 2012 was analysed and averaged per month [1]. Figure 2.7 visualises the result. A
similar pattern as for the precipitation is seen; the lasts months of the year, the wet season, showed the highest
discharge values, albeit with a slight delay with respect to the precipitation. The high standard deviations of
the monthly averages point out that the discharge had substantial deviations in between years. This can
be partially attributed to extreme flood events, where discharge values of more than 1500 m3 /s were often
observed.
400 Nha Trang
Average Monthly Discharge [m3/s]
Average Monthly Discharge [mm]
1600
350 500 Dong Trang
1400
300
Discharge [m3/s]
400 1200
250 1000
200 300
800
150 200 600
100 400
100
50 200
0 0
Jan Feb Mar Apr May Jun Jul Aug Sep Oct Nov Dec 2017-12-01 2017-12-02 2017-12-03 2017-12-04 2017-12-05
Day
Figure 2.7: Monthly Average Discharge of the Cai River at Figure 2.8: Discharge at Dong Trang and Nha Trang During
Dong Trang [1]. December 2017 [1, 10]
In the ideal situation, data of the discharge at the river mouth is available completely or partially, such that
the discharge equals the runoff. For this research, discharge data near the mouth (at Nha Trang) was only
available from one measurement campaign of four days, from the 1st of December 2017 to the 4th of Decem-
ber 2017 [10]. Data for both locations are shown in Figure 2.8. It seems that an unusually high flood event
occurred in this period; the discharge at Dong Trang ranged between 173 and 1700 m3 /s within a few days.
These data were therefore not deemed sufficient to do any calibration by comparing actual values at the same
times. The discharge at Nha Trang, i.e. near the mouth, was more constant over time. The average over these
four days is 139 m3 /s. This can be compared to the average discharge at Dong Trang in December of 158 m3 /s.
The catchment area sizes upstream of Nha Trang and Dong Trang are 1892 and 872 km2 respectively, so
some difference in discharge can be expected. However, it was hard to find a correction factor to convert
discharge measurements from Dong Trang to discharge at the mouth from these data. From the time series
at the start of December 2017, it seems that before the flood event, the discharges were somewhat similar.
Therefore, the rough assumption was made that the discharge at Dong Trang was approximately equal to the
discharge at the mouth. The total amount of runoff per year then amounted 2.07·109 m3 or, when scaled to
the basin area, 1080 mm.
In addition to yearly and monthly means, it is also of importance to analyse the probability distribution
of the discharge. Figure 2.9 shows the probability density function of the measured daily discharge in the
domain of 0 to 250 m3 /s. Although the daily mean was 65 m3 /s, the median (35 m3 /s) and mode (28 m3 /s)
were substantially lower due to the positive skewness of the distribution. For modelling the saltwater in-
trusion, especially the lower extremes are of interest since these usually lead to higher saltwater intrusion.2.3. Runoff 10
Figure 2.10 displays the cumulative distribution function of the discharge. From this figure, it can be derived
that low discharges, below 10 m3 /s, occurred on approximately 7% of the days. It should be noted, however,
that extremely low discharges at Dong Trang are not likely to occur simultaneously at Nha Trang, since low
discharges are mitigated by releasing water from water reservoirs downstream of Dong Trang (see Subsec-
tion 2.4.4).
The low values are important for saltwater intrusion, but the high values are of more interest for the water
balance. The cumulative contribution to the total discharge is shown in Figure 2.11 to further investigate the
contribution of high extremes. The figure points out how most runoff in the catchment happened during
only a small portion of the days. Only 13% of the days showed discharge values of over 100 m3 /s, but these
events contributed to more than 50% of the total discharge.
1.0
0.020
0.8
Propability Density [s/m3]
Cumulative Propability
0.015
0.6
0.010 0.4
0.005 0.2
0.000 0.0 0
0 50 100 150 200 250 10 101 102 103
Discharge [m3/s] Discharge [m3/s]
Figure 2.9: Sample Probability Density Function of Daily Figure 2.10: Cumulative Distribution Function of Daily
Averaged Discharge at Dong Trang From 1983 to 2016. Averaged Discharge at Dong Trang From 1983 to 2016.
Cumulative Contribution to Total Discharge
1.0 Trendline Total Year
Trendline Dry Season Dry Season
0.8 Trendline Wet Season Wet Season
Average Monthly Discharge [m3/s]
Average Monthly Discharge [mm]
250
0.6 300
200
0.4 150 200
100
0.2 100
50
0.0 0 0 0
10 101 102 103 1985 1990 1995 2000 2005 2010
Discharge [m3/s] Year
Figure 2.11: Cumulative Contribution to the Total Discharge
Figure 2.12: Yearly Trends in Runoff at Dong Trang.
at Dong Trang From 1983 to 2016.
2.3.2. Trend Analysis
In a similar way as was done for the precipitation and ET, the runoff data was also further analysed for yearly
trends. The yearly averaged values for the entire year, dry season and wet season are plotted in Figure 2.12.
Table 2.3 shows The trends and probabilities of no trend. The results displayed in both the figure and the
table suggest that the yearly averaged discharge can be assumed to have roughly remained constant. The
seasonal trend of the runoff seems to have changed over the past 30 years. The discharge in the wet season
had a slight downward trend and in the dry season, an upward trend is visible. However, both trends cannot
be considered significant.
A possible explanation for shrinking the difference between the dry and wet season could be reservoir
management. Nevertheless, the inflow points of the big reservoirs (Figure 2.15) are located downstream of
the measurement location, so the influence of reservoir management is likely to be limited. In previous sec-
tions, it was already shown that the precipitation had increased, while the yearly averaged ET remained con-
stant. This would, in theory, lead to an increase in runoff as well, but the data did not show that. Section 2.5
investigates this imbalance more thoroughly.2.4. Water Demand 11
Table 2.3: Trends in Runoff in the Cai River Basin.
Trend [m3 /s/year] R2 Probability of no Trend
Entire Year -0.071 0.006 0.91
Dryseason (Jan-Aug) 0.38 0.003 0.35
Rainseason (Sep-Dec) -0.69 0.014 0.58
2.4. Water Demand
The water balance in Figure 2.1 is a simplified diagram of reality where categories are grouped. On the one
hand, as described in Section 2.1 and Section 2.2, natural processes such as precipitation and evapotran-
spiration control the water flow of the system. On the other hand, human influence (partly) controls how
the water moves through the system and with what quantities. The human-induced categories of the water
balance analysed in this section are:
• Irrigation: Cropland in the Cai River basin needs irrigation to grow, especially in the dry season.
• Aquaculture: Marine species farmed for food production.
• Livestock: Animals farmed for meat production.
• Domestic: Water use in the daily lives of people. This ranges from flushing the toilet to drinking water.
• Tourism: Water use at touristic attractions and tourists personal water use.
• Industrial: Water use in the industrial sector. This includes water used for cooling and cleaning, but
also water that is included in the final product.
• Minimum discharge (DC): Water reserved to maintain the minimum discharge needed in the Cai River
in order to sustain the functions of the river.
This section makes use of data obtained from The Khanh Hoa Ministry of Agriculture and Rural Development
and The Institutes of Water Resources Planning [12]. The water demand per category is quantitative, for the
exact numbers per category and per month the reader is referred to Appendix A.1. It was not specified how
the data was obtained and thus it is unclear what the uncertainty ranges are. Figure 2.13 shows the total
expected water demand in the Cai River basin per month of the year 2015. It can be seen that in the dry
season, from January to August, the water demand is 3-4 times higher than in the wet season. This is explained
by the increased water demand for irrigation and minimum discharge in the dry season as opposed to the wet
season, where irrigation and discharge occur naturally.
Figure 2.14 illustrates the distribution of the water demand in the Cai River basin over the different cat-
egories in the year 2015. It can be seen that the water demand for irrigation and minimum discharge are
dominant. In the dry season the part for minimum discharge significantly increases, while, on the contrary,
the other categories contribute less to the total water demand. An explanation for this is that only in the dry
season water is needed to maintain the minimum discharge, all other categories are slightly less seasonal.
The water demand for aquaculture, livestock and industry are below 1% of the total water demand and were
therefore not looked into thoroughly in the rest of the report.
2.4.1. Irrigation
In the area mainly rice and mango are produced covering approximately 15% of the land area in the Cai River
basin. According to plans concerning the irrigated land use area, the total farming area is reduced and more
focus is placed on the development of tourism services throughout the Khanh Hoa province [12].
2.4.2. Domestic Water Use
Domestic water use consists of all the water extracted from the water source that people use in their homes
and gardens. After the water has been used, a part is returned to the source and a part is ‘consumed’. The
consumed water does not return to the source and is lost due to evaporation or incorporation in products
[32].2.4. Water Demand 12
40
2015
35
Water Demand [mm/month]
30
25
20
15
10
5
0
Jan Feb Mar Apr May Jun Jul Aug Sep Oct Nov Dec
Month
Figure 2.13: Water Demand per Month for the Year 2015 in the Cai River Basin. [12]
2.4.3. Tourism
Tourism is a key sector in the Khanh Hoa province. Tourists mainly visit for relaxation and cultural sites. It
results in good economical returns and therefore the Khanh Hoa province exploits its touristic attractions
maximally. The result of this is an increased amount of tourists travelling to the Khanh Hoa province and the
city of Nha Trang. Tourists use relatively large amounts of water and thus the water demand for the sector has
increased. [30]
2.4.4. Water Reservoirs and Minimum Discharge
In the wet season in the Cai River basin there is a water excess, while in the dry season there is a water short-
age. To flatten the curve, the provincial government of Khanh Hoa built three water reservoirs with a capacity
larger than 1 million m3 in the Cai River basin in the last 20 years (the locations and capacities are shown in
Figure 2.15). Their total effective capacity is 35.3 million m3 . The main purpose of the reservoirs is to serve
as a buffer to maintain a sufficient freshwater supply in the dry season. The reservoirs are filled during the
wet season. In addition to the water reservoirs, there are also two hydropower plants with a total capacity
of 74 MW in the Cai River basin [24]. The discharge of the Cai River is partly human-induced because of the
reservoirs and the hydropower plants. This makes it possible to maintain an artificial minimum discharge in
the Cai River. All three large reservoirs have their location of outflow downstream of Dong Trang, the location
of the measurement campaign of the discharge of the Cai River. Therefore, when the reservoirs are emptied
in the dry season, one can expect an underestimation of the discharge at the river mouth compared to the
measured data obtained in Dong Trang.
2.4.5. Influence of Anthropogenic Water Demand on the Water Balance
On a yearly basis, the change in storage in a water basin was assumed to be zero, provided that there are no
significant changes in the boundary conditions and the characteristics of the basin. On a monthly basis, the
change in storage can play a role. This is because from month to month the boundary conditions change
significantly. The tropical monsoon climate in Vietnam has large precipitation and lower temperatures in the
rainy season compared to the dry season. Different weather conditions provide different water demand pat-
terns, for example, more irrigation is needed in the dry season, as can be seen from Figure 2.13 and Table A.1.
Water demand as depicted in Figure 2.1 takes water away from the basin. During the time that this water is
used, it can be considered in storage and will therefore not contribute to the Cai River discharge. After usage,
part of the initially captured water is either returned as discharge or ‘consumed’. Consumed in this context
means that the water has been removed from the basin via evaporation, transport or product incorporation.
Water consumption varies between 80% for irrigation and 20% for other domestic/anthropogenic demands
[21]. So especially for demand types other than irrigation, a large part is returned to the basin resulting in a
discharge. Water use, therefore, does not necessarily always lead to a decrease in discharge, but to a delay inYou can also read