DimSUM: Dimension and Scale Unifying Map for Visual Abstraction of DNA Origami Structures - CG TU Wien
←
→
Page content transcription
If your browser does not render page correctly, please read the page content below
Eurographics Conference on Visualization (EuroVis) 2018                                                                            Volume 37 (2018), Number 3
J. Heer, H. Leitte, and T. Ropinski
(Guest Editors)

                DimSUM: Dimension and Scale Unifying Map for Visual
                     Abstraction of DNA Origami Structures

                                       H. Miao,1,2 E. De Llano,2 T. Isenberg,3 M. E. Gröller,1,4 I. Barišić,2 and I. Viola1

1 TU   Wien, Austria            2 Austrian   Institute of Technology, Austria   3 Inria   and Université Paris-Saclay, France   4 VRVis   Research Center, Austria

Figure 1: A nanotube transitions from a 3D shape model to a diagrammatic 2D representation and finally to a clean 1D alignment of single
strands. Orthogonal to the dimension axis is the scale axis, which shows different semantic scales. The orange rectangle tracks a single strand
through the dimensions and scales.

        Abstract
        We present a novel visualization concept for DNA origami structures that integrates a multitude of representations into a
        Dimension and Scale Unifying Map (DimSUM). This novel abstraction map provides means to analyze, smoothly transition
        between, and interact with many visual representations of the DNA origami structures in an effective way that was not possible
        before. DNA origami structures are nanoscale objects, which are challenging to model in silico. In our holistic approach we
        seamlessly combine three-dimensional realistic shape models, two-dimensional diagrammatic representations, and ordered
        alignments in one-dimensional arrangements, with semantic transitions across many scales. To navigate through this large,
        two-dimensional abstraction map we highlight locations that users frequently visit for certain tasks and datasets. Particularly
        interesting viewpoints can be explicitly saved to optimize the workflow. We have developed DimSUM together with domain
        scientists specialized in DNA nanotechnology. In the paper we discuss our design decisions for both the visualization and the
        interaction techniques. We demonstrate two practical use cases in which our approach increases the specialists’ understanding
        and improves their effectiveness in the analysis. Finally, we discuss the implications of our concept for the use of controlled
        abstraction in visualization in general.
        CCS Concepts
        •Human-centered computing → Scientific visualization; Visualization theory, concepts and paradigms; •Applied computing
        → Computational biology;

1. Introduction                                                                           and biotechnology. DNA nanotechnology exploits the base pairing
                                                                                          capability of DNA and the synthesis of short staple strands to fold
DNA nanotechnology is a young yet rapidly progressing field that
                                                                                          the long scaffold strand (hence the name origami). DNA origami
aims to design nanoscale devices by employing DNA as the main
                                                                                          is a widely established method for creating DNA-based nanoscale
building block [See82]. The great chemical stability of DNA and
                                                                                          shapes as introduced by Rothemund [Rot06].
the availability of synthetic DNA production facilities make it a pre-
ferred material for intricate nanostructures. The resulting, increas-                        For this application domain we designed and developed an in-
ingly complex nanoscale shapes show great potential in medicine                           teractive data exploration and modeling approach that relies on a

© 2018 The Author(s)
Computer Graphics Forum © 2018 The Eurographics Association and John
Wiley & Sons Ltd. Published by John Wiley & Sons Ltd.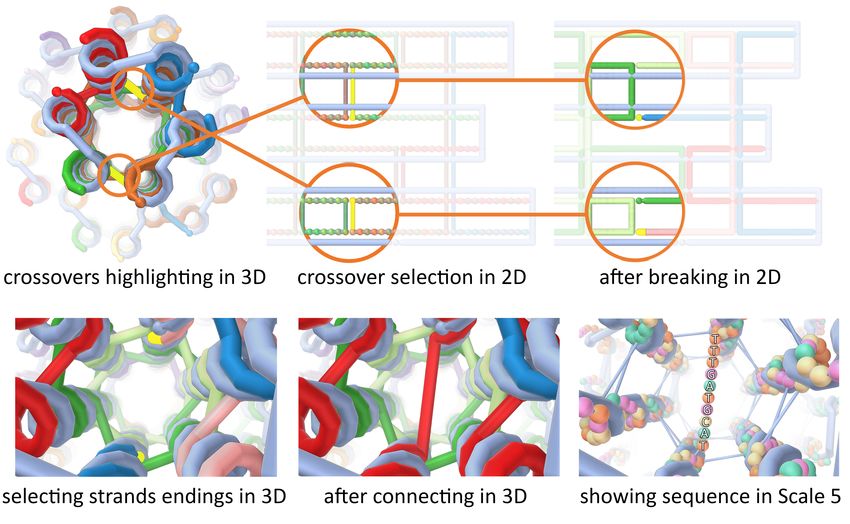
H. Miao & E. De Llano & T. Isenberg & M. E. Gröller & I. Barišić & I. Viola / DimSUM: Dimension and Scale Unifying Map

two-dimensional abstraction space. It spans multiple conceptual
                                                                                              3D
scales as well as multiple spatial dimensions for the data represen-
tation (Fig. 1). We use it as a navigational map to select the best
suitable visual representation for a specific task (Fig. 2). With this

                                                                             Dimensions (d)
concept we go well beyond the approach taken in the domain’s
popular software tool caDNAno [CD16], which implements func-                                  2D
tionality of the DNA origami method and enables scientists to design
nanoscale shapes in silico. However, advanced computational DNA
design concepts are needed, as the current tools are not designed for
the ever-increasing complexity of DNA nanostructures. Available
                                                                                              1D
tools currently only support the design of 3D shapes on 2D DNA
                                                                                                    0       1       2       3       4       5       6        7       8       9
diagrams. As a result, the diagrams exhibit a high degree of clutter                                                                Scales (s)
and overlapping edges. Although domain scientists employ different
representations of these complex structures, they are not able to            Figure 2: The DimSUM abstraction map is spanned by a dimension
mentally link between them visually. The resulting cognitive load            and a scale axis and integrates existing and novel representations.
on their workflow increases the overall duration of designing intri-
cate nanostructures and decreases the confidence in their in silico
design. Moreover, undiscovered errors in the design can lead to                tructure representations. We extend the multi-scale approach of
failed experiments, which can take from several weeks to months                Miao et al. [MDLS∗ 18] with an orthogonal dimension axis to
until the self-assembled structures are inspected in a microscope. As          utilize the strength of 2D and 1D layouts to analyze, make sense
a consequence, these problems in the in silico design currently slow           of, and especially modify the complex structures.
down the research progress.                                                  • With this design, we advance the discussion of the concept of
                                                                               abstraction in illustrative visualization. We demonstrate that the
   With our 2D abstraction map DimSUM, we integrate and visually               spatial layouting of the visual elements along the dimensionality
link the representations of the 3D target structure, the 2D diagrams,          is an important axis of abstraction. The axis goes from a realistic
as well as 1D arrangements to enable designers to effectively ap-              shape depiction to a successfully simpler representation of the
ply manipulations in the dimension that is most suited. With Dim-              elements where alignment details are gradually abstracted.
SUM we also integrate seamless transitions that allow researchers            • We integrate a number of specific interaction techniques that
to mentally link different representations. With this multi-scale and          support the DimSUM design including abstraction axis snap-
multi-dimensional approach we thus facilitate researchers to gain              ping, guiding (heat-)maps, and saving viewpoints to support both
more confidence in the design and in the end enable them to create             navigation of the abstraction map as well as the analysis of task-
increasingly more intricate structures. They can effectively analyze           specific interaction behaviors.
and understand the structural properties of these complex objects, to
gain confidence in the in silico design before carrying out the exper-
                                                                             2. Background: DNA Origami
iment in the laboratory itself. Ultimately this significantly reduces
the time and costs needed for typical design operations.                     DNA origami [Rot06] relies on the self-organizing nature of DNA
                                                                             molecules to construct nanoscale objects. The method uses one long
   Our interactive visualization design is based on a close collab-          (approx. 8000 bases) single stranded DNA (ssDNA) and numerous
oration with an interdisciplinary team that aims to create a DNA             shorter (20–80 bases) synthetic ssDNA strands. These shorter staple
nanorobot, which consists of several complex DNA origami com-                strands bind to specific regions on the long scaffold strand to fold it
ponents. We started by analyzing the requirements and the needed             together into a targeted shape. A strand has a directionality and it
visual representations of this domain. Based on this analysis, we            goes from the 5’ to the 3’ end of the nucleotide sugar ring, which
extended a previous multi-scale concept [MDLS∗ 18], which only               is relevant for the anti-parallel pairing of ssDNA. DNA nanotech-
abstracts the 3D structure on one scale-axis. Indirect 2D and 1D             nology exploits the base pairing capability of DNA, i. e. two strands
representations are widely used in the domain, due to their occlusion        only pair and form double stranded DNA (dsDNA) if the sequence
free layout, but they are not suited for estimating the actual 3D shape      of nucleotides are complementary to each other. The Watson-Crick
of the structure. Therefore, we integrate the 2D and 1D represen-            complements [WC53] describe that Adenine (A) only pairs with
tations into a comprehensive and novel abstraction space, spanned            Thymine (T) and Cytosine (C) pairs only with Guanine (G). The
by a scale and a dimension axis. Using our resulting abstraction             helices are then held together by crossovers at designated positions,
map DimSUM as a tool to navigate the different representations,              where one ssDNA switches from one helix to an adjacent one. Con-
we designed a number of additional interaction techniques that sup-          straining the adjacent helices to potential crossover locations results
port domain scientists in their tasks. We illustrate these practical         in a regular pattern of dsDNA alignment, which facilitates the cre-
tasks needed by our collaborators, using several design studies. Our         ation of stable structures. Based on this, Douglas et al. [DMT∗ 09]
contributions are as follows:                                                proposed two lattices, a honeycomb and a square lattice, for their
                                                                             caDNAno tool.
• An integration of novel and existing DNA nanostructure repre-
  sentations into an interactive abstraction map that allows domain             The DNA used in these experiments is typically described by
  scientists to perceive and understand the conceptual space and             different structural representations as shown in Fig. 3. Scientists
  geometric relationships between established and new DNA nanos-             thus have to consider each representation carefully when designing

                                                                                                                                                               © 2018 The Author(s)
                                                                                              Computer Graphics Forum © 2018 The Eurographics Association and John Wiley & Sons Ltd.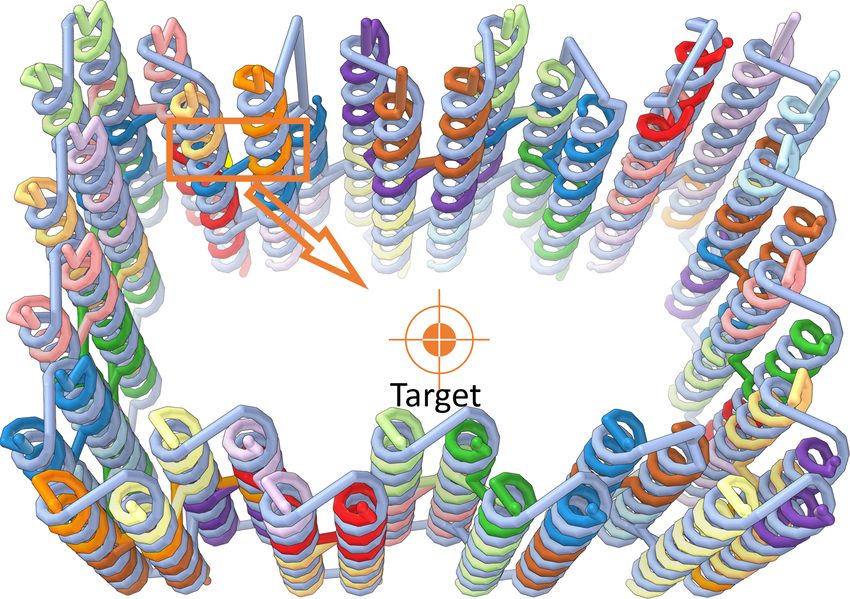
H. Miao & E. De Llano & T. Isenberg & M. E. Gröller & I. Barišić & I. Viola / DimSUM: Dimension and Scale Unifying Map

these nanostructures. The primary structure is determined by the                         helps the user to understand the final shape of the structure. Using
sequence of ssDNA. It is usually depicted as a string of bases from                      an alternative representation, Benson et al. [BMG∗ 15] described a
the 5’ to the 3’ direction, which motivates the 1D view we use in our                    technique to semi-automatically model polyhedral nanostructures in
representation later-on. The DNA’s self-assembly is determined by                        3D space, representing nucleotides as spheres. For both types of rep-
the sequence of the scaffold and staple strands. The scientists need                     resentations the authors have made well-motivated design decisions
abstract representations, which allow them to inspect aspects of the                     that allow the users to build the desired target shape. Various struc-
individual strands. For example, long staple strands (> 80 bases)                        tural details are not described, which are necessary for advanced
are increasingly costly to synthesize. In addition, the occurrence of                    tasks such as structural modifications of functional nanostructures.
C and G on a strand have to be carefully considered as they tend                         The 2D diagrams, for example, are not well suited for tasks in which
to be stickier than other nucleotides. Finally, a high frequency of                      spatial features have to be considered. Nonetheless, the 2D diagrams
crossovers per strand could have an adverse effect on the stability of                   by Douglas et al. [DMT∗ 09] are widely known in the field of DNA
the structure. All of these analysis steps require a separate view on                    nanotechnology. We thus integrate them as part of our 2D view, and
each staple strand, yet in the state-of-the-art-tools like caDNAno the                   extend them with seamless transitions to other representations of
strands are interwoven in 2D DNA diagrams.                                               different dimensionality such as 3D views.
   We employ 2D diagrams to show the secondary structure, which                             Visual abstraction: The visual abstraction of spatial data is a
describes the base paring interaction of the ssDNA, that forms the                       core concept of illustrative visualization [VI18] that has been ap-
dsDNA. The 2D view indicates adjacencies of the double helices by                        plied in numerous domains.† For example, the schematization of
placing the double strands underneath each other. This 2D layout for                     network data such as streets has been studied in detail, both for
the design of a 3D structure results in many connections between                         traditional geography applications [CdBvK05] and for artistic pur-
adjacent double strands in 3D that are not neighbors in the 2D                           poses [Ise13]. A continuous transition of different presentation
diagram, cluttering it with many overlapping edges as the structure                      styles of city models based on task, camera view, and image resolu-
grows in complexity (see the example in Fig. 3). The resulting                           tion has been proposed by Semmo et al. [STKD12]. Researchers
diagram is difficult to understand—in a situation where a correct                        have also investigated the non-uniformly controlled adjustment of
design is crucial for the success of experiments.                                        abstraction [AS01] to support, in particular, navigation. Similar to
                                                                                         the linear structures in cartography, the DNA strands in our applica-
   The three-dimensional shape of the target structure, finally, results                 tion domain exhibit information that is not always relevant. As an
from the tertiary structure that encodes the spatial 3D model. This                      example, for certain analysis tasks the twist of the double helix or
motivates our use of an additional 3D representation. The correct                        the pathway might be irrelevant. In our 1D view we thus straighten
folding of the scaffold strand, for example, can only be achieved if                     the DNA strands and indicate crossover locations—in a way similar
the spatial properties of the strands are carefully considered. The                      to subway lines and maps which share similar characteristics to
exact folding can only be seen by imaging the results of in vitro                        preserve topological information [Rob12]. For this representation
experiments—the best in silico predictions of foldings are computa-                      we are also inspired by the straight alignment of single tracks as
tionally very expensive and have limitations. An approximate 3D                          proposed by Wu et al. [WTLY12] for the purpose of customizing
representation of what the nanostructure would look like if it were to                   travel paths.
fold properly, however, already allows the domain experts to study
the properties on the model. Another advantage is that distances can                        A core advantage of visual abstraction is that it can preserve a
be estimated in a 3D spatial model—a crucial task for the domain                         visual variable or the (screen) space for the depiction of additional
scientists. The combination of this model with already tested design                     data [VI18]. Cipriano and Gleicher [CG07], for example, abstracted
techniques increases the confidence in the in silico constructions.                      the molecular surface while keeping significant shape features, al-
                                                                                         lowing them to place glyphs on the surface to encode additional
                                                                                         properties. We use the same principle in our work to depict data, for
3. Related Work                                                                          instance, about the stability of the DNA origami structures.
Our work builds on concepts and methods in DNA nanostructure                                A lot more recent work on visual abstraction concerns the dedi-
visualization, visual abstraction, and HCI, which we review below.                       cated control of the amount of abstraction to support various visu-
                                                                                         alization purposes. One way to control the degree of abstraction is
   DNA nanostructure visualization: For our visualization con-
                                                                                         to show different representations of the same object, depending on
cept, we integrate existing as well as several novel representations.
                                                                                         the distance to the viewer. Parulek et al. [PJR∗ 14] demonstrated this
Among the former, diagrams have been used by domain researchers
                                                                                         approach also for molecular data, where it serves the visual compre-
as simplified DNA representations for a long time. In Rothemund’s
                                                                                         hension and also makes it possible to visualize complex biological
work on DNA origami [Rot06], for instance, dsDNA is depicted in
                                                                                         environments at interactive rates [LMAPV15]. In addition to such an
an unrolled way, showing it as colored arrows to indicate the ssDNA
                                                                                         application, controlled abstraction can also support the exploration
and their crossovers. Douglas et al. [DMT∗ 09] proposed a tool to
                                                                                         of different semantic scales. Miao et al. [MDLS∗ 18], integrated
rapidly prototype DNA origami structures based on a similar rep-
                                                                                         several representations of DNA nanostructures and arranged them
resentation. In addition, he depicts the arrangement of the dsDNA
on a lattice that shows the structure from an orthogonal direction.
Based on the regular appearance of potential crossover positions                         † For a more complete survey of related work on visual abstraction we refer
on the dsDNA, this representation leads to a hexagonal honeycomb                         to Viola and Isenberg’s recent survey/meta paper on the subject [VI18]. Here
lattice and a square lattice. In addition, a view of the target 3D form                  we only point out aspects that closely relate to or inspire our own work.

© 2018 The Author(s)
Computer Graphics Forum © 2018 The Eurographics Association and John Wiley & Sons Ltd.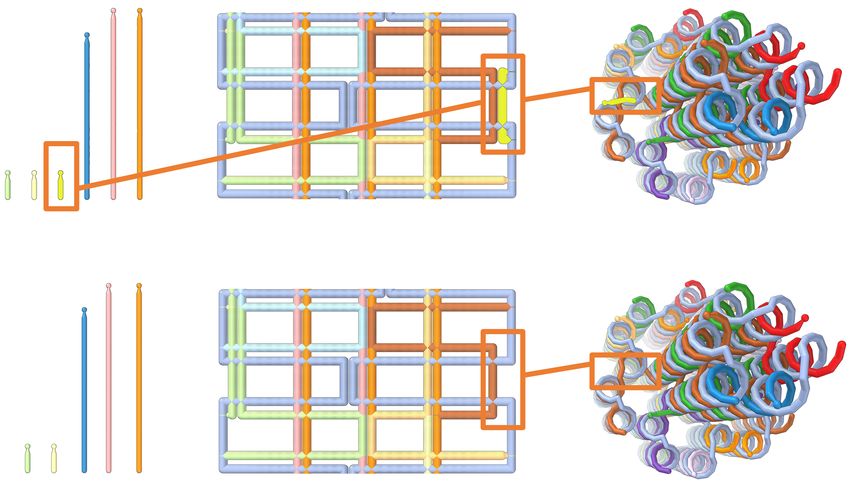
H. Miao & E. De Llano & T. Isenberg & M. E. Gröller & I. Barišić & I. Viola / DimSUM: Dimension and Scale Unifying Map

on an axis of semantic abstractions that smoothly controls the rep-          concepts of parts of the nanorobot. The existing tools in the DNA
resentation. We use their linear interpolation-based transition and          nanotechnology domain to support such complex work are reaching
adapt the ten semantic scales to our 2D and 1D layouts. We add the           their limits. This is the case in terms of functionality and especially
abstraction along different spatial dimensions to facilitate a much          in terms of available visual representations for the features of these
more comprehensive exploration of DNA origami structures that                structures. From early-on, many challenges emerged regarding the
also integrates 2D schematics and 1D alignments of DNA strands.              visualization and modeling of the involved complex structures. f
                                                                             C1 was thus asked to develop a new visualization concept and, ulti-
   This process leads to the creation of a multi-dimensional abstrac-
                                                                             mately, a system required for reaching the goal of creating functional
tion space [VI18] that can be used for the exploration of visual
                                                                             DNA nanorobots using stable DNA origami structures. Based on
structures by assisting users to mentally integrate different repre-
                                                                             observations, interviews, and focus group discussions, C1 extracted
sentations. Zwan et al. [vdZLBI11] were the first to construct a 3D
                                                                             the necessary context and challenges (Sect. 2). Together with the
abstraction space with several components: structural abstraction
                                                                             entire team, he derived the tasks and the design considerations for
(‘geometric abstraction’ in Viola and Isenberg’s terminology), ab-
                                                                             the visualization system. For example, domain scientists analyze
straction of the illustrativeness, and different degrees of support of
                                                                             different structural properties using different layouts, as described
spatial perception (the latter two are ‘photometric abstractions’ in Vi-
                                                                             in Sect. 2. Then, they would like to directly examine and manipulate
ola and Isenberg’s terms). Recently, Mohammed et al. [MAAB∗ 18]
                                                                             the structure in the appropriate layout. C1 also extensively collab-
discussed a similar concept for the controlled abstraction of connec-
                                                                             orated with a physicist (C3), and C1 and C3 were responsible for
tomics data. They constructed a 2D abstraction space, the first axis
                                                                             developing a novel software system required for reaching the goals
depicting representations of astrocytes and the second axis depicting
                                                                             of the ambitious nanorobot project. In addition, a biochemist (C4)
neurites. In contrast to their work, our approach is more general and
                                                                             focused on the design of DNA origami structures, while another
not limited to two structures, as our abstraction map is spanned by
                                                                             molecular biologist (C5) was specializing in the creation of novel
different axes of abstraction (scale and dimension).
                                                                             functional structures. C4 and C5 were also responsible for carrying
   While we employ a similar interaction concept in our work, we             out the experiments and assembling the designed nanostructures in
augment the novel DimSUM abstraction map with specific interac-              the laboratory, after the in silico design was finished.
tion techniques that specifically support navigation. Furthermore,
                                                                                Depending on the scientists’ subgoals and tasks, they use differ-
we enable viewers to control the transition between 1D, 2D, and
                                                                             ent representations for modeling, editing, analyzing, and creating
3D space without constraints. The dimensional transitions act as
                                                                             conceptual designs. For instance, C2 and C4 heavily relied on 2D
dedicated illustration tools to support the understanding of the rela-
                                                                             diagrams where the structure can be quickly modeled. This work
tionships between the dimensions.
                                                                             requires a deep understanding of the relationship between the 2D
   Interaction: The interaction facilitated by the DimSUM wid-               diagrams and the associated 3D model—yet they had no direct way
get relates to the concept of multiple coordinated viewss (MCVs)             of manipulating the structure in 3D space. C5 depended on having a
[BC87, BMMS91, Rob07, Wil08]: Users interact with the presented              detailed view on the atomic configuration for changing nucleotide
data and visually inspect them through different views that are              conformations at an atomic level with a 3D spatial model. Since
linked to each other. However, our domain users require operations           he collaborated with C4 for trying to connect the different compo-
on many scales, dimensions, and their intermediate transition states.        nents together, he needed a way to understand the newly designed
Having many views using MCVs would not be feasible, as the                   structure in 2D as well. This integrated handling of representations
single views would get too small. The DimSUM widget provides                 across spatial dimensions is not possible with existing tools. The
a different interaction concept as it allows users to transition be-         generation of functional structural motifs required C3 to understand
tween representations shown in another view. Our interaction is thus         the relationship between the conformation of atoms and the twists
more akin to approaches like Jianu et al.’s [JDL09] exploration of           of the double helices. For scaffold routing, she did not require a
three-dimensional brain fiber tracts using a previously generated            realistic spatial model, but needed to see the entire structure in 2D
abstract 2D representation. We use animations to transition between          and without visual occlusion. To evaluate the potential crossovers,
the differently abstracted representations. Animation is shown to            she relied on analyzing potential crossover locations in a 3D view
facilitate comprehension, learning, and memory communication by              and also on being able to manipulate the structure in the same view.
Tversky et al. [TMB02] and has been previously applied for molec-            After finalizing the design, the experts exported the sequence of
ular abstractions by Sorger et al. [SMR∗ 17]. In addition, we also           single strands as a simple sequence of the bases (Fig. 3). While it
employ brushing and focusing [BMMS91] for selecting elements                 was common that this sequence of strands would still be modified,
and observing their transition through dimensions and scales.                there was no way to relate these changes back to the initial 2D or 3D
                                                                             representations. In summary, the current in silico design process is
                                                                             inflexible and complex. New visualization technology that integrates
4. Methodology and DimSUM Concept                                            the different representations is urgently needed.
Our work has been motivated by collaborations with a team of DNA
nanotechnology researchers whose ambitious goal is to create a cell-
                                                                             4.1. DimSUM: Integration of Dimension and Scale
drilling nanorobot. The first author (C1) of this paper, a visualization
researcher, has been working for 11 months as a member of the nan-           As caDNAno is the state-of-the-art tool to create DNA origami struc-
otechnology team and works 50% of his time at their lab. The team            tures, we focused on its data representations. We demonstrate our
is led by the Principal Investigator (C2) who develops innovative            design concept on a prototypical nanotube, consisting of a smaller

                                                                                                                                                  © 2018 The Author(s)
                                                                                 Computer Graphics Forum © 2018 The Eurographics Association and John Wiley & Sons Ltd.
H. Miao & E. De Llano & T. Isenberg & M. E. Gröller & I. Barišić & I. Viola / DimSUM: Dimension and Scale Unifying Map
(a) d = 3.0, s = 2.0 (b) d = 3.0, s = 4.5 (c) d = 3.0, s = 9.0
Figure 4: Cylindrical nanotube: examples of representations in 3D,
i. e., d = 3.0 and variable scales s.
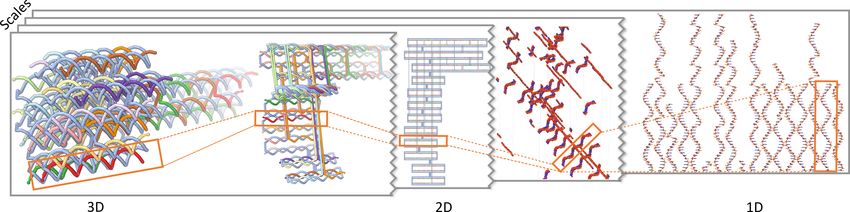
Figure 3: We provide many ways of interacting with and seamlessly
transition between multiple structural representations using the
DimSUM. Here we show which parts of the abstraction map depict
equivalent content as the state-of-the-art tool caDNAno.
shaft and a wider body, as shown in Fig. 4. We used caDNAno’s
automated staple placement to create it. The scientists did not apply Figure 5: The 2D diagrammatic representation and several exam-
any further modifications, so that we can demonstrate the use of our ples of views are shown where d = 2.
approach to analyze and improve the structure. The nanotube has
a length of 260 Å and a diameter of 50 Å at the shaft and 120 Å at
the body. The scaffold is 1003 nucleotides long and the structure are not required to mentally link to the 3D spatial model from a
is folded by 24 staple strands. In Fig. 3 we compare the views that 2D view when applying modifications because they are able to edit
caDNAno provides and show how we integrated equivalent ones directly in 3D space.
into our DimSUM abstraction space. Each of the four boxes depicts
2D Representations. Abstract DNA diagrams are widely em-
a view provided in caDNAno. We isolate the different spatial di-
ployed in the domain due to their visual occlusion-free layout. The
mension (d) of the representations and treat them as one axis of our
arrangement in 2D facilitates an overview of the entire structure. In
abstraction space. In addition, we also use different semantic scales
contrast to the existing representations, we use the same semantic
(s) of DNA nanoscale structures [MDLS∗ 18] as a second abstraction
scale representations as in 3D space (Fig. 2) so that the scientists
axis. By arranging the existing representations appropriately and
can choose the scale most appropriate to their tasks (e. g., Fig. 5).
adding the missing ones, the two axes create a unifying, continuous
space to access and interpolate between representations (Fig. 2). We Equivalent to the 3D representation, the grey tube depicts the
first describe the three different spatial dimensions. Afterwards we scaffold strand and the colored tubes represent staple strands. In
discuss the transitions between them and interaction mechanisms to an alternating manner, the staple strands are placed underneath or
assist in the navigation. above the scaffold strand with a distance of 5 Å. The vertical distance
between the double strands is now 20 Å which guarantees that the
3D Representations. We based our three-dimensional represen-
complementary strands are spatially close to each other.
tations on Miao et al.’s [MDLS∗ 18] continuous sequence of multiple
semantic representations of DNA nanostructures. These representa- With this approach we distribute the complexity of traditional
tions range from concrete (all-atoms) to abstract (double strands). diagrams among several semantic scales. Depending on the scale, we
We extended their concept by more accurately representing the allow the scientists to view detailed features such as atoms and bond
atoms as spheres with van der Waals radii, encoding the 5’ to 3’ conformations in 2D or to simplify the ssDNA to colored tubes.
direction of ssDNA in Scale 5 and 6, and representing the strand In addition, the depiction of complementary strands in parallel,
in the most abstract scale as a tube with a realistic radius of 10 Å, without the helicity of the strands, is automatically provided by our
which the dsDNA occupies (Fig. 4). semantic abstraction in Scales 3–7. This feature allows the user to
get a quick glance of the sequence of a strand and its complementary
These 3D representations realistically encode the spatial arrange-
counterpart. Except for translations in one plane and zooming into
ment of the DNA origami model after self-assembly. It is important
details, the user can thus explore the entire structure without having
to assess the final overall design (i. e., size and space that the struc-
to change the view angle to account for visual occlusions.
ture occupies) but also to estimate the distances between nucleotides.
The multiple scales allow the scientists to visualize the structure 1D Representations. After the 2D representations have already
without distracting clutter of the 2D views. Most importantly, they removed parts of the spatial context in favor of schematization, 1D
© 2018 The Author(s)
Computer Graphics Forum © 2018 The Eurographics Association and John Wiley & Sons Ltd.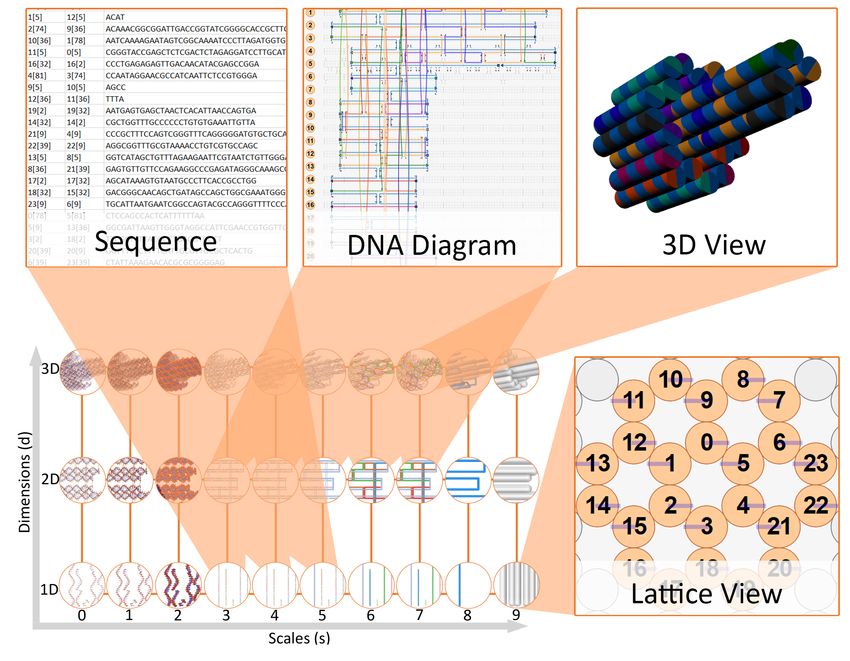
H. Miao & E. De Llano & T. Isenberg & M. E. Gröller & I. Barišić & I. Viola / DimSUM: Dimension and Scale Unifying Map

(a) d = 1.0, s = 1.5      (b) d = 1.0, s = 3.0      (c) d = 1.0, s = 7.0

Figure 6: Examples of representations in 1D, shown at different
scales and sorting by (a) strand ID, (b) GC content, and (c) length.

representations only provide a list of straightened single strands. The
strands are vertically arranged, aligned side-by-side with a distance        Figure 7: After two strands are selected in 1D, we transition along
of 20 Å. This abstract depiction is motivated by the last step of the        the orange arrow and show examples of the changing representation.
in-silico design workflow, in which the sequence of the strands are
simply depicted as linear strings as shown in Fig. 3, which allows           along the orange arrow, going from d = 1, s = 6 to d = 3, s = 2.3,
scientists to analyze their individual properties as well as the overall     and depict some of the interpolated representations. This example
list of strands needed for synthesis and extraction in order to build        demonstrates how we transition from an abstract to a concrete repre-
the structure in vitro.                                                      sentation of the same structure, allowing the scientists to visually
                                                                             connect the involved parts.
   With the strands aligned straight, it also becomes possible to sort
them by certain properties, as shown in Fig. 6. A straightforward               Transitioning from 2D to 3D thus enables the viewer to under-
sorting is by length. The length of strands is of interest to our            stand how the structure folds together from the schematic display to
domain scientists as it allows them to identify strands with unusual         its 3D shape. Transition from 2D to 1D depicts how the structural
lengths, which cause high costs in the synthesis as described in             design decomposes into the single strands. Combining transitioning
Sect. 2. The advantage of the DimSUM abstraction map is that it              across dimension with transitioning across scales enables the scien-
allows the viewer to relate the sorted strands back to the 2D and 3D         tists to seamlessly move between any two points of the abstraction
representations. Furthermore, we enable the sorting of strands by            space, and to take specific paths in this space to intuitively explore
their respective content of C and G with respect to the length which         the data. The interpolation guarantees a uniform positional change of
indicates the stickiness of a single strand. Such stickiness can either      the elements. Obviously, the current interpolation of positions does
be a desired or an undesired property, depending on the purpose              not realistically depict the movement and folding of strands, which
of the staple strand and its placement in the design. The melting            would require large-scale molecular dynamics simulations. The sim-
temperature and Gibbs free energy can be computed for the binding            plified transition, however, illustrates relationships and allows the
regions of the strands as done by Miao et al. [MDLS∗ 18], using              viewer to mentally integrate between any representations.
the thermodynamical model proposed by SantaLucia et al. [SH04].
These two properties can also be used for sorting, roughly indicating        4.3. Cross-Dimension and Scale Highlighting
the stability of the strands based on their secondary structure. Sorting
                                                                             In order to boost the coherent connection between the different
the strands by the accumulated stability thus enables the user to
                                                                             dimensions and scales, we enable the user to highlight structures at
quickly spot the strands that could compromise the self-assembly,
                                                                             any location in the abstraction map. The viewer can either manually
as they pose the weakest link in the chain.
                                                                             select the elements or automatically highlight certain features and
                                                                             then observe how they transition into other representations.
4.2. Seamless Transitions Across Dimensions and Scales
                                                                                Manual Highlighting. We allow the viewer to mark elements of
To effectively work with the representations, the scientists have to         interest (atoms, nucleotides, single strands, double strands) at any
mentally link the representations. To externalize this mental link-          position in the abstraction map, which we highlight (e. g., in yellow).
ing, we support control the abstraction and representation process           We then color context elements with a visually less salient color
through seamless transitions. We co-register the data and linearly           (e. g., in gray) to increase the focus on the highlighted elements.
interpolate the positions of elements to guarantee a uniform change          Fig. 7 shows how two strands are selected at d = 1, s = 6 in the
between two adjacent representations. In addition, we combine the            abstraction map and how they are depicted in other locations in the
position-based transformation with the interpolation of shape and            map as the user transitions along the marked path. The transitions
color across the scales. There is no rotational or scaling component         allow the user to observe where the particular strands end up in the
in the interpolated transformation.                                          2D schematics and the 3D structure. The figure also illustrates the
                                                                             transition across scales. In the detailed atomic view, the atoms that
   Fig. 1 demonstrates the general transition from 3D via 2D to 1D
                                                                             are part of the strands are highlighted as well.
and from Scale 7 to 1 at the same time, including the intermedi-
ate interpolated structures. In Fig. 7 we show a specific transition            Automated Highlighting. Interesting features that appear re-

                                                                                                                                                  © 2018 The Author(s)
                                                                                 Computer Graphics Forum © 2018 The Eurographics Association and John Wiley & Sons Ltd.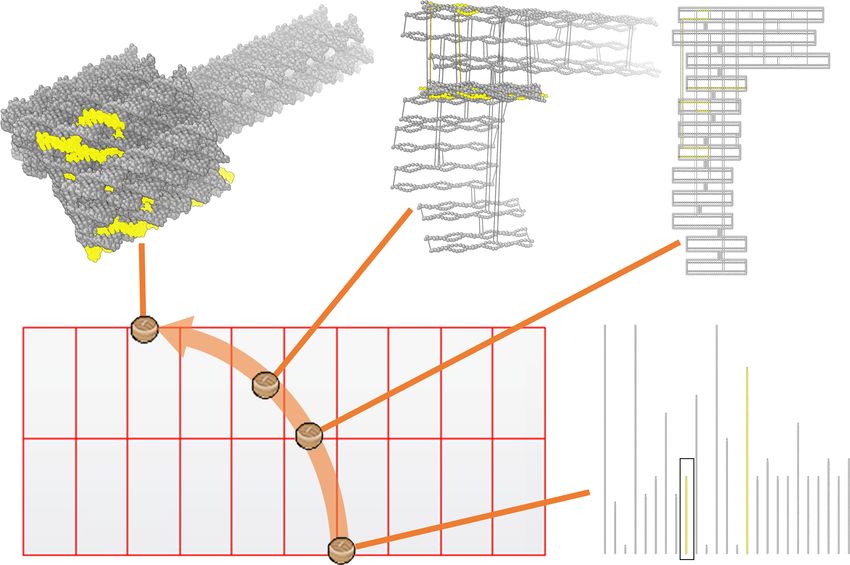
H. Miao & E. De Llano & T. Isenberg & M. E. Gröller & I. Barišić & I. Viola / DimSUM: Dimension and Scale Unifying Map

Figure 8: Crossovers are highlighted in green. Short segments be-
tween crossovers could have an adverse effect on the stability, which
is best observed in 1D.

                                                                                         Figure 9: The addition of a bridging strand inside the nanotube re-
peatedly in the entire structure can also be detected automatically.                     quires work in different dimensions and scales. Top row: crossovers
Crossovers, for instance, are fundamental in DNA nanotechnology                          are broken in 2D. Bottom row: after breaking, the broken strands
(Sect. 2). A relatively high number of crossovers has an adverse                         are connected with a specific sequence.
effect on the stability of the strand binding, as the segments could
have low stickiness. These crossovers can easily be observed in 3D
but visual occlusion may make it difficult to gain an overview. This
overview is instead provided by the 2D schematics which indicates
how well the double helices are held together. In 2D, however, it is
difficult to track an individual strand and to see how many crossovers
are performed. In contrast, at d = 1 in our abstraction map, indi-
vidual crossovers can be easily observed. We compute crossover
locations in the structure and then highlight (e. g., in green) the
two nucleotides that form the crossover from one double helix to a
neighboring one. An example is shown in Fig. 8. This way we do
not deemphasize the context—it is important to keep the contextual
information encoded here. The number of crossovers can be simply                         Figure 10: Deleting of undesired short strands. Left: a sort by
determined and the length of the segments between crossovers can                         length in 1D reveals the short strands. Top row: one of them is
be visually inspected. Usually, long segments tend to bind better,                       selected in 1D and deleted. The same strand is shown in 2D and 3D.
provided that the sequence is complementary. This sequence com-                          Bottom row: representations in all dimensions show that the strand
plementarity is best seen at d = 2, s = (3|4). In Fig. 8 we marked                       is removed.
the brown strand that has relatively short segments of only four nu-
cleotides between crossovers. This configuration could potentially
compromise the stability of the entire structure. The arrow points
                                                                                            In Fig. 9 we demonstrate a task where a bridging strand is added
to the pink strand, which has no crossovers and does not contribute
                                                                                         to the inner part of the nanotube. First we depict the nanotube in
to binding adjacent double helices together. The pink strand could
                                                                                         3D (d = 3, s = 7) and highlight the two crossovers that need to
thus be a good candidate for connection with another strand. These
                                                                                         be broken. Due to the visual occlusion in 3D, which we have just
features are best discovered in our abstraction map at d = 1.
                                                                                         described, we select the crossovers in 2D (d = 2, s = 5.5) and break
                                                                                         them. We then create a new connection of the nucleotides at the
4.4. Abstraction-Adaptive Modifications                                                  broken crossover location and we add a sequence of ten nucleotides
                                                                                         (TACGTAGTTT) in-between in 5’ to 3’ direction.
Structural modifications are an important part in the workflow of
the domain scientists. Deleting, breaking, connecting, and concate-                         In Fig. 10 we demonstrate the removal of a particularly short
nating are basic operations that allow them to carry out advanced                        strand that does not contribute to the stability of the structure. Ac-
modifications of a structure. We provide such structural modifica-                       cording to the domain scientists, these short strands can cause prob-
tions at any point in the abstraction map with a well-defined behavior                   lems during the self-assembly as they have a high probability to
and scope of the respective effect. While Miao et al. [MDLS∗ 18]                         bind to regions and would be in the way of the intended folding. In
proposed Scale-Adaptive Modifications, we extend these modifica-                         addition, they generate costs during the synthesis. To identify short
tions across dimensions, enabling users to modify a structure in 2D                      strands, the scientists can now sort the strand by length and quickly
and 1D layouts. A particular task can be carried out at the scale                        see that there are three staple strands of only length three. They can
where it makes most sense and the system propagates automatically                        select one strand and depict it in the other dimensions for demonstra-
the modification not only across scales but also across dimensions                       tion purposes. After removal, Fig. 10 shows that the scaffold strand
(abstraction-adaptive). Next, we demonstrate two tasks for which                         is unpaired at the respective location. However, the brown staple
this operation across dimensions is particularly useful.                                 strand can not be extended along the helical axis because crossovers

© 2018 The Author(s)
Computer Graphics Forum © 2018 The Eurographics Association and John Wiley & Sons Ltd.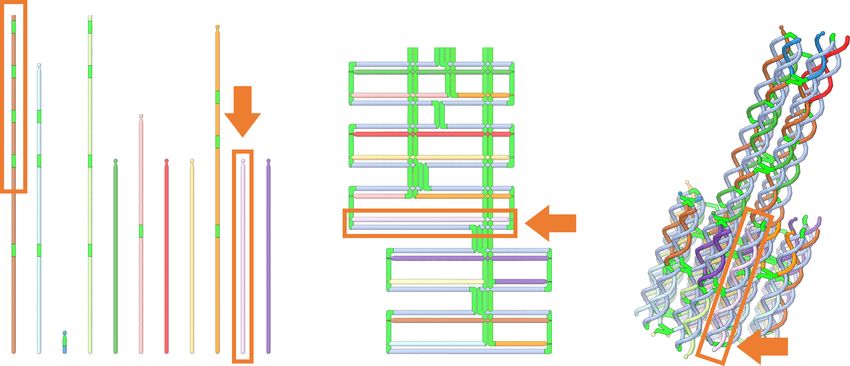
H. Miao & E. De Llano & T. Isenberg & M. E. Gröller & I. Barišić & I. Viola / DimSUM: Dimension and Scale Unifying Map

                                                                             6. Realization / Implementation
                                                                             Our system has to effectively integrate all the data required for
                                                                             the visualization in the various dimensions and scales. We employ
                                                                             a model that hierarchically represents the strands, the base pairs,
                                                                             the nucleotides, and atomic details, which we describe next. We
(a) Frequently visited places on the   (b) Snapping to the discrete dimen-   initialize this model with the original caDNAno 2D diagrams, from
abstraction map. We marked the         sion and scale or current location.   which we derive all the information, such as 2D and 3D positions.
places that were used to create the    The thumbnails show the explicit
figures in this work.                  viewpoints defined by the user.
                                                                                CaDNAno diagrams are based on a lattice, which covers a plane.
                                                                             As design principle it is assumed that the helical axis of all ds-
Figure 11: We augment the DimSUM with additional informa-                    DNA are perpendicular to this plane. On the lattice the positions
tion. The heatmap depicts the accumulated time a user spent                  of the virtual helices are defined. Double strands can be formed
at a particular point. The time in milliseconds is mapped to a               by conducting the scaffold strand through them. In the caDNAno
heatmap with colors                       representing the intervals         file format it is specified which virtual helices are in fact used in
[0; 1000), [1000, 2000), [2000, 3000), [3000, 4000), [4000, +∞).             the design by indicating their rows and columns in the lattice. The
                                                                             positions occupied by scaffold nucleotides and/or staple nucleotides
                                                                             within every virtual helix and the routing of every strand across the
cannot be formed at locations where the helical twists move away             virtual helices is also specified. The used lattice and the sequence of
from each other. This can be seen in our 3D representations.                 the scaffold must be provided by the user as it is not contained in the
                                                                             data. For the datasets in this paper we take the standard m13mp18
                                                                             bacteriophage DNA as scaffold sequence as this is used by our do-
5. Interaction and Navigation in the Abstraction Map
                                                                             main scientists. However, any other sequence in the FASTA-format
As we provide a large set of representations, we developed a two-            can be input into our system.
dimensional widget that allows the user to easily change represen-
                                                                                The 3D, 2D, and 1D layouts depend on the positions of nu-
tation by moving an icon on the abstraction map. Our abstraction
                                                                             cleotides. Each nucleotide defines a position in each dimension.
map not only serves as a concept to organize the transitions across
                                                                             From caDNAno we derive the 2D conformations. We then deter-
semantic scales and dimension, but we use it directly as a naviga-
                                                                             mine the corresponding 3D positions using the 2D conformation and
tion widget to access the abstraction space—in a similar way as
                                                                             the lattice information. We can, finally, compute the corresponding
done previously by Mohammed et al. [MAAB∗ 18]. In contrast to
                                                                             1D locations from a side-by-side placement of single strands. We use
their approach for connectomics, our abstraction map is completely
                                                                             the sorting criteria described in Sect. 4 as the different ssDNA are
continuous, despite the transitions between spatial 3D representa-
                                                                             now completely described according to our model. In all dimensions
tions and abstract 2D and 1D depictions. In addition, we augment
                                                                             we make use of the geometric properties of a typical double helix to
the DimSUM abstraction map with a heatmap to mark interesting,
                                                                             achieve models as realistic as possible. Furthermore, to generate an
frequently visited locations, which indicate particularly relevant
                                                                             all-atom 3D model we use idealized base pairs [LO03]. We generate
representations for a given dataset or task. In a collaborative setting,
                                                                             additional scales by aggregating data and, for the transition along
such highlighting allows team members to understand each others in-
                                                                             the scale-axis, we linearly interpolate colors, shape parameters, and
terest when working on the same dataset. The heatmap also provides
                                                                             positions from one discrete scale to the next, both as described by
individual users with a way to track their own interaction and data
                                                                             Miao et al. [MDLS∗ 18]. For the transition along the dimension-axis,
exploration patterns. Finally, it allows the scientists to understand
                                                                             we interpolate positions. By combining both interpolations we gen-
which parts of the abstraction space they have not yet investigated
                                                                             erate a morphing-like transformation between any two points in the
in detail, to look for potentially interesting representations.
                                                                             abstraction map.
   The heatmap in Fig. 11a, for example, depicts the places that we
                                                                                We implementated our system using the SAMSON frame-
visited to create the figures in this paper, highlighting the distinct
                                                                             work [NAN16], a platform for fast prototyping in computational
abstractions that we used. It shows that we not only visited the
                                                                             nanoscience. We used its capability of rendering geometric primi-
discrete dimensions and scales but also the space in-between. For
                                                                             tives such as spheres and cylinders for depicting the primitives in
the teaser in Fig. 1, for instance, the transition is clearly marked,
                                                                             our visualizations. We implemented the user interface using the Qt
indicating the frequent use of this space.
                                                                             framework [The17]. For calculating the melting temperature and
   We also support the navigation in the abstraction map by allowing         Gibbs free energy, we used the ntthal package from the Primer3
users to snap the cursor to either a discrete dimension (with the d-         software [WRU∗ 16, UCK∗ 12]. We tested our system on a laptop
key) or a discrete scale (s-key) if the cursor lies within a radius of       with an Intel Core i7 CPU and an Nvidia GTX 1060 GPU. For the
0.25 units. Alternatively, users can snap the curser to its current          datasets shown in this work, we achieve 20 fps or more.
non-integer location (g-key). The display of dotted vertical and
horizontal lines (Fig. 11b) further assists this interaction. Finally,
                                                                             7. Results and Discussion
we allow users to explicitly mark locations by placing view points
in the abstraction map, enabling them to come back to this location          Because we realized our work in close collaboration with domain
at a later point in time. As shown in Fig. 11b, we add thumbnails to         experts (Sect. 4), we could directly derive their requirements by
visually mark such locations.                                                observing their workflow. The case studies, which we describe next,

                                                                                                                                                  © 2018 The Author(s)
                                                                                 Computer Graphics Forum © 2018 The Eurographics Association and John Wiley & Sons Ltd.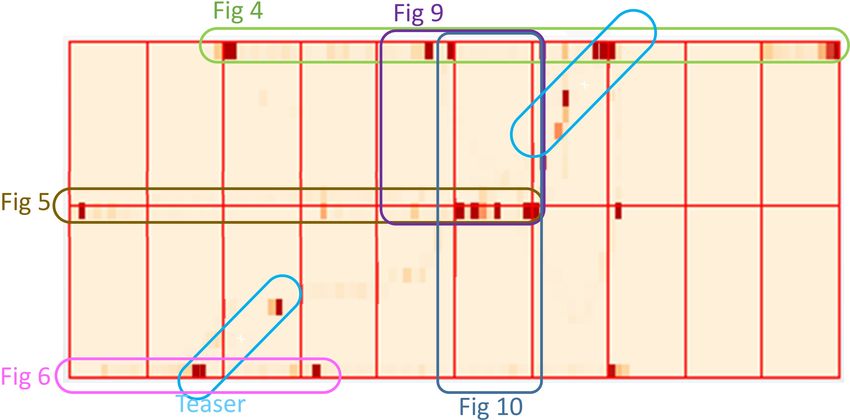
H. Miao & E. De Llano & T. Isenberg & M. E. Gröller & I. Barišić & I. Viola / DimSUM: Dimension and Scale Unifying Map

                                                                                         use our system before. We first gave her an introduction into the
                                                                                         user interactions and explained the visualization concepts. Then she
                                                                                         used our system to explore the data and become familiar with it.
                                                                                         We logged her interactions during task executing on the DimSUM
                                                                                         abstraction map, and we show the resulting heatmap in Fig. 12d. As
                                                                                         it is apparent in the figure, the 3D representations at the higher scales
                                                                                         were the most interesting ones for identifying the surface strands.
                                                                                         According to the expert, she was able to have a straightforward view
                                                                                         of the spatial model in 3D and to relate it back to the familiar 2D
                                                                                         view. She stated that one big advantage of our approach is that she
                                                                                         could get an overview of all possible strand endings and quickly
(a) Nanocage. A staple needs to be elongated towards the target in the center.           identify those on the inside of the cage. She quickly found two
                                                                                         candidates, which we highlight in Fig. 12a. We give a zoomed-in
                                                                                         image in Fig. 12b, which shows that these endings are located on
                                                                                         the bottom of the lower double helices. She realized that, although
                                                                                         both strands end at the bottom, only the left yellow strand turns
(b) Two candidates for        (c) The same strands are       (d) The logged abstrac-     towards the target in the center of the cage, whereas the right orange
elongation. On the left,      depicted in 2D, which          tion map depicts which      one turns away and is, hence, not an ideal candidate for elongation.
the helical twist turns to-   does not provide means         locations expert C4 vis-
                                                                                         According to C4, this precise analysis in the planning stage enables
wards the targeted cen-       to estimate the helical        ited in order to ana-
ter. On the right, the        twists and positions of        lyze the structure and to
                                                                                         her to conduct a time-efficient and accurate in silico design and thus
strand turns away.            strands.                       carry out this task.        reduces the probability of introducing errors that compromise the
                                                                                         successful assembly of the nanostructure in the wet lab later. Finally,
Figure 12: Demonstration of the detection of specific surface strand.                    she transitioned to the 2D representation as shown in Fig. 12c, in
                                                                                         order to compare the 2D depictions, which she is familiar with.
                                                                                            This case demonstrates how our approach can assist the domain
are the result of focus group discussions as well as of feedback
                                                                                         scientists in tasks that require a good understanding of both the
we received during the regular progress reports to the team. We
                                                                                         schematic design and the resulting spatial layout. This makes the
further developed the case studies in two final sessions in which
                                                                                         workflow in such cases much simpler. We also learned that navigat-
we provided the domain scientists with our system, observed their
                                                                                         ing through the 3D scene can pose a challenge to some users such
interaction, and logged their behavior in the DimSUM abstraction
                                                                                         as C4, as they might need prolonged time to familiarize with 3D
map. The results demonstrate the effectiveness and efficiency of our
                                                                                         navigation. Later we discussed this case with C2 and he suggested
approach. Furthermore, the experts could gain insights about their
                                                                                         to automatically detect the surface endings in the future and then to
work that were not possible before, in particular with respect to the
                                                                                         highlight them in our visualization. According to C2, however, our
missing connection between 3D and 2D representation.
                                                                                         system allowed the scientists to perform the manual identification
                                                                                         very well in comparison with existing tools, where the detection of
7.1. Surface Strand Analysis                                                             these surface strands is a tedious task.
A main challenge in the design of nanostructures is that scientists
need to rely on realistic estimations of distances and location of the                   7.2. Parametrized Generation of Structural Motifs
structural elements. Fig. 12 depicts a cage that we use to demonstrate
                                                                                         One domain scientist (C3) has been using our system intensively
the case. Here, a common task is to identify the strand endings
                                                                                         throughout the development and has embedded it into her workflow,
that are on the inside of the cage. These endings are candidates for
                                                                                         starting at an early point in time. She specializes on the compu-
elongation. Such identification tasks are challenging when designing
                                                                                         tational design of DNA nanostructures and her goal is to develop
and modifying DNA nanostructures. With the existing tools such as
                                                                                         methods for the parametrized generation of structural motifs and
caDNAno it is difficult to determine the strand endings according to
                                                                                         the computational design of functional nanostructures. The reliance
expert C2: Not only their locations but also their directions of the
                                                                                         on visualization and the exploratory nature of her work, however,
helical turn have to be carefully considered.
                                                                                         requires her to analyze her results with different methods. She pro-
   Therefore, expert C2 suggested to carry out this task in our system.                  vided regular input and was therefore actively involved in the con-
We asked expert C4, who is very experienced with the traditional                         ceptual development of this work.
tool, to find the surface strands and provide us with feedback. She in-
                                                                                            In a final interview we asked her again to explain how the system
vestigated the DNA origami cage with dimensions of 200 Å × 200 Å
                                                                                         supports her and logged her interaction with our system on her own
a dataset with which she was not familiar before. It contains 56 sta-
                                                                                         machine. She loaded the robot/man dataset, used in the work of Cas-
ple strands and one scaffold strand with 2 197 nucleotides, aligned in
                                                                                         tro et al. [CKK∗ 11], to demonstrate how our new approach helped in
a honeycomb lattice. Her goal was to identify those strand endings
                                                                                         her tasks. As shown in Fig. 13a, she first selected the shoulder of the
that could potentially be elongated to create a connection towards a
                                                                                         man and then transitioned from 3D to 2D to observe where this part
target in the center of the cage, as illustrated in Fig. 12a.
                                                                                         of the structure is located in the 2D diagram. She stated that the 3D
   While she was familiar with our project, she did not actively                         spatial model is necessary for her to understand the 2D schematics,

© 2018 The Author(s)
Computer Graphics Forum © 2018 The Eurographics Association and John Wiley & Sons Ltd.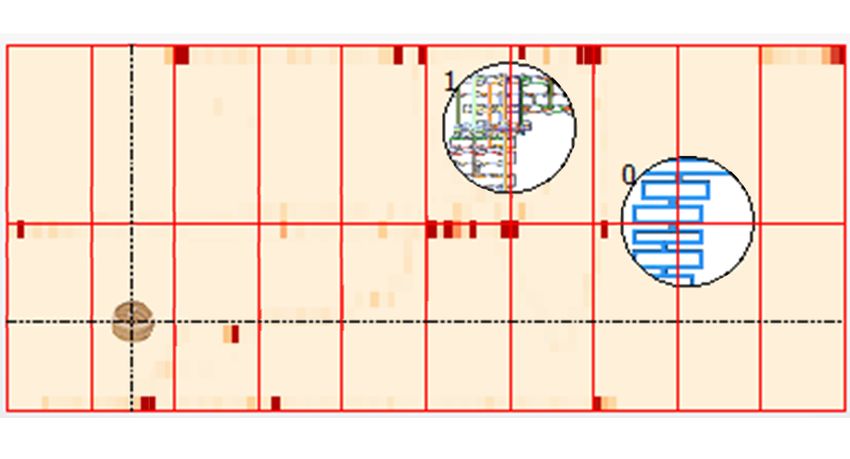
H. Miao & E. De Llano & T. Isenberg & M. E. Gröller & I. Barišić & I. Viola / DimSUM: Dimension and Scale Unifying Map

                                                                             have been visited during the interaction will then form the simplified
                                                                             visual interface. A MCV could be advantageous if it allows the user
                                                                             to immediately understand the implications of a modification in
                                                                             views other than the one he or she is currently operating with.

                     (a) Transition from 3D to 2D.                              Our DimSUM approach can potentially be generalized to data
                                                                             based on linear structures. The key idea is to share the complexity
                                                                             of data among several layouts and scales, each representation high-
                                                                             lighting a certain aspect of the data. As noted in Sect. 3, abstractions
                                                                             of linear structures are important, e. g., in cartography. Here, line
       (b) s = 8               (c) s = 9             (d) Abstraction map.    representation of streets are continuously generalized depending
                                                                             on the distance to the viewer. Blood vessels also share traits with
 Figure 13: Using transition to mentally link between 3D to 2D.              DNA w.r.t. their different semantic representations (volume, sur-
                                                                             face, centerlines, etc.) and are typically abstracted to 2D depictions.
                                                                             Another example are fibrous structures in material sciences, where
which is sometimes challenging due to the loss of spatial context.           defective fibers could be singled out easily in a 1D arrangement. For
According to her, this problem is solved because she can now relate          the future, it could be of great interest to explore the possibility of
between these two representations in DimSUM. In the heatmap of               localized glimpses into other dimensions and scales while keeping
the logged session (Fig. 13d) we can observe the corresponding fre-          the context—similar to the magic lens [BSP∗ 93] metaphor.
quent transitions. As she is already experienced with our system, she           Furthermore, we showed how our visualization concept of inter-
could quickly navigate to the appropriate representation using the           active abstraction is helpful to the domain of DNA nanotechnology.
proposed interaction techniques. Her feedback regarding transitions          We provide domain scientists with a proof-of-concept implemen-
between dimensions focused on the development of new algorithms              tation that is already in the daily workflow of some experts, (e. g.,
for DNA origami design. The visualization of these transitions made          C3). One of the limitations of our approach is that we currently
easier for her to understand the DNA origami method in general.              are only implementing model modifications. We do not yet provide
She also noted that it can greatly reduce the amount of time spent           from-scratch modeling of new designs. Another drawback is that we
on debugging DNA nanostructure designs.                                      are not using the positional data available from simulations. DNA
   Overall, she described that the ability of visualizing the same           origami structures could exhibit twists and bends in their shape
structure in many dimensional and semantic representations and               model, for example. We want to incorporate these structural predic-
having the ability to relate between these representations helped            tions in the future to provide better approximations. A more general
her to visually examine the results to validate the correctness of the       limitation is that large datasets are increasingly difficult to inspect:
computational methods she developed. She stated that, for exam-              elements can become too small for an effective work if viewed from
ple, a faulty in silico design will produce incorrect foldings in the        far away. This scalability issue is not necessarily a drawback specific
laboratory. Using our system and being able to visually examine              to our approach, but of DNA diagrams in general. Furthermore,
the in silico design in the proposed manner, she could find errors in        users have remarked that the transitions from 2D to 1D are not
the computational methods. She stated that this saves costs and also         easy to follow when working with larger datasets. Nonetheless, this
time spent for assembling potentially erroneous structures.                  concern could be addressed in future work that looks at the design
                                                                             approaches in DNA origami in general to provide a scalable and
                                                                             efficient workflow. Our next research opportunity is to extend the
8. Conclusion and Future Work                                                presented work to general DNA nanostructures, including, but not
                                                                             limited to, wireframe structures [VRZ∗ 16, BMG∗ 15], which exhibit
In this paper, we discuss the application of visual abstraction to DNA
                                                                             a great potential for applications under physiological conditions. In
nanotechnology. DimSUM, our two-axes abstraction space goes
                                                                             the near future, the implementation of our approach will be released
beyond the work of Mohammed et al. [MAAB∗ 18], which actually
                                                                             as part of a open-source software toolkit.
encodes geometry and dimensionality on a single axis. We advance
the concept of abstraction by demonstrating that dimensionality is an
important axis, where different layouts provide specific advantages          Acknowledgments
in analyzing and modifying complex data.
                                                                             This project has received funding from the European Union’s Hori-
   Because we integrated the visual abstractions into an interactive         zon 2020 research and innovation programme under grant agree-
widget we facilitate seamless transitions. This possibility to men-          ment No 686647. This work was also partially funded under the
tally integrate all representations in our abstraction space, allows         ILLUSTRARE grant by FWF (I 2953-N31), ANR (ANR-16-CE91-
domain scientists to include our visualization concept into their            0011-01), and the WWTF (VRG11-010). This paper was partly
workflow, and to improve it. Another contribution includes the use           written in collaboration with the VRVis Competence Center. VRVis
of the DimSUM abstraction map as interaction widget. Traces of               is funded by BMVIT, BMWFW, Styria, SFG and Vienna Business
user interaction can be taken to optimize visualization settings for         Agency in the scope of COMET - Competence Centers for Excel-
particularly focused tasks that do not use the entire visual abstraction     lent Technologies (854174) which is managed by FFG. We thank
space. We could also apply user traces in a systematic design of             Yasaman Ahmadi and Tadija Kekic for providing valuable input to
custom MCV systems. Only a task-dependent subset of views that               this work and also David Kouril who created the submission video.

                                                                                                                                                  © 2018 The Author(s)
                                                                                 Computer Graphics Forum © 2018 The Eurographics Association and John Wiley & Sons Ltd.
You can also read