Polarimetric Radar Observations of the Persistently Asymmetric Structure of Tropical Cyclone Ingrid
←
→
Page content transcription
If your browser does not render page correctly, please read the page content below
616                                        MONTHLY WEATHER REVIEW                                                            VOLUME 136

         Polarimetric Radar Observations of the Persistently Asymmetric Structure
                               of Tropical Cyclone Ingrid
                                  PETER T. MAY, J. D. KEPERT,             AND   T. D. KEENAN
                                  Bureau of Meteorology Research Centre, Melbourne, Australia

                                (Manuscript received 3 November 2006, in final form 3 May 2007)

                                                            ABSTRACT

               Tropical Cyclone Ingrid had a distinctly asymmetric reflectivity structure with an offshore maximum as
            it passed parallel to and over an extended coastline near a polarimetric weather radar located near Darwin,
            northern Australia. For the first time in a tropical cyclone, polarimetric weather radar microphysical
            analyses are used to identify extensive graupel and rain–hail mixtures in the eyewall. The overall micro-
            physical structure was similar to that seen in some other asymmetric storms that have been sampled by
            research aircraft. Both environmental shear and the land–sea interface contributed significantly to the
            asymmetry, but their relative contributions were not determined. The storm also underwent very rapid
            changes in tangential wind speed as it moved over a narrow region of open ocean between a peninsula and
            the Tiwi Islands. The time scale for changes of 10 m s⫺1 was of the order of 1 h. There were also two distinct
            types of rainbands observed—large-scale principal bands with embedded deep convection and small-scale
            bands located within 50 km of the eyewall with shallow convective cells.

1. Introduction                                                     larimetric radar (Keenan et al. 1998). Ingrid was a long-
                                                                    lived storm that reached Australian category 5 intensity
   The structure and intensity of tropical cyclones (TCs)
                                                                    twice—initially before it crossed the North Queensland
around landfall are a major topic of research because of
                                                                    coast, and then again as it reintensified over the Gulf of
the potential impact on human populations and prop-
                                                                    Carpentaria, where the eye structure was quite sym-
erty. The dynamics of the storms are complicated be-
                                                                    metric. On the Australian scale, category 3 is defined
cause of the proximity of the coastline and the corre-
                                                                    by gusts ⬎170 km h⫺1, category 4 by gusts ⬎225 km
sponding variations in surface fluxes and friction. This
                                                                    h⫺1, and category 5 by gusts ⬎280 km h⫺1. This is dif-
often leads to distinct asymmetries in the storm rainfall
                                                                    ferent from the Saffir–Simpson scale used in the United
structure (e.g., Chan et al. 2004). In addition to the high
                                                                    States (details are available online at http://
winds, intense rainfall can be a major factor in storm
                                                                    www.nt.bom.gov.au/ntregion/sevwx/cyclones/tccat.
damage. Polarimetric weather radars offer the possibil-
                                                                    html). Ingrid then moved along the north coast of Aus-
ity of much more accurate measurements of rainfall
                                                                    tralia along the monsoon trough axis where it lost some
compared with conventional radar and of obtaining the
                                                                    intensity, but remained a severe tropical cyclone (Fig.
precipitation microphysical structure of storms nearing
                                                                    1). This included the period of the most interest herein,
landfall, which are key issues relating to the impact of
                                                                    while it moved near the polarimetric radar facility
tropical storms. Polarimetric capabilities are a key com-
                                                                    (0200–2000 UTC 13 March 2005). Following the pas-
ponent of the planned upgrade of the U.S. weather
                                                                    sage past the Darwin area it moved into the Timor Sea,
radar network. There are several research radars with
                                                                    where it again reintensified before recurving and mak-
this capability, but there have not been TC observa-
                                                                    ing its final landfall.
tions using the published polarimetric radar.
                                                                       While this storm did not cross the coast near Darwin,
   In March 2005, an intense tropical cyclone, TC In-
                                                                    it did propagate along an extended section of east–
grid, moved within 100 km of the Darwin research po-
                                                                    west-oriented coastline, with the circulation center very
                                                                    close to the coastline. As will be shown, this resulted in
  Corresponding author address: Dr. Peter May, BMRC, GPO
                                                                    some remarkable asymmetries in the storm structure.
Box 1289, Melbourne, 3001 Victoria, Australia.                      The best-track estimates of the central pressure when it
E-mail: p.may@bom.gov.au                                            was in radar range had the storm filling from 950 to 970

DOI: 10.1175/2007MWR2077.1

© 2008 American Meteorological Society

 MWR3552
FEBRUARY 2008 MAY ET AL. 617
FIG. 1. The official best track for TC Ingrid. Note that it was a long-lived storm with several cycles of intensification depending on
land influences. The date and pressure tags are at 0000 UTC, and additional pressure estimates at 1200 UTC are shown. This paper
focuses on the period from 0200 UTC 13 Mar to 2000 UTC 13 Mar 2005.
hPa, with 965 hPa being measured at Cape Don (maximum range used in this study) is approximately 0
(11.31°S, 131.77°E), and an analyzed intensity dropping dBZ. The velocity data used in these analyses were
from that of a category 4 to a category 3 storm. The from the raw radar data after extensive manual velocity
Doppler wind speeds estimated near the eyewall at low dealiasing.
elevations (but still about 1.8 km above the ground) at Detailed descriptions of the enhanced capabilities as-
the time of the closest approach to the radar were as sociated with such systems can be found in Zrnić and
high as ⬃55 m s⫺1, consistent with the category 3 rating, Ryzhkov (1999), but the germane issue here is their
but there were significant high-frequency variations in capability for much greater accuracy of rainfall esti-
the storm intensity that can be related to the surface mates compared with conventional radar and the ability
properties beneath the eye. This paper will describe the to estimate the microphysical characteristics of the pre-
rainfall and microphysical structure of the storm as it cipitation. Polarimetric radars offer several advantages
moved past the radar at a speed of about 3.5 m s⫺1. over standard reflectivity-based rainfall radar esti-
Thus, the observations here present a case study of mates. The polarimetric radar measures several vari-
asymmetric tropical cyclone structure associated with a ables in addition to the reflectivity at horizontal polar-
relatively simple land–sea interface as well as a dem- ization (ZH). In particular, the difference in reflectivity
onstration of the utility of polarimetric radars for tropi- at the two polarizations (ZDR ⫽ ZH /ZV) provides in-
cal cyclone research. formation on the mean raindrop size that is at the core
of rainfall measurement uncertainties, while the differ-
2. Polarimetric radar ential phase on propagation (⌽DP) provides a measure
of the attenuation of the signals. The radial gradient of
A polarimetric weather radar differs from conven- ⌽DP, the specific differential phase KDP, provides an
tional Doppler radar by its ability to transmit and re- attenuation-free estimate of the rainfall rate that is par-
ceive on different polarizations. In the case of the 5.5- ticularly useful in high-rain-rate situations or when
cm-wavelength Darwin C-band dual-polarization mixed-phase precipitation is present. The final param-
Doppler (C-Pol) radar, alternate pulses of horizontally eter measured by the C-Pol radar is the cross correla-
and vertically polarized radiation are transmitted and tion of the signal at the two polarizations [HV(0)] that
received (Keenan et al. 1998). The radar is located at enables the detection of mixtures of precipitation type.
Gunn Point (12.25°S, 131.04°E), approximately 25 km These capabilities have been discussed at length in
northeast of Darwin and about 100 km south of the many papers (e.g., Bringi et al. 2002; Zrnić and Ryz-
closest approach of Ingrid’s center. The radar has a khov 1999; May et al. 1999).
beamwidth of 1°, giving it an angular resolution of The rain field has been estimated using a combina-
about 2 km at a range of 100 km. The range resolution tion of polarimetric estimators that are dominated by
of the data used here is 300 m and the data are inter- reflectivity at low rain rates, and that use the differen-
polated onto a Cartesian grid with a spacing of 2.5 km tial reflectivity and reflectivity at moderate rates and
in the horizontal and 1 km in the vertical for the clas- the KDP at high rain rates. The particular algorithms are
sification data and 1 km in the horizontal for the rainfall described in Bringi et al. (2001, 2004). Much of the area
estimates. The minimum detectable signal at 150 km of interest is at a fairly long range, so that the beam-618 MONTHLY WEATHER REVIEW VOLUME 136 width is ⬃2 km. This may lead to some beam-filling issues, but the features of interest here are of a large enough scale and the freezing level is high enough (⬃5 km) that this does not appear to be a significant issue. Cell movement combined with the radar 10-min sam- pling can also produce unrealistic gaps in the spatial pattern of the rainfall, which is essentially a strobe ef- fect, but the storm movement is slow enough and the rainfall features are large enough that the accumula- tions here do not show this problem. Comparisons be- tween the rain gauges in the region with the 24-h radar estimates of storm accumulations show excellent agree- ment (Fig. 2), with a correlation of 0.86. On average the gauges are slightly higher, with a mean gauge-to-radar ratio of 1.3. The two high accumulations (⬎90 mm) were both from gauges that were near the eyewall pas- sage and experienced strong winds, while most of the FIG. 2. A scattergram of the operational rain gauge measure- other gauges were more than 100 km from the circula- ments within the radar-sampling volume against the polarimetric tion center and sampled bands. Many of these gauges rainfall accumulation estimate. The diagonal line is perfect agree- were in areas with very high rainfall gradients. The ment. strong winds tend to bias gauge measurements down, indicating that the radar may be underestimating the rain, but overall these comparisons give confidence in well as the statistical uncertainties in the ⌽DP measure- the radar estimates of rain totals. This is particularly the ment itself. More precise estimates of the attenuation case given the substantial spatial gradients in the accu- are difficult because of the quality control impacts of mulated rainfall. the wide spectral widths discussed earlier. It is impor- The substantial tangential winds in the eyewall did tant to make these corrections to minimize bias in rain- produce some quality control problems, because the fall estimates, particularly for a 5-cm-wavelength radar, spectral width of the signals was greater than about 2.5 because there was significant attenuation observed m s⫺1; that is, about a quarter of the Nyquist velocity. through the eyewall, in particular. The ability to use the This significantly impacts the accuracy of the phase ⌽DP is a significant advantage of polarimetric radars measurements that are part of the velocity and differ- over simple Doppler radars. ential phase measurements, leading to some uncertain- Another useful application of the polarimetric data is ties in the KDP and attenuation corrections. Note that to estimate the hydrometeor type. Different species of this would be less of an issue with 10-cm-wavelength hydrometeors occupy various ranges of the multipa- radars because they have twice the Nyquist velocity, rameter phase space, so combinations of measurements although the fractional error for the KDP estimates is can be used to separate different types of precipitation, larger for 10-cm radars because KDP scales as the in- as well as nonmeteorological echoes (Schuur et al. verse of the wavelength. Where the quality control de- 2003) and the presence of hail, in particular (e.g., May leted polarimetric-based estimates, the rainfall estimate et al. 2001). However, there is considerable overlap in was replaced by an attenuation-corrected reflectivity- these parameter ranges, so a fuzzy-logic approach is based estimate. used to perform the microphysical classification Attenuation of the radar signals can also be signifi- (Keenan 2003) similar to the approach of Straka et al. cant for 5-cm-wavelength radars. Attenuation up to (2000). These retrievals have found good validation in about 5 dBZ was seen behind the intense northern side thunderstorm data (May and Keenan 2005). It should of the eyewall for the period of around 0630–0800 be noted that the large velocities caused considerable UTC. As discussed by May et al. (1999) and Carey et al. aliasing and also appeared to impact some of the data (2000), the ⌽DP is approximately proportional to the quality in the eyewall region, probably because of the water path, and therefore attenuation. Thus, a simple large spectral widths as noted above. However, the re- methodology for attenuation estimates is the loss in sults presented here show spatial and temporal consis- dBZ ⫽ 0.02 ⌽DP. The uncertainties therein are associ- tency. In particular, it is possible to discriminate be- ated with the dependence of the coefficient (0.02) on tween rain, rain–hail mixtures, wet and dry graupel, and drop size distributions and the linear approximation, as snow. These retrievals appear to be robust down to the
FEBRUARY 2008                                       MAY ET AL.                                                        619

                     FIG. 3. A geostationary satellite IR image of TC Ingrid at 0700 UTC 13 Mar 2005.

minimum detectable signal levels, for example, showing        the islands and is reflected in the total rainfall estimated
snow in anvil cloud (e.g., May and Keenan 2005).              from the polarimetric data (Fig. 5). The time for a cell
                                                              to be advected around the entire eye is ⬃1 h, so the
                                                              relatively steady state of the convective asymmetry is
3. Core structure                                             noteworthy. This resulted in a very asymmetric rainfall
   As shown in Fig. 1, TC Ingrid passed along the north       distribution, with totals of more than 500 mm offshore
coast of Australia and was decreasing in intensity as it      and much less, but there are still significant totals on the
passed the Tiwi Islands. This extended path along the         islands and mainland associated with rainbands and the
coast can be compared with a storm making landfall for        southern part of the eyewall. Comparisons with gauge
a period of over 12 h, and as such it can offer useful        data on the coastal region and Cape Don show good
insight into cyclone structures undergoing landfall. An       agreement (Fig. 2), although it should be remembered
IR satellite image at 0700 UTC 13 March (Fig. 3) shows        that gauge estimates tend to underestimate rainfall in
continuous cloud coverage with no clear eye. This is          high wind speeds. Similar asymmetries have been ob-
consistent with decreasing intensity and, as we will          served in several storms close to land (e.g., Blackwell
show, the reflectivity structure of the eye itself. The       2000; Geerts et al. 2000).
cold IR temperatures are concentrated on the north               The period around 0730 UTC corresponds to a maxi-
and east sides of the eye circulation, along with some        mum in the convective intensity as defined by both the
cold cloud tops associated with parts of the rainbands.       maximum reflectivities in the eyewall and the maxi-
We will see that this is consistent with the radar struc-     mum height that reflectivities greater than 35 dBZ
ture as well as a Tropical Rainfall Measuring Mission         reach (Fig. 6). A part of the weakness before 0400 UTC
(TRMM) overpass (not shown, but available online at           and after about 1700 UTC is associated with the eye
http://trmm.gsfc.nasa.gov/publications_dir/ingrid_11-         leaving the radar-sampling domain. However, there is a
15mar05.html).                                                clear maximum in convective intensity around 0730
   A radar scan at 0730 UTC (Fig. 4) shows the very           UTC that had implications for the microphysics of the
asymmetric reflectivity structure about the storm center      eyewall, as will be discussed later. After about 0900
with the maximum reflectivity on the north (offshore)         UTC the convective intensity decreased and this corre-
side consistent with the satellite imagery. This asymme-      sponded to a weakening in the wind speeds. Around
try persisted for the entire storm passage (⬎12 h) past       1400 UTC there was a subsequent intensification and
620 MONTHLY WEATHER REVIEW VOLUME 136
FIG. 4. Radar reflectivity at an elevation angle of 0.5° at 0730 UTC 13 Mar 2005. The cross
section of velocity and reflectivity through the eye (solid line) and the cross section of reflec-
tivity and microphysical classification (dashed line) are shown. The storm center is at approxi-
mately (25 km, 100 km). Note the asymmetries of the eyewall and the presence of several
rainbands.
FIG. 5. The 24-h rainfall accumulations begin at 0000 UTC 13 Mar 2005, along with the
storm best track and time of each fix. Note the impact of the storm asymmetry on the rainfall
pattern.FEBRUARY 2008 MAY ET AL. 621 FIG. 6. (top) A time–height cross section of max reflectivity in the eyewall as a function of height. Contours are drawn every 10 dBZ from 15 dBZ with a heavy contour drawn at 35 dBZ. The temperature heights were taken from the 1100 UTC Darwin sounding, and thus may be biased somewhat low when compared with the eye. (middle) The area greater than 45 dBZ around the eye (solid line) and the time sequence of the maximum reflectivity in the eyewall at 3-km altitude (dashed line). (bottom) The maximum Doppler velocity in the eyewall on the left-hand (west, solid line) and right-hand (east, dashed line) sides. the highest echo tops, as the circulation was again mov- satellite brightness temperatures below ⫺90°C. The ing offshore and the storm was beginning to reintensify. coldest cloud-top temperatures were to the north, con- The radar cross sections at 0730 UTC through the sistent with the radar data. The IR image also displays eyewall (Fig. 7) show that the intense side is always some cyclonic curvature of the cold cloud-top tempera- characterized by echo tops in the vicinity of 18–20 km, tures around to the eastern side of the storm. This is not that is, the convection on the north side of the eye is necessarily inconsistent with the radar data, which show reaching to the tropopause and overshooting while the substantially less rotation, because it may be explained reflectivity structure on the south side is not only much by the radar reflectivity being dominated by large ice shallower, but seems to be feeding into the outflow crystals that fall out relatively quickly while the small mask between altitudes of 10 and 15 km. This altitude crystals remain at high altitudes (e.g., Houze et al. range is consistent with the outflow layer in Darwin 1992). The picture that emerges from these observa- sounding data (not shown). The reflectivity cross sec- tions is consistent with the schematics of Heymsfield et tion includes a cloud layer over the central eye, which is al. (2001, their Fig. 12). consistent with the lack of a clear eye in the satellite The polarimetric radar also allows us to estimate the imagery. Within the eyewall there remained echoes of precipitation microphysical structure. Figure 7b shows about 25 dBZ and evidence of a bright band extending the microphysical structure in a north–south cross sec- across the eye, indicating some drizzle. There may be tion through the storm. In the intense convection of the some smearing of reflectivity at the upper heights for northern eyewall segment there appears to be an al- ranges beyond 100 km, but the radar echoes near the most continuous volume of rain–hail mixtures in the tropopause and overshooting were consistent with IR region between 3 and 5 km in altitude, with a substan-
622 MONTHLY WEATHER REVIEW VOLUME 136
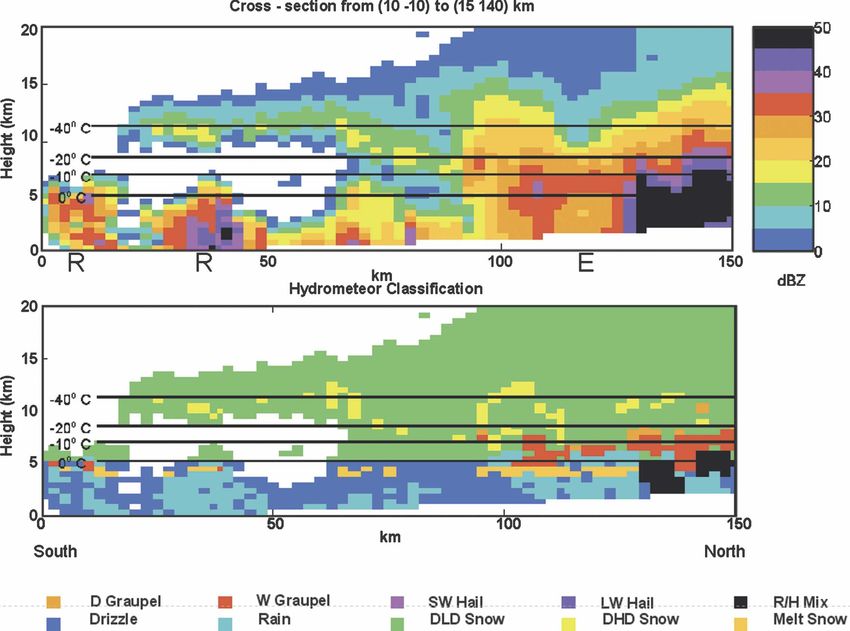
FIG. 7. The quasi-north–south cross section of the radar reflectivity and polarimetric microphysical classification at 0730 UTC along
the dashed line in Fig. 4; E marks the center of the eye and R marks rainbands.
tial volume of wet graupel overlying this. This is indica- low cells visible south of the eyewall, which are associ-
tive of the strong updrafts in the high-reflectivity area. ated with the small rainbands visible in Fig. 4, do not
May and Keenan (2005) saw significant hail signatures show any substantial mixed-phase regions. Interest-
only in storms that had updraft strengths near the freez- ingly, there are rain–hail mixture regions that are pro-
ing level of about 10 m s⫺1 or more. Soundings taken duced in cells of intense convection in the rainbands.
from Darwin show a typical tropical cyclone profile These cells are often initiated near the point where the
with relatively low convective available potential en- rainband circulation crossed onto the land and presum-
ergy (CAPE), but also almost no convective inhibition ably frictional convergence led to initiation of new con-
(CIN; not shown). Nevertheless, this environment was vection (e.g., Parrish et al. 1982). However, there was
clearly supporting substantial updraft strengths in the also substantial convective activity and higher lightning
eyewall region and, as will be shown, in convective rates in the later bands over the water as the storm was
cores in the rainbands. This is also seen by wet graupel, reintensifying after it moved offshore.
implying the presence of supercooled water extending Figure 8 shows a cross section of the maximum
to heights corresponding to nearly ⫺20°C. The high Doppler velocity across the storm (i.e., a cross section
implied vertical motions and consequent mixed-phase of the storm azimuthal wind speed). The velocity cross
regions are consistent with aircraft observations of hur- section shows a maximum velocity of about 50 m s⫺1
ricanes with high vertical velocities in very asymmetric and a radius of maximum wind (RMW) of 20 km
eyewalls as described by Black et al. (1994, 1996), Black slightly inside the highest reflectivity. There is also
and Hallett (1986, 1999), and Marks and Houze (1987). some asymmetry in the radial dependence. On the
The remainder of the eyewall convection and the shal- northwest side the Doppler velocity initially falls off asFEBRUARY 2008 MAY ET AL. 623
sides. There were significant asymmetries when part of
the circulation was over the water, with the winds over
the water between Cape Don and Melville Island show-
ing differences of more than 5 m s⫺1. The impact of the
warm ocean is also reflected in the rapid increase in
intensity as the eye moved over this relatively narrow
gap between these two landmasses, and the corre-
sponding decay as the circulation is partly over the
land. Interestingly, the asymmetry in the wind had no
significant effect on the reflectivity structure around the
eyewall, with the northern side being far more intense
regardless of whether the air motion at the radar beam
height indicated convergence or divergence. This must
mean that low-level convergence is dominating the sup-
ply of high-E air. As the storm center moved slightly
farther inland around 1500 UTC, the eyewall became
more circular as rainbands appeared to be wrapped
around it. By this time the maximum reflectivities had
decreased somewhat (but were still greater than 50
dBZ, indicating heavy rain), but there were no hail sig-
natures present in the estimates of the precipitation
microphysics near the eye. By 1800 UTC the storm was
moving away off the islands, and again the eyewall as-
sumed a very asymmetric structure with the maximum
reflectivity to the northwest (directly offshore and per-
FIG. 8. The cross section of (top) reflectivity and (bottom)
Doppler velocity at 0730 UTC along the solid line marked on Fig. pendicular to the coast) and with significant hail signa-
4. The location of rainbands (R) and the eyewall (EW) are shown tures again being present.
on the reflectivity. The Doppler velocity has an overlay of the The picture of the reflectivity and microphysical
expected profile for a vortex with an R⫺1 (light solid line) and structure of the eye at its maximum sampled convective
R⫺1/2 (light dotted line) radial dependence and linear variation
intensity is remarkably similar to the electrically active
inside the radius of maximum wind. Distance is in kilometers from
the zero isotach. eyes discussed by Black and Hallett (1999). Over sev-
eral aircraft penetrations they sampled unusually strong
updrafts, extending above the ⫺40°C level, and signifi-
the radius R⫺1/2 with a transition to a 1/R dependence, cant graupel, and implied supercooled water to the
which is inertially neutral, between the eyewall and the ⫺20°C level and associated charging in highly asym-
first rainband. On the southeast side, downwind from metric storms, including Hurricane Emily (Black et al.
the major convection, the falloff was midway between 1994). The hail signatures that were detected in the
these dependencies. This profile is consistent with low polarimetric radar data are consistent with vertical mo-
values of vorticity outside of the eyewall region despite tions comparable to those of Emily (cf. May and
the large circulation. Keenan 2005). Lightning data for the area at this time
The Doppler data also allow us to examine the time are somewhat limited, but data from a global network
evolution of the storm intensity as estimated by the of very low frequency (VLF) emission lightning detec-
maximum in Doppler velocity on both the inbound tion (Dowden et al. 2002) show flashes in the high-
(east) and outbound (west) side of the circulations (Fig. reflectivity zone on the northern eyewall, with a local
6, lower panel). Remember that these observations are maximum in occurrence around 0700 UTC of a few
at a range of approximately 100 km, so the vertical flashes per minute. Higher rates were seen in the rain-
resolution of the radar beam is about 2 km and the bands of the system during a convective burst outside
beam center is about 1.5 km above the ground. The the spatial domain considered in detail here as the
time series shows the general tendency for the storm to storm reintensified. Long-range radar scans show that
decrease in intensity as it traverses the northern part of these were periods of significant convective areas
the Tiwi Islands. However, there are interesting short- aligned along the bands (not shown). It is difficult to be
period variations in both the intensity and the asymme- quantitative about this, because detection efficiencies
try between the strength of the circulation on the two are quite low and dependent on the absolute geometry624 MONTHLY WEATHER REVIEW VOLUME 136
of the detectors, but are likely less than 1% and prima- in that the brightness temperature minimum is located
rily, but not completely, cloud-to-ground strikes (Ja- cyclonically from the rainfall maximum, which is in turn
cobson et al. 2006). Very high reflectivities and asym- located cyclonically from the downshear side of the
metric rain distributions with an offshore maximum storm.
also characterized Hurricane Danny (Blackwell 2000)
and it may be reasonable to infer a similar microphysi-
b. Influence of asymmetric surface friction
cal structure for that storm as well.
Asymmetric friction resulting from storm motion will
force an asymmetric updraft at the top of the boundary
4. Origin of the asymmetry: Large-scale shear and layer (Shapiro 1983; Kepert 2001; Kepert and Wang
surface friction? 2001), with the maximum updraft being to the left front
of a Southern Hemisphere storm. More recently, it has
Asymmetries in the eyewall structure of a tropical
been recognized (Kepert 2002a,b) that proximity to
cyclone have previously been ascribed to both the ef-
land is also a source of asymmetric surface friction and
fect of wind shear across the storm and the impact of
will have similar dynamic consequences for the BL
land surface being near the storm center. Both of these
structure. The inner-core surface flow asymmetry in a
mechanisms are probably having some impact for this
tropical cyclone is usually oriented with the maximum
case and need to be considered in some detail.
storm-relative inflow in the right-forward quadrant,
and the maximum storm-relative azimuthal flow in the
a. Shear left-forward quadrant, 90° downstream of the inflow
Vertical wind shear values were calculated from the maximum. The motion-induced surface flow asymme-
National Centers for Environmental Prediction try has been known since the pioneering work of Red-
(NCEP) reanalysis, over a storm-centered 200–800-km field (1830), Reid (1838), and Piddington (1848) in the
annulus, as used for the wind shear prediction in the first part of the nineteenth century, and is described in
Statistical Hurricane Intensity Prediction Scheme numerous observational (e.g., Arakawa and Suda 1953;
(SHIPS) model (DeMaria et al. 2005). Examination of Frank 1976; Powell 1982, 1987; Frank 1984; Black et al.
individual analyses showed that the storm was well lo- 1988; Powell and Houston 1998) and theoretical
cated, so removal of the storm circulation was not nec- (Shapiro 1983; Kepert 2001; Kepert and Wang 2001)
essary. From 12 to 13 March the 850–200-hPa shear papers, although we caution that it may, at times, be
decreases gradually from 9 to 7 m s⫺1 from the east- overwhelmed by other sources of asymmetric forcing.
southeast. Beginning around 1200 UTC 14 March, the The storm-relative motion-induced wind asymmetry ro-
shear began to weaken more rapidly and was only a few tates anticyclonically with height through the boundary
meters per second by 0000 UTC 15 March. Both theory layer. Kepert (2001) and Kepert and Wang (2001) have
(e.g., Jones 1995) and observations (e.g., Black et al. studied the three-dimensional dynamics of the tropical
2002; Corbosiero and Molinari 2002; Rogers et al. 2003) cyclone boundary layer and have shown that this struc-
have shown that the vortex tilts with, and to the right of, ture can be understood as a frictionally modified wave-
the shear vector (in the Southern Hemisphere), with number 1 inertia wave, forced by the asymmetric sur-
low-level convergence and eyewall ascent enhanced face friction, whose vertical structure is such that ver-
down tilt and suppressed up tilt. The consequences for tical diffusion and vertical advection act to reduce the
cloud and rainfall are complex, because both are rap- wave’s phase speed to zero. Detailed analyses (Kepert
idly advected around the storm from the near-surface 2006a,b) of GPS dropsonde data in Hurricanes Georges
forcing region. While there is strong agreement that the and Mitch found structures very similar to this, except
rainfall maximum is cyclonically rotated from the maxi- that in Mitch the orientation of the asymmetry was dis-
mum forced updraft, the observed degree of rotation is placed almost 180° in azimuth, with the maximum near-
somewhat variable and will clearly depend on the an- surface inflow on the left flank in the offshore flow, and
gular velocity of the wind in the vicinity of the feature. the maximum azimuthal wind to the rear. At the time,
Recently, Halverson et al. (2006) have shown that the Mitch was very slowly moving and about 80 km off the
maximum convective tops can be rotated as much as Honduras coast. Kepert (2006b) argued that the mo-
halfway around the storm from the low-level conver- tion-induced asymmetric friction was dominated by
gence maximum. that resulting from the proximity to land in this case,
The observed reflectivity, eyewall height, and cloud- and presented a model simulation in support of this
top temperature asymmetries (Figs. 3 and 4) are thus at mechanism. The eyewall updraft asymmetry in this
least qualitatively consistent with environmental shear, simulation was consistent with the observed radar re-FEBRUARY 2008 MAY ET AL. 625 flectivity asymmetry in Mitch, although it was not pos- librium all-sea situation, as the boundary layer adjusts sible to rule out environmental shear as a cocontributor to the changed surface condition. Examination of the to the asymmetric forcing. model output shows that the azimuth of the strongest Ingrid represents an interesting example of a storm winds rotates anticyclonically with height, consistent being influenced by asymmetric surface friction, be- with Kepert’s (2001) stalled inertia wave argument, and cause with the land to the left of the track, both sources that the strongest winds below about 1.5 km are over of asymmetric friction are nearly in phase, and so a very the sea, even though the strongest gradient winds are strong frictional asymmetry would be expected. over the land to the south (where the storm motion The three-dimensional tropical cyclone boundary adds to the swirling flow). The eyewall updraft is layer (TCBL) model of Kepert and Wang (2001) is used strongly asymmetric, with a 6.6 m s⫺1 updraft at the to examine the flow asymmetry more closely. This front left of the storm extending around to the right, model is a very high vertical resolution boundary layer and a downdraft to the rear. This asymmetry is quali- model, with a translating parametric pressure field in- tatively consistent with the observed rainfall and cloud tended to represent the remainder of the cyclone, and is height asymmetries, if some allowance for cyclonic ad- not intended to depict the full physics of a tropical cy- vection is made. A further interesting feature is a clone. Rather, the focus is on the dynamical structure of weaker band of upward motion that spirals out from the boundary layer, excluding the impact of deep con- the front of the eye toward the southeast, and is similar vection, to isolate the dynamical impact of the surface in structure to bands seen in the radar imagery (e.g., friction and its inhomogeneities, which may have a sig- Fig. 3). This band may be related to the instability mod- nificant impact on the real storm structure. For details eled by Nolan (2005) in an axisymmetric model, al- of the model physics and initiation, the reader is re- though here it is clearly dependent on the storm asym- ferred to Kepert and Wang (2001). The free- metry also. Finally, comparison of the horizontal flow atmosphere flow was derived by fitting a Holland at 10 m with that at 1 km shows a marked outward slope (1980) profile to mean sea level pressure (MSLP) ob- of the RMW with height. Because the model contains servations from Cape Don and McCluer Island no warm core, this is not baroclinic in origin, but rather (11.05°S, 132.98°E) renavigated into storm-relative co- must be a result of the frictional forcing. ordinates, which gave a maximum gradient wind of 50 Sensitivity calculations with a variety of surface forc- m s⫺1 at a radius of 17 km (consistent with the Doppler ings were done to estimate their relative importance in radar data) and a B parameter of 1.4. The central pres- producing the frictionally forced updraft, and are sum- sure of 950 hPa and the mean storm motion of 3.4 m s⫺1 marized in Table 1. Comparing the stationary storms from the postanalysis best track by the Australian Bu- entirely over both sea and land (i.e., the symmetric reau of Meteorology Tropical Cyclone Warning Centre cases), the latter has a much greater updraft because of in Darwin were used. The coast was simplified to a the greater surface roughness. For a storm wholly over straight line along the track, with land with a roughness sea, the effect of motion is to moderately increase the length of 0.3 m to the south, and sea to the north. Land mean updraft, but greatly increase the peak, due to the and sea temperatures were taken to be equal at 300 K. development of a marked asymmetry with ascent to the The modeled 10-m horizontal wind components and front, and descent to the rear, of the maximum wind 1-km vertical motion are shown in Fig. 9. The increased belt. Adding a land–sea contrast to the situation pro- inflow over land, resulting from the greater surface duces an increase in the mean updraft to values be- roughness, is readily apparent. As the flow passes from tween the sea- and land-only cases, because half of the land to sea the surface friction reduces, but vertical storm now experiences increased surface roughness. mixing remains strong because of the horizontal advec- The peak updraft experiences a relatively greater in- tion of turbulent kinetic energy, which drives an adjust- crease than the mean, because of the increased asym- ment of the air columns to a less sheared state. The metric forcing. The three cases with asymmetric surface inflow thus strengthens near the surface but weakens friction have similar patterns of vertical motion in the aloft, with the height of the maximum inflow falling inner core, because the phase of the motion- and land- from 200 to 300 m over the land to about 100 m imme- induced asymmetries is similar. The magnitudes, how- diately offshore (Fig. 10). Similarly, the near-surface ever, are markedly different. azimuthal flow accelerates, not just because of the re- The rainfall asymmetry is thus qualitatively consis- duction in surface friction, but also because the inward tent with both the environmental shear and with asym- advection of the angular momentum by the radial flow metric friction resulting from proximity to land. Deter- is now stronger than that which would apply in an equi- mining the relative contributions would be difficult in
626                                       MONTHLY WEATHER REVIEW                                                    VOLUME 136

                     FIG. 9. The modeled flow in the boundary layer of TC Ingrid: (a) radial and (b) azimuthal
                  earth-relative flow at 10 m, and (c) vertical velocity and (d) azimuthal flow at 1.05 km. The
                  land occupies the southern half of the domain, the sea is to the north, and the Southern
                  Hemisphere storm is moving to the left at 3.4 m s⫺1. Contour intervals are 5 (20) m s⫺1 for
                  light (heavy) contours for the radial and azimuthal flow and 1 (3) m s⫺1 for the vertical flow.
                  Darker shading corresponds to outflow, stronger swirling flow, and a stronger updraft, re-
                  spectively.

this case, because both the boundary layer flow (Kepert            range considered by Frank and Ritchie (1999, 2001),
2006a,b) and the response to shear (Reasor et al. 2004)            while the frictional updraft asymmetry is strong; thus,
are known to be sensitive to small details of the storm            one might plausibly speculate that the latter mechanism
structure, and there is insufficient data to determine             dominates. The evolution toward symmetry as the bulk
this. Frank and Ritchie (1999, 2001) have considered               of the eye moved over the islands and the subsequent
the relative effects of the motion-induced boundary                asymmetry to the northwest as the storm was recrossing
layer asymmetry and shear-induced tilt of the vortex               the coast lend additional support to this inference. The
axis in determining the updraft, cloud, and rain asym-             fact that Ingrid then regained much of its symmetry as
metries in tropical cyclones. For the cases they consid-           it moved well away from the islands is likely due to both
ered, the effects of the forcings tend to reinforce if they        the declining land influence and the decrease in envi-
are in phase, but shear dominates if they are out of               ronmental shear. If the proximity to land is indeed hav-
phase, with the frictional asymmetric updraft extending            ing a substantial influence on the boundary layer wind
only a modest distance above the boundary layer. How-              structure, and this is affecting the eyewall depth and
ever, their cases were relatively slowly moving, so the            cloud-top temperature asymmetries, then there may be
frictional asymmetric forcing was much weaker than in              implications for Dvorak analysis of cyclone intensity
this case. Here the shear is toward the lower end of the           near landfall.
FEBRUARY 2008 MAY ET AL. 627
TABLE 1. Influence of various factors on the mean and peak
updraft strength at 1-km height within 1.5 times the RMW of the
modeled storm center.
Mean w (m s⫺1) Peak w (m s⫺1)
All sea, stationary 0.26 0.40
All sea, moving 0.37 1.72
Land/sea, stationary 0.84 3.57
Land/sea, moving 1.04 6.77
All land, stationary 1.54 2.81
Fig. 4, including one that is intensifying significantly. As
can be seen in the cross section, these were often made
up of shallow cells. Animations show that these rotated
about the storm much faster than the outer bands be-
fore stalling and merging near the intersection of the
large band. This relatively rapid motion is undoubtedly
partly due to the radial variation of angular velocity
FIG. 10. Vertical profiles of (a) earth-relative radial wind and within the storm. It is not clear if these lines were
(b) earth-relative azimuthal wind components, at the radius of propagating azimuthally with respect to the storm cir-
maximum gradient wind in the front of the storm. The heavy culation, but their regularity certainly gives them a
profiles are over the land at two grid points (6 km) south of the wavelike appearance, and an isochrone analysis sug-
coast, while the light profiles are downwind of this over the sea at
two grid points north of the coast. The change in surface rough-
gests outward radial propagation at speeds of 6–8
ness causes the reduced near-surface shear in the oversea profiles, m s⫺1. These speeds are quite low compared with those
but the near-surface inflow is stronger than that over land because expected from the likely phase speeds of gravity waves
of the mixing down of radial momentum from aloft, which in turn generated at the RMW, as was hypothesized to explain
increases the radial advection of angular momentum and helps
similar propagating lines in TC Laurence (May 1996),
accelerate the near-surface azimuthal wind.
but a gravity wave initiation source cannot be ruled out
given the low inertial stability outside the RMW. Gall
5. Rainband structures et al. (1998) analyzed radar imagery of hurricanes and
found, along with the major inner-core bands, strong
There were two distinct types of rainbands observed evidence for the existence of numerous smaller bands
in the radar data. There were some large-scale, long- on the scale of 2–20 km, mostly near the eyewall. Simi-
lived bands that extended from near the north side of lar bands have been seen in high-resolution numerical
the eyewall around to the south of Darwin and a simi- simulations by Yau et al. (2004) and Romine and Wil-
lar, but less well developed, line that connected to the helmson (2006). The bands appear to propagate too
southwest side of the eyewall (Fig. 4). These lines were slowly to be gravity waves, while the vortex Rossby
almost stationary. The band was largely stratiform in wave theory of Montgomery and Kallenbach (1997)
nature, except for some embedded convective ele- predicts a radial propagation speed of 2.5–3.5 m s⫺1 for
ments. These were mostly, but not always, initiated wavenumber 2 disturbances, or less for higher wave-
near coastal boundaries where there is an increase of numbers or lower vorticity gradients. However, the
surface friction, and therefore the potential for an up- bands do appear to be confined to the region with sig-
draft to be triggered (e.g., Parrish et al. 1982). The con- nificant vorticity gradient (Fig. 8). Nolan (2005) and
vection in these elements was often deep, reaching to Foster (2005) have shown that the Ekman-like bound-
the tropopause and with rain–hail mixtures detected ary layer in a TC is unstable and can produce stream-
between heights of 3 and 5 km. This is in marked con- wise rolls on a range of scales; Nolan adds that they may
trast to most convection in monsoon conditions at Dar- spiral inward, outward, or neither.
win where there is almost no hail reported (May and The reflectivity in these bands reached reasonably
Keenan 2005). high values (40–45 dBZ ), as can be seen in Figs. 4, 5,
As well as the large-scale bands there were a number and 6, but tended to be shallow because the echoes
of small lines with a length of about 50 km within a were confined mainly below the freezing level, and es-
radius of about 60 km. Several of these can be seen in sentially there is no component above 10 km.628 MONTHLY WEATHER REVIEW VOLUME 136
6. Discussion and conclusions islands and was in the open ocean. Some filling of the
eyewall, including weak radar echoes as well as in sat-
The most dramatic feature of the cross sections and ellite imagery, was observed in both Ingrid and land-
rainfall in the region of the eye is the persistent asym- falling Hurricane Georges (e.g., Geerts et al. 2000).
metry in the eyewall height and intensity. Interestingly, Both environmental shear and the presence of a
the maximum eyewall height and rainfall rate were on coastline contributed to the asymmetries. The surface
the ocean side of the vortex center, rather than over frictional forcing was strongly asymmetric, because
land. It may be thought that the increase in surface both the motion and the land–sea contrast gave the
roughness on the onshore flow would have enhanced strongest forcing on the left (south) of the track. Cal-
the local convergence, and hence rain, on the land side culations using a boundary layer model showed that
of the islands, but the reverse pattern is evident. A this caused a peak frictionally forced updraft in excess
triggering effect of increased surface friction at the of 6 m s⫺1 in the western part of the eyewall. This is
coastline for convection can occasionally be seen in much stronger than the asymmetry forced by motion
some of the rainband structure as the main band ro- alone, and likely made a substantial contribution to the
tated across the coastline (cf. Parrish et al. 1982). An- observed cloud and rainfall asymmetries. Further cir-
other clear feature on the south side is the spinning off cumstantial evidence for this factor is provided by the
of small wavelike rainbands. storm becoming more symmetric when most of its inner
This paper represents the first documentation of circulation was over the island and a northwest–south-
tropical cyclone microphysical structure with a polari- east asymmetry perpendicular to the coast developing
metric radar. A particular feature is the volume where as the storm moved off the islands. The maximum rain-
hail is forming, but not reaching the surface around the fall was located offshore as in observations by Chan et
eyewall, and in some of the more intense cells of the al. (2004) and Blackwell (2000).
rainbands. Hail was an indication of strong vertical mo- Soundings from Darwin showed a typical near-
tions with updrafts greater than about 10 m s⫺1 near the cyclone sounding that was almost moist adiabatic with
freezing level in the observations of May and Keenan high humidity through its depth and with little CAPE
(2005), so that there are substantial supercooled water or convective inhibition. The high-speed updrafts im-
droplets. The distribution of maximum updraft speeds plied in the eyewall and in the convective cores of the
in aircraft penetrations of eyewall convection shows the stationary rainbands appear at odds with the soundings.
90th percentile of the distribution of core updraft The available moisture and low CIN also make the
maxima is less than 10 m s⫺1 (Lucas et al. 1994), but weakness of the eye over the islands puzzling, but it
updrafts with magnitudes greater than 20 m s⫺1 have appears that enhanced moisture availability over the
been observed on occasion at altitudes near the freez- ocean was a key (e.g., Chan et al. 2004). Another pos-
ing level (Black et al. 1994; Black et al. 1996). It is sibility is a delay while the cells developed as they ro-
interesting to note that the Black et al. (1994) observa- tated over the land, but there was no clear signature of
tions were also of a storm with a very asymmetric eye this around the eyewall.
reflectivity structure. There is also an extensive region The right-front convection and rainfall maximum ob-
of wet graupel overlaying the hail. These are consistent served here is an extreme case of what has often been
with the strong updrafts present in the deep convection observed as storms are making landfall. For example,
and the conceptual model described in Fig. 16 of Black papers by Blackwell (2000) and Chan et al. (2004), as
and Hallett (1999), although graupel has been observed well as references cited by those papers, document con-
coincident with moderate strength updrafts (e.g., vective maxima to the left or left front of Northern
Houze et al. 1992). Hemisphere storms as they are making landfall, al-
The outflow from the storm had substantial radar though models tend not to produce this result. The long
echoes between 10 and 14 km in elevation and was lifetime of the asymmetry and the propagation along a
composed mostly of snow with a tendency for either coast rather than perpendicular to the coast may make
larger or denser crystals with higher reflectivities near TC Ingrid a good test for models.
the lower parts of the cloud (Fig. 5). This outflow ex-
tended well past the eye, at least for a radius of 70 km, Acknowledgments. This work has been partially sup-
and covered part of the eye itself, although the height of ported by the U.S. DOE Atmospheric Radiation Mea-
the reflectivity contours was a minimum in the eye. The surement (ARM) program. The Worldwide Lightning
satellite image showed a dense overcast over the whole Location Network lightning data have been supplied by
storm at this time, consistent with the radar images. The Prof. Holzworth of the University of Washington. The
eye only cleared after the storm had moved past the rainfall estimation code was developed during a sab-FEBRUARY 2008 MAY ET AL. 629
batical visit of Prof. V. N. Bingi to BMRC, supported Foster, R. C., 2005: Why rolls are prevalent in the hurricane
by Colorado State University and BMRC. boundary layer. J. Atmos. Sci., 62, 2647–2661.
Frank, W. M., 1976: The structure and energetics of the tropical
cyclone. Dept. of Atmospheric Science, Colorado State Uni-
REFERENCES versity, Paper 258, 180 pp.
Arakawa, H., and K. Suda, 1953: Analysis of winds, wind waves, ——, 1984: A composite analysis of the core of a mature hurri-
and swell over the sea to the east of Japan during the typhoon cane. Mon. Wea. Rev., 112, 2401–2420.
of September 26, 1935. Mon. Wea. Rev., 81, 31–37. ——, and E. A. Ritchie, 1999: Effects of environmental flow upon
Black, M. L., R. W. Burpee, and F. D. Marks Jr., 1996: Vertical tropical cyclone structure. Mon. Wea. Rev., 127, 2044–2061.
motion characteristics of tropical cyclones determined with ——, and ——, 2001: Effects of vertical wind shear on the inten-
airborne Doppler radial velocities. J. Atmos. Sci., 53, 1887– sity and structure of numerically simulated hurricanes. Mon.
1909. Wea. Rev., 129, 2249–2269.
——, J. F. Gamache, F. D. Marks Jr., C. E. Samsury, and H. E. Gall, R., J. Tuttle, and P. Hildebrand, 1998: Small-scale spiral
Willoughby, 2002: Eastern Pacific Hurricanes Jimena of 1991 bands observed in Hurricanes Andrew, Hugo, and Erin.
and Olivia of 1994: The effect of vertical shear on structure Mon. Wea. Rev., 126, 1749–1766.
and intensity. Mon. Wea. Rev., 130, 2291–2312. Geerts, B., G. M. Heymsfield, L. Tian, J. B. Halverson, A. Guil-
Black, P. G., R. L. Elsberry, L. K. Shay, R. P. Partridge, and J. D. lory, and M. I. Mejia, 2000: Hurricane Georges’s landfall in
Hawkins, 1988: Atmospheric boundary layer and oceanic the Dominican Republic: Detailed airborne Doppler radar
mixed layer observations in Hurricane Josephine obtained imagery. Bull. Amer. Meteor. Soc., 81, 999–1018.
from air-deployed drifting buoys and research aircraft. J. At- Halverson, J. B., J. Simpson, G. M. Heymsfield, H. Pierce, T.
mos. Oceanic Technol., 5, 683–698. Hock, and L. Ritchie, 2006: Warm core structure of Hurri-
Black, R. A., and J. Hallett, 1986: Observations of the distribution cane Erin diagnosed from high altitude dropsondes during
of ice in hurricanes. J. Atmos. Sci., 43, 802–822. CAMEX-4. J. Atmos. Sci., 63, 309–324.
——, and ——, 1999: Electrification of the hurricane. J. Atmos. Heymsfield, G. M., J. B. Halverson, J. Simpson, L. Tian, and T. P.
Sci., 56, 2004–2028. Bui, 2001: ER-2 Doppler radar investigations of the eyewall
——, H. B. Bluestein, and M. L. Black, 1994: Unusually strong of Hurricane Bonnie during the Convection and Moisture
vertical motions in a Caribbean hurricane. Mon. Wea. Rev., Experiment-3. J. Appl. Meteor., 40, 1310–1330.
122, 2722–2739. Holland, G. J., 1980: An analytic model of the wind and pressure
Blackwell, K. G., 2000: The evolution of Hurricane Danny (1997) profiles in hurricanes. Mon. Wea. Rev., 108, 1212–1218.
at landfall: Doppler-observed eyewall replacement, vortex Houze, R. A., Jr., F. D. Marks Jr., and R. A. Black, 1992: Dual-
contraction/intensification, and low-level wind maxima. Mon. aircraft investigation of the inner core of Hurricane Norbert.
Wea. Rev., 128, 4002–4016. Part II: Mesoscale distribution of ice particles. J. Atmos. Sci.,
Bringi, V. N., G.-J. Huang, V. Chandrasekar, and T. D. Keenan, 49, 943–962.
2001: An areal rainfall estimator using differential propaga-
Jacobson, A. R., R. Holzworth, J. Harlin, R. Dowden, and E. Lay,
tion phase: Evaluation using a C-band radar and a dense
2006: Performance assessment of the World Wide Lightning
gauge network in the Tropics. J. Atmos. Oceanic Technol., 18,
Location Network (WWLLN), using the Los Alamos Sferic
1810–1818.
Array (LASA) as ground truth. J. Atmos. Oceanic Technol.,
——, ——, ——, and E. Gorgucci, 2002: A methodology for es-
23, 1082–1092.
timating the parameters of a gamma raindrop size distribu-
Jones, S. C., 1995: The evolution of vortices in vertical shear. 1.
tion model from polarimetric radar data: Application to a
Initially barotropic vortices. Quart. J. Roy. Meteor. Soc., 121,
squall-line event from the TRMM/Brazil campaign. J. Atmos.
821–851.
Oceanic Technol., 19, 633–645.
Keenan, T. D., 2003: Hydrometeor classification with a C-band
——, T. Tang, and V. Chandrasekar, 2004: Evaluation of a new
polarimetric radar. Aust. Meteor. Mag., 52, 23–31.
polarimetrically based Z–R relation. J. Atmos. Oceanic Tech-
nol., 21, 612–623. ——, K. Glasson, F. Cummings, T. S. Bird, J. Keeler, and J. Lutz,
Carey, L. D., S. A. Rutledge, D. A. Ahijevych, and T. D. Keenan, 1998: The BMRC/NCAR C-band polarimetric (C-POL) ra-
2000: Correcting propagation effects in C-Band polarimetric dar system. J. Atmos. Oceanic Technol., 15, 871–886.
radar observations of tropical convection using differential Kepert, J. D., 2001: The dynamics of boundary layer jets within
propagation phase. J. Appl. Meteor., 39, 1405–1433. the tropical cyclone core. Part I: Linear theory. J. Atmos. Sci.,
Chan, J. C. L., K. S. Liu, S. E. Ching, and E. S. T. Lai, 2004: 58, 2469–2484.
Asymmetric distribution of convection associated with tropi- ——, 2002a: The impact of landfall on tropical cyclone boundary
cal cyclones making landfall along the South China coast. layer winds. Extended Abstracts, 25th Conf. on Hurricanes
Mon. Wea. Rev., 132, 2410–2420. and Tropical Meteorology, San Diego, CA, Amer. Meteor.
Corbosiero, K. L., and J. Molinari, 2002: The effects of vertical Soc., 335–336.
wind shear on the distribution of convection in tropical cy- ——, 2002b: Modelling the tropical cyclone boundary layer wind-
clones. Mon. Wea. Rev., 130, 2110–2123. field at landfall. Extended Abstracts, 14th BMRC Modelling
DeMaria, M., M. Mainelli, L. K. Shay, J. A. Knaff, and J. Kaplan, Workshop: Modelling and Predicting Extreme Events, Mel-
2005: Further improvements to the Statistical Hurricane In- bourne, Australia, Bureau of Meteorology Research Center,
tensity Prediction Scheme (SHIPS). Wea. Forecasting, 20, 81–84.
531–543. ——, 2006a: Observed boundary layer wind structure and balance
Dowden, R. L., J. B. Brundell, and C. J. Rodger, 2002: VLF light- in the hurricane core. Part I: Hurricane Georges. J. Atmos.
ning location by time of group arrival (TOGA) at multiple Sci., 63, 2169–2193.
sites. J. Atmos. Sol.-Terr. Phys., 64, 817–830. ——, 2006b: Observed boundary layer wind structure and balance630 MONTHLY WEATHER REVIEW VOLUME 136
in the hurricane core. Part II: Hurricane Mitch. J. Atmos. Sci., ——, 1987: Changes in the low-level kinematic and thermody-
63, 2194–2211. namic structure of Hurricane Alicia (1983) at landfall. Mon.
——, and Y. Wang, 2001: The dynamics of boundary layer jets Wea. Rev., 115, 75–99.
within the tropical cyclone core. Part II: Nonlinear enhance- ——, and S. H. Houston, 1998: Surface wind fields of 1995 Hur-
ment. J. Atmos. Sci., 58, 2485–2501. ricanes Erin, Opal, Luis, Marilyn, and Roxanne at landfall.
Lucas, C., E. J. Zipser, and M. A. Lemone, 1994: Vertical velocity Mon. Wea. Rev., 126, 1259–1273.
in oceanic convection off tropical Australia. J. Atmos. Sci., 51, Reasor, P. D., M. T. Montgomery, and L. D. Grasso, 2004: A new
3183–3193. look at the problem of tropical cyclones in vertical shear flow:
Marks, F. D., Jr., and R. A. Houze Jr., 1987: Inner core structure Vortex resiliency. J. Atmos. Sci., 61, 3–22.
of Hurricane Alicia from airborne Doppler radar observa- Redfield, W. C., 1830: Remarks on the prevailing storms of the
tions. J. Atmos. Sci., 44, 1296–1317. Atlantic Coast of the North American states.. J. Sci. Arts, 20,
May, P. T., 1996: The organization of convection in the rainbands 17–43.
of Tropical Cyclone Laurence. Mon. Wea. Rev., 124, 807–815. Reid, R. E., 1838: A statement of progress made towards devel-
——, and T. D. Keenan, 2005: Evaluation of microphysical re- oping the law of storms; and of what seems further desirable
trievals from polarimetric radar with wind profiler data. J. to be done to advance our knowledge of the subject. Report
Appl. Meteor., 44, 827–838. of the eighth meeting of the British Association of the Ad-
——, ——, D. S. Zrnić, L. D. Carey, and S. A. Rutledge, 1999: vancement of Science, Vol. 7, 21–25.
Polarimetric radar measurements of tropical rain at a 5-cm Rogers, R., S. Chen, J. Tenerelli, and H. Willoughby, 2003: A
wavelength. J. Appl. Meteor., 38, 750–765. numerical study of the impact of vertical shear on the distri-
——, A. R. Jameson, T. D. Keenan, and P. E. Johnston, 2001: A bution of rainfall in Hurricane Bonnie (1998). Mon. Wea.
comparison between polarimetric radar and wind profiler ob- Rev., 131, 1577–1599.
servations of precipitation in tropical showers. J. Appl. Me- Romine, G. S., and R. B. Wilhelmson, 2006: Finescale spiral band
teor., 40, 1702–1717. features within a numerical simulation of Hurricane Opal
Montgomery, M. T., and R. J. Kallenbach, 1997: A theory for vor- (1995). Mon. Wea. Rev., 134, 1121–1139.
tex Rossby-waves and its application to spiral bands and in- Schuur, T., A. Ryzhkov, P. Heinselman, D. Zrnić, D. Burgess, and
tensity changes in hurricanes. Quart. J. Roy. Meteor. Soc., K. Scharfenberg, 2003: Observations and classification of
123, 435–465. echoes with the polarimetric WSR-88D radar. NOAA NSSL
Nolan, D. S., 2005: Instabilities in hurricane-like boundary layers. Rep., 46 pp.
Dyn. Atmos. Oceans, 40, 209–236. Shapiro, L. J., 1983: The asymmetric boundary layer flow under a
Parrish, J. R., R. W. Burpee, F. D. Marks Jr., and R. Grebe, 1982: translating hurricane. J. Atmos. Sci., 40, 1984–1998.
Rainfall patterns observed by digitized radar during the land- Straka, J. M., D. S. Zrnić, and A. V. Ryzhkov, 2000: Bulk hydro-
fall of Hurricane Frederic (1979). Mon. Wea. Rev., 110, 1933– meteor classification and quantification using polarimetric ra-
1944. dar data: Synthesis of relations. J. Appl. Meteor., 39, 1341–
Piddington, H., 1848: The Sailor’s Horn Book for the Law of 1372.
Storms: Being a Practical Exposition of the Theory of the Law Yau, M. K., Y. Liu, D.-L. Zhang, and Y. Chen, 2004: A multiscale
of Storms and Its Uses to Mariners of All Classes in All Parts numerical study of Hurricane Andrew (1992). Part VI: Small-
of the World. Smith, Elder and Co., 292 pp. scale inner-core structures and wind streaks. Mon. Wea. Rev.,
Powell, M. D., 1982: The transition of the Hurricane Frederic 132, 1410–1433.
boundary-layer wind field from the open Gulf of Mexico to Zrnić, D. S., and A. V. Ryzhkov, 1999: Polarimetry for weather
landfall. Mon. Wea. Rev., 110, 1912–1932. surveillance radars. Bull. Amer. Meteor. Soc., 80, 389–406.You can also read