Discussion of different Remote sensing satellite possibilities for scientifical Earth observations.
←
→
Page content transcription
If your browser does not render page correctly, please read the page content below
E3S Web of Conferences 264, 04007 (2021)                                 https://doi.org/10.1051/e3sconf/202126404007
CONMECHYDRO - 2021

          Discussion of different Remote sensing
          satellite possibilities for scientifical Earth
          observations.
          Aybek Arifjanov1, Shamshodbek Akmalov* [0000-0002-5302-7851], Shakhzod Shodiev1, and
          Abdukarim Haitov1

          Tashkent Institute of Irrigation and Agricultural Mechanization Engineers, Tashkent, Uzbekistan

                         Abstract. More than 1,000 satellites are launched into space, and they
                         differ in their functions, rotation orbits, resolution, and other
                         properties. Scientists divide the satellites into low-resolution, medium-
                         resolution, high-resolution, and very high-resolution satellites by their
                         properties. Now, the biggest challenge facing scientists is to use some
                         of these different resolution images in their field. To get the expected
                         result, it is very important to analyze the image that needs an which
                         gives more accurate results. Therefore, the main attention of this article
                         is aimed to find the answer to these problems. In this article 3 satellite
                         images which have different resolution are analyzed. The possibility of
                         middle-resolution images of MODIS, high-resolution images of
                         Landsat, and very high-resolution images of WorldView-2 (WV-2)
                         satellites using GIS are analyzed. A research area was the Syrdarya
                         region, and downloaded different images of satellites of this area and
                         compared with using e Cognition. According to the results, a more
                         accurate satellite image for irrigation sets information is WorldView-2
                         images. In comparison analysis, it shows more accurate properties than
                         other satellite images. As irrigation sets are small objects for the
                         analysis, very high spatial resolution satellite images are important.
                         Water discharge and surface change happen very fast; thus, it requires
                         daily monitoring of the condition. And in this case, the temporal
                         resolution of the MODIS and Landsat is 16 day, and it is a too long
                         period.

          1 Introduction
          During the last 20 years, satellites were launched into the sky. Those satellites were
          sending information about the Earth with different possibilities and properties. The
          main problem of the branches now is to find satellite information that gives more
          accurate results in analysis and financially accessible. Moreover, during the literature

          *
              Corresponding author: shamshodbekjon@mail.ru

© The Authors, published by EDP Sciences. This is an open access article distributed under the terms of the Creative Commons
Attribution License 4.0 (http://creativecommons.org/licenses/by/4.0/).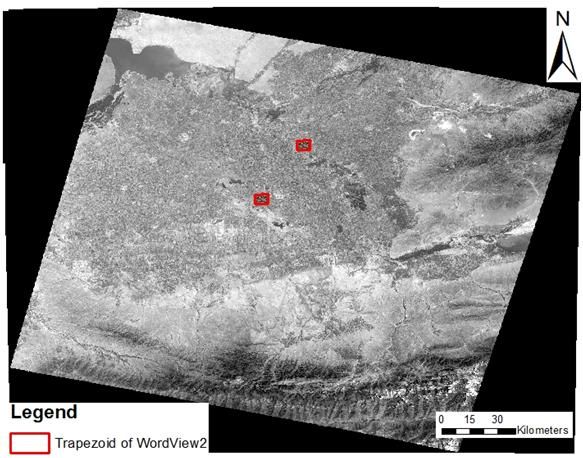
E3S Web of Conferences 264, 04007 (2021) https://doi.org/10.1051/e3sconf/202126404007
CONMECHYDRO - 2021
review, we have discovered the following benefits of using each satellite. The benefits
of using MODIS images [5]:
MODIS Terra scanner has NDVI layers, which save time in calculations and
increase the accuracy of them;
MODIS Terra scanner is the only satellite that has been importing images to Earth
incessantly since 2000. Other existing satellites sometimes deviated from the schedule
due to technical disrepairs and other reasons, and other satellites have been launched
just in recent years. The other remaining satellites have low resolution images. Change
of vegetation layer occurs in a short period, and its data should be collected incessantly,
and MODIS is a perfect satellite for it [28];
Images of MODIS have been used widely by the scientists of Uzbekistan;
MODIS images are easily accessible;
MODIS takes large scale images that cover wide areas (250 m/pixel), and it allows
making analyses on large scales;
Agricultural fields are large, and the low resolution of MODIS helps to merge them
into 1 or several pixels. As a result, 1 pixel includes NDVI information on one type of
vegetation field approximately; thus, the work will be simplified [7].
Advantage of using Landsat long term images:
Landsat satellites have been supplying scientists with images since 1970. Data
collected from the 70s onwards give us a chance to analyse the land cover changes that
have occurred in the study area during a long period [25];
Landsat 8 satellite was launched in 2013, and it is a new data source for RS
specialists [9];
It is the first-ever satellite with high resolution and multi bands, and it eases LC
analysis;
These images are easily accessible;
Satellite sensors resolution is higher in comparison with other free satellite images.
Advantage of using WV-2 satellite data for water objects and irrigation sets extraction
analysis:
WV2 is a very high resolution satellite image, and it is possible to see even the
smallest water sets (with 5m width). The size of the panchromatic band is 0.5 m, and it
gives the possibility to analyse very small objects (>0.5m) [13];
Those images have shown very good results for the classification of small objects as
buildings, water sets and agricultural fields [1, 11,12];
Its hyperspectral satellite, multi MS1, MS2, and PAN bands increase the
classification possibilities during analysis;
With the help of WV2 image layers, about 40 indexes were created, and more than
10 of them are NDWI indexes [18].
The advantages of WV2 bands for land classification and especially for water object
classifications (to analyse their width, length, blur, depth, and determining the amount
of sediment in it) are given in detail on the website digitalglobe.com and in the articles
of Tarantino [26], Pueto et al. [22], Elshaarawy et al. [11]. New bands of WV2 satellite
(especially Coastal and NIR2) are now widely used in water objects extraction.
In addition, it is possible to create different indexes using these satellite image
layers. In different years by different scientists, different indexes for analysing land and
water objects were created [12, 19, 20, 21, 27]. Those indexes increase the accuracy of
the results [16]. The possibility of using these indexes for Landsat image analyses is one
of the advantages of the Landsat images using. In the Landsat and WV-2 image
2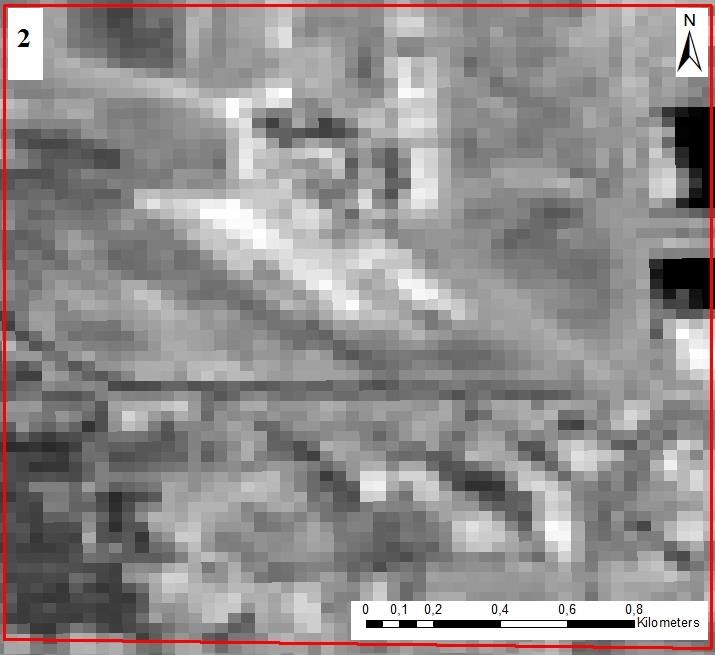
E3S Web of Conferences 264, 04007 (2021)                     https://doi.org/10.1051/e3sconf/202126404007
CONMECHYDRO - 2021

        analysis, some of these indexes will be used. David de la Fuente created 34 indexes
        using WV-2 data [10].
            WV-2 data was used by Leonhard and Ferrè [15] for extracting water objects; B. M.
        G. Ribeiro [23], Chen et al. [8], Rizvi and Mohan [24], Kokje and Gao [14], Khin et al.
        [13] and other scientists used it to create land cover maps, Naif Muidh Alsubaie [1] for
        bathymetry, Khin [13] for urban drainage system modeling. Nouri et al. created the
        NDVI index using WV 2 images [18]. Scientific research using WV-2 images gave
        positive results. Indeed, WV-2 is a hyperspectral satellite; these properties make it very
        useful to observe the processes and changes on land cover in the water sector and the
        environment [16].
            Field data experiments were used as very important data for validation of all image
        results. Besides the advantages of using all this data, it also has some limits. Knowing
        and taking into account these limits helps us to organise analysis correctly.
            As MODIS images are of low resolution, it is impossible to use them for high
        accuracy analysis. It influences its accuracy (Figure 1).

                                                  3
E3S Web of Conferences 264, 04007 (2021) https://doi.org/10.1051/e3sconf/202126404007
CONMECHYDRO - 2021
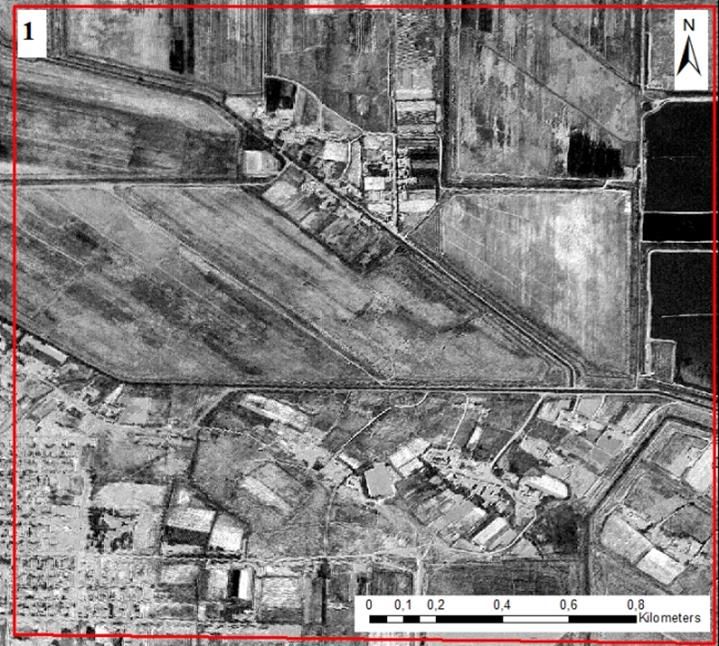
Fig. 1. Spatial resolution of different satellite images (1 is WorldView2 satellite image NDVI
value (12.09.2012); 2 is Landsat OLI TIRS satellite image NDVI value (10.09.2013); 3 is MODIS
TERRA satellite image NDVI value (13.09.2012))
4E3S Web of Conferences 264, 04007 (2021) https://doi.org/10.1051/e3sconf/202126404007
CONMECHYDRO - 2021
For this reason, it is not usable for detailed classification of the land surface, water
lines, urban areas and other classifications which require high quality.
Landsat Long term data is the most suitable dataset for long time land surface
change. But it also has some limits. Because of some technical problems, sometimes
Landsat satellites did not send information. And clouds also highly affects their images.
That is why more images are not usable, and the classification of objects smaller than 30
m shows few results in these images [6].
WV2 images are very important and provide many relevant data for all image
analysis. VHR of these images can increase the quality and possibilities of all analysis.
But usage of these images globally has not developed because of their costs. Square of
satellite image capturing is very little for global analysis. To do a global analysis, we
need 100 s of this image. That is why scientists use this data more often for correlation
or creating general methods. That is why it has not been used for regional and global
analysis.
A basic issue of RS imagery starts with the appearance of VHR imagery and flying
high resolution satellites to space. The problem was to analyse them with high accuracy.
By this period, middle and low resolution images were analysed with the PBIA method.
This analysis was realized according to the DN value of every pixel.
The high cost of RS images is another problem.
The analysis problem consists of joining the outer objects without data to segment
objects in MODIS imagery analysis. Because of this problem, we have to segment
images into pixel levels. After this, we can reach the classification of data objects into
separate groups. The results show that it is impossible to segment them in the highest
SP because we do not have separate data of the areas beforehand.
Another issue concerning MODIS images in OBIA analysis is creating homogeny
objects. Because spatial resolution of MODIS images are very low and do not save its
accuracy. Furthermore, there is no possibility of visual observations in homogeny
segmentation.
There appeared some difficulties in realizing the OBIA visual classification of
Landsat 1 and 3 satellite images. The first reason for this is the poor spatial resolution
(80m pixel). The second reason is fewer layers of bands; those images consist of only
NIR, Green and Red bands. The existing two NIR bands give the opportunity to
increase the accuracy of images and create the indexes in different ways (NDVI,
NDWI...). But the absence of a Blue band destroys the opportunity of identifying the
visual appearance of images. Because Blue, Green and Red bands combination gives us
visual appearance. Furthermore, poor resolution of images brings difficulties in
identifying the borders of objects and evaluating segment results. It is better to use
indexes in Landsat 1-3 images analysis [2,3,4].
By the Landsat 1 and 3 satellites, it was impossible to classify artificial area. The
reason for this is the low spatial and spectral resolution. However, in separating
artificial areas in Landsat 5-7-8, we faced a lot of other problems. This was the building
of roofs in the Sirdarya region, consisting of mud, cement, and slate. These roofs` DN
value in different bands is absolutely similar to the spectral indicators of cultivated
mineral and salinize soil. The DN indicators are similar to all spectral diapason. For this
reason, in most cases, it is observed that "Open grount" was classified as "Artificial
area" and vice versa.
If this happened in PBIA, it would be impossible to escape because of the same
pixel values of different objects. But, in OBIA, it is possible to separate them and
implement them in various procedures. The algorithm of "Select samples" in the panel
5E3S Web of Conferences 264, 04007 (2021) https://doi.org/10.1051/e3sconf/202126404007
CONMECHYDRO - 2021
of classification will help it. With the help of this algorithm, it is possible to classify
them separately and analyse them by the method of "Sample information".
The most common issue in the classification of VHR images to OBIA is separately
segmenting water and aquatic vegetation. Their DN is very similar, and the location of
water plants in water brings some difficulties in segmentation. Therefore, segmentation
parameters are evaluated close to the minimum. It is impossible to segment small canals
from water plants. For this reason, the smallest water objects usually join the vegetation
area during the classification [4].
The second problem is the classification of asphalt roads and water objects because
of their similar DN value. The feeding canals from rivers and their mud consistence is
the reason for this. It damages the accuracy of results.
2 Materials and Methods
Remote sensing consists of four resolutions, and satellite images differ according to
these resolutions [17]:
spatial,
spectral,
radiometric,
temporal.
We evaluated images according to those four elements using different satellite data.
We discussed the pros and cons. It is very important to choose the proper one from
those resolutions to increase the quality and speed of analysis.
Spatial resolution. The wrap ability of a land surface to one pixel of satellite
sensors is called spatial resolution. In some cases, the spatial resolution depends on the
orbit where it is flying.
Nowadays, much attention is paid to increasing the spatial resolution of satellite
sensors. Because improving the spatial resolutions will increase the quality of images.
Here are given examples about our used satellite sensors` resolutions (Table 1) [17]:
Table 1. Spatial resolution of used satellites
Satellite Spatial Resolution
MODIS 250 m
Landsat Multispector 30 m, Panchromatic 15 m
WorldView2 Multispector 2 m, Panchromatic 0.5 m
As the spatial resolution of satellites develops, the quality of images is better
(Navulur, 2006). It is obvious from the images that the smallest part of the image
contains pixels, the higher the quality of the image, it allows learning it in details (Fig.
1).
If we look at Figure 1, all were taken from one territory but different satellites. On
the first image, WV2 NDVI spatial resolution is 2m; we can see water objects, different
plants, settlements and even decorative gardens. The second image is Landsat NDVI; its
spatial resolution is 30 m. Here we can see objects that are higher than 30 meters, large
fields, pools but here; we cannot observe settlements and small water branches. The
third image is MODIS NDVI; its spatial resolution consists of 250 m. Here we can see
only differences of pixels, nothing else.
6E3S Web of Conferences 264, 04007 (2021) https://doi.org/10.1051/e3sconf/202126404007
CONMECHYDRO - 2021
However, we should keep in mind that improving satellites' spatial resolution may
decrease in their trapeze size (Figure 2).
Fig. 2. Difference trapeze of image camera of Landsat and WV2 scanner.
The above mentioned in Fig. 2 is demonstrated WV2 image shooting trapeze and
Landsat trapeze. Thus, we need several hundreds of trapeze images from the WV2
satellite for Landsat trapeze area research for our analysis. So, one MODIS scanner
trapeze equals the sum of hundreds of Landsat trapezes.
For this reason, no matter how good WV2 satellite images spatial resolutions are, it
is not possible to do RS analysis for large areas. Because one needs to buy a lot of
trapeze images, so it may bring big financial expenses for practical investigations.
Researchers usually buy WV2 images of a small territory to prevent this problem and
use them for other lower resolution images analysis validation.
According to spatial resolution, WV2 satellite sensor opportunities are found as the
clearest. But their small trapeze and high cost restrict its wide usage. For this reason, it
is better to use WV2 satellite images in validation, and it is recommended to implement
other cheap satellite images. However, their capture is a little smaller in comparison to
the first one.
The spectral resolution is a feature of the sensor that takes images in different
wavelengths of the specter. Nowadays, scientists use multi-spectral, super spectral and
hyperspectral sensor satellite images in modern remote sensing based on this feature. As
we know, different objects reflect rays differently in different wavelengths. Therefore,
to determine any feature of an object, it is necessary to learn its different ray –reflecting
feature in different specter lengths. For example, to use an image as a backdrop in GIS,
it is enough to have its image taken in specter 3 bands: Green, Blue, and Red (RGB).
7E3S Web of Conferences 264, 04007 (2021) https://doi.org/10.1051/e3sconf/202126404007
CONMECHYDRO - 2021
But, if we want to obtain more data from it, for example, to express impervious
surfaces, vegetation classification and other dates, we should use the near infrared band
(NIR) as well as the above-mentioned bands [17].
In this case, MODIS scanners` opportunities are not restricted. It takes images in 36
spectra in 0.4 µm to 14.4 µm wavelengths and transfers them to Earth. As mentioned
above, the more bands, the easier it is to identify an object. In this regard, Landsat 8
satellite scanner takes second place. Its spectral image shoots in 10 bands (coastal, blue,
green, red, NIR, SWIR1, SWIR2, Pan, TIR1, TIR2). If we account Cirus identifier of
water atoms as one band, Landsat 8 OLI TIRS band numbers will reach 11 bands
totally. The issue is that the Cirus band does not take images in light wavelength
diapason, but it works according to the light return function of flaying aerosols.
The last place is given to the WV2 satellite. These satellite sensors send us images in
9 spectral wavelengths. These bands are Coastal, Blue, Green, Yellow, Red, RedEdge,
NIR1, NIR2 and Pan.
Regarding this, MODIS satellite scanners are highly evaluated. But because of its
poor spatial resolution, it is not widely used. In our case, MODIS is recommended to
implement for analyzing large territories.
Radiometric resolution refers to the number of divisions of bit depth (for example,
255 for 8-bit, 65,536 for 16-bit, and so on) in data collected by a sensor
(support.esri.com). The radiometric resolution specifies how well the differences in
brightness in an image can be perceived; this is measured through the number of grey
value levels. The maximum number of values is defined by the number of bits (binary
numbers). An 8-bit representation has 256 grey values, a 16 bit (ERS satellites)
representation 65.536 grey values [29].
The advantage of a higher radiometric resolution is rather small - when comparing
LANDSAT-MSS (6 bits) and TM (8 bits), the improvement is in the order of 2-3% [6].
As much raises the radiometric resolution, so big is the difference between black and
white levels. Radiometric resolution of used sensors are the following (Table 2):
Table 2. Radiometric resolution of used sensors
Satellite Radiometric resolution (bits)
MODIS 12
Landsat 8
WV2 11
Though MODIS has the highest radiometry, it is less used. This is even though its
resolution is clear, one pixel captures of 250 m area. So, separate images of objects are
not available. In this case, WV2 satellite images are recommended. Because primarily it
shows the borders of the objects clearly and its volume is a little bit less than MODIS'.
In addition to spatial, spectral, and radiometric resolution, the concept of temporal
resolution is also important to consider in a remote sensing system. Thus, the actual
temporal resolution of a sensor depends on various factors, including the satellite/sensor
capabilities, the swath overlap, and latitude [30].
The ability to collect imagery of the same area of the Earth's surface at different
periods is one of the most important elements for applying remote sensing data. Spectral
characteristics of features may change over time, and these changes can be detected by
collecting and comparing multi-temporal imagery. The time factor in imaging is
important when [30]:
persistent clouds offer limited clear views of the Earth's surface (often in the tropics)
8E3S Web of Conferences 264, 04007 (2021) https://doi.org/10.1051/e3sconf/202126404007
CONMECHYDRO - 2021
short-lived phenomena (floods, oil slicks, etc.) need to be imaged
multi-temporal comparisons are required (e.g. the spread of a forest disease from
one year to the next)
the changing appearance of a feature over time can be used to distinguish it from
near-similar features (wheat/maize).
So this resolution is marked by the number of days of the satellite's return. This
helps to thoroughly research different processes in nature and ecological changes.
Regarding this, the satellites are evaluated as follows (Table 3).
Table 3. The temporal resolution of used sensors
Satellite Temporal resolution (days)
MODIS 16
Landsat 16
WV2 1
3 Results and Discussion
The opportunities of the WV2 satellite are greater than those of the rest of the satellites
for water extractions. Irrigation systems are small objects with small size; for this
reason, it is important to choose images taken with very high spatial resolution sensors
(in this case, WV-2 answers all the requirements. Spatial resolution of MODIS is 250-
1000 m/pixel, Landsat 15-30 m/pixel, Worldview-2 is 0,5-5 m/pixel. With the spectral
properties, WV-2 is the best satellite image; it has new spectral diapasons as yellow and
others, which gives the possibility to analyze water objects with high accuracy. With
other properties, WV-2 show its advantage.
4 Conclusions
According to the results, it can be recommended WV-2 to small objects classification.
Multiband of satellites gives the possibility to create different indexes. But about bands,
MODIS is more usable; it has 36 bands. But its spatial resolution is very low.
References
1. Alsubaie N.M. The Potential of Using Worldview-2 Imagery for Shallow Water
Depth Mapping. Diss. University of Calgary, 2012.
http://theses.ucalgary.ca/handle/11023/353 (accessed 10.07.2019). (2012).
2. Arifjanov A., M. Otaxonov, L. Samiev, Sh. Akmalov. Hydraulic calculation of
horizontal open drainages. E3S Web of Conferences 97, 05039 (2019). FORM-
2019 (a) (2019)
3. Arifjanov A., Sh. Akmalov, I. Akhmedov, D. Atakulov, Evaluation of deformation
procedure in waterbed of rivers. XII International Scientific Conference on
Agricultural Machinery Industry. IOP Conf. Series: Earth and Environmental
Science 403 (2019) 012155 (b). (2019)
4. Arifjanov A., L. Samiev, T. Apakhodjaeva, Sh. Akmalov. Distribution of river
sediment in channels. XII International Scientific Conference on Agricultural
Machinery Industry. IOP Conf. Series: Earth and Environmental Science 403
(2019) 012153 (c).(2019)
9E3S Web of Conferences 264, 04007 (2021) https://doi.org/10.1051/e3sconf/202126404007
CONMECHYDRO - 2021
5. Arifjanov A., T. Apakhodjaeva, Sh. Akmalov. Calculation of losses for
transpiration in water reservoirs with using new computer technologies.
International Conference on Information Science and Communication Technologies
(ICISCT). IEEE (2019) Pp 1-4 (d). (2019)
6. Arifjanov A., S. Akmalov, T. Apakhodjaeva, D. Tojikhodjaeva.. Comparison of
pixel to pixel and object-based image analysis with using WorldView-2 satellite
images of Yangiobod village of Syrdarya province. Inter Carto Inter GIS.
https://doi.org/10.35595/2414-9179-2020-2-26-313-321. (2020)
7. Arifjanov A.M., S.B Akmalov, L.N.Samiev.. Extraction of urban construction
development with using Landsat satellite images and geoinformation systems.
Journal of Water and Land Development. No. 48 (I–III) p. 65–69. DOI
10.24425/jwld.2021.136147. (2021).
8. Chen Z., Ning N., Zhang J. Urban Land Cover Classification Based on
WorldView-2 Image Data. In Geomatics for Integrated Water Resources
Management (GIWRM), International Symposium on. IEEE. 2012. pp. 1–5.
(2012).
9. Dao P.D., Liou Y. Object-Based Flood Mapping and Affected Rice Field
Estimation with Landsat 8 OLI and MODIS Data. Remote Sensing,. 7. (5). pp.
5077–97. (2015)
10. de la Fuente D., Suarez J., Yague J, Pedrazzani D. Potentiality of World-View 2
Data for Precision Agriculture. In Geoscience and Remote Sensing Symposium
(IGARSS), IEEE International. pp. 2825–28.(2013)
11. Elsharkawy A., Elhabiby M., El-Sheimy N. Improvement in the Detection of Land
Cover Classes Using the WorldView-2 Imagery. In. ASPRS. International
Scientific Conference 2012. pp. 19-23.(2012).
12. Jawak, S. D., Luis A.J. A. Rapid Extraction of Water Body Features from Antarctic
Coastal Oasis Using Very High-Resolution Satellite Remote Sensing Data. Aquatic
Procedia,. 4. pp. 125–32. (2015)
13. Khin M.L., Shaker A., Joksimovic D., and Yan W.Y. The Use of WorldView-2
Satellite Imagery to Model Urban Drainage System with Low Impact Development
(LID) Techniques. Geocarto International,.31. (1), pp. 92-108.(2016).
14. Kokje, A.A., Gao J. A. Simplified Approach for Classifying Urban Land Cover
Using Data Fusion. In Proceedings of the SIRC NZ Conference,.
https://otago.ourarchive.ac.nz/handle/10523/4240 (accessed 10.07.2019).(2013)
15. Leonhard, G., Ferrè N. Master in Space Applications for Early Warning and
Response to Emergencies Final Report. Accessed June 8,.
http://aulavirtual.ig.conae.gov.ar/moodle/pluginfile.php/513/mod_page/content/75/
Final%20report_Leonhard.pdf. (accessed 10.07.2019).( 2015).
16. Maglione P., Parente C., Vallario A. Coastline Extraction Using High Resolution
WorldView-2 Satellite Imagery. European Journal of Remote Sensing, 47, pp.685–
99.(2014).
17. Navulur, K. Multispectral Image Analysis Using the Object-Oriented Paradigm.
CRC Press. (2006).
18. Nouri, H., S. Beecham, Sh. Anderson, Nagler. P. High Spatial Resolution
WorldView-2 Imagery for Mapping NDVI and Its Relationship to Temporal Urban
Landscape Evapotranspiration Factors. Remote Sensing, 6. (1). pp. 580–602.
(2014)
19. Pengra B, Long J., Dahal D., Stehman S.V., Loveland T.R. A Global Reference
Database from Very High Resolution Commercial Satellite Data and Methodology
10E3S Web of Conferences 264, 04007 (2021) https://doi.org/10.1051/e3sconf/202126404007
CONMECHYDRO - 2021
for Application to Landsat Derived 30m Continuous Field Tree Cover Data.
Remote Sensing of Environment,165. pp. 234-248.(2015).
20. Platt R.V. Wildfire Hazard in the Home Ignition Zone, An Object-Oriented
Analysis Integrating LiDAR and VHR Satellite Imagery. Applied Geography, 51.
pp. 108–17. (2014).
21. Platt R.V. Wildfire Hazard in the Home Ignition Zone, An Object-Oriented
Analysis Integrating LiDAR and VHR Satellite Imagery. Applied Geography,51.
pp 108–17.(2014).
22. Puetz, A.M., Lee K., Olsen K. WorldView-2 Data Simulation and Analysis Results.
In Algorithms and Technologies for Multispectral, Hyperspectral, and Ultraspectral
Imagery XV, International Society for Optics and Photonics,pp. 73340U. (2009).
23. Ribeiro, B. M. G., and L. M. G. Fonseca. Evaluation of WorldView-2 Imagery for
Urban Land Cover Mapping Using the InterIMAGE System. In Proceedings of the
4th Conference on Geographic Object-Based Image Analysis GEOBIA, Rio de
Janeiro, Brasil,. pp. 206-210.(2012).
24. Rizvi, I.A., and B. K. Mohan. Object-Based Analysis of WorldView-2 Imagery of
Urban Areas. In Geoscience and Remote Sensing Symposium (IGARSS). IEEE
International.. pp 431–434 (2012).
25. Song, C., C.E. Woodcock, K.C. Seto, M.P. Lenney, and S.A. Macomber.
Classification and Change Detection Using Landsat TM Data, When and How to
Correct Atmospheric Effects? Remote Sensing of Environment. V. 75. (2). pp.
230–234, (2001).
26. Tarantino, C., F. Lovergine, G. Pasquariello, M. Adamo, P. Blonda, and V.
Tomaselli. 8-Band Image Data Processing of the Worldview-2 Satellite in a Wide
Area of Applications. Earth Observation.. pp. 137-152.(2012)
27. Wolf, A.F. Using Worldview-2 Vis-NIR Multispectral Imagery to Support Land
Mapping and Feature Extraction Using Normalized Difference Index Ratios.
In Algorithms and Technologies for Multispectral, Hyperspectral, and Ultraspectral
Imagery XVIII. 2012. (8390). Pp. 83900.(2012).
28. glovis.usgs.gov. Last acces 02.01.2020
29. www.seos-project.eu. Last acces: 02.01.2020
30. www.nrcan.gc.ca. Last acces: 02.01.2020
11You can also read