District of Summerland Corporate Energy and Emissions Management Plan March 2021 - District of Summerland | CEEMP
←
→
Page content transcription
If your browser does not render page correctly, please read the page content below
District of Summerland | CEEMP

    District of Summerland
Corporate Energy and Emissions
       Management Plan

           March 2021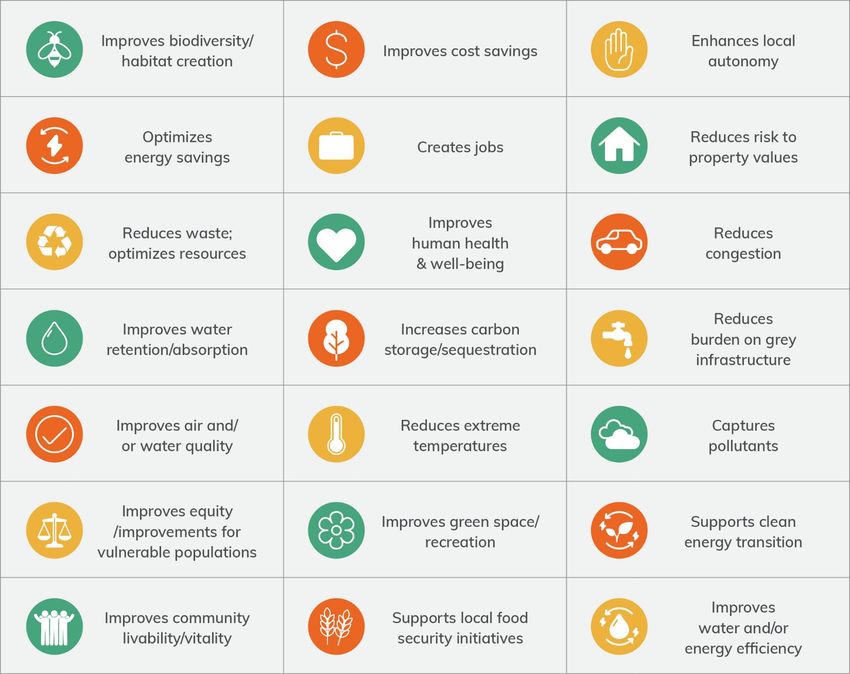
Summerland Corporate Energy and Emissions Management Plan
Acknowledgements
The Corporate Energy and Emissions Management Plan was developed by the District of Summerland in
collaboration with the Community Energy Association. Financial support was provided by FCM’s Municipalities
for Climate Innovation Program (MCIP), and FortisBC.
The District of Summerland would like to acknowledge the contributions of several people and organizations
that were involved in the development of this plan:
Members of the Summerland Corporate Climate Action Team.
Staff from numerous departments at the District of Summerland.
Researchers from the Integrated Climate Action for BC Communities Initiative (ICABCCI) through Simon
Fraser University’s ACT - Adaptation to Climate Change Team.
© 2021, The Corporation of the District of Summerland. All Rights Reserved. The preparation of this plan was
carried out with assistance from the Government of Canada and the Federation of Canadian Municipalities.
Notwithstanding this support, the views expressed are the personal views of the authors, and the Federation
of Canadian Municipalities and the Government of Canada accept no responsibility for them.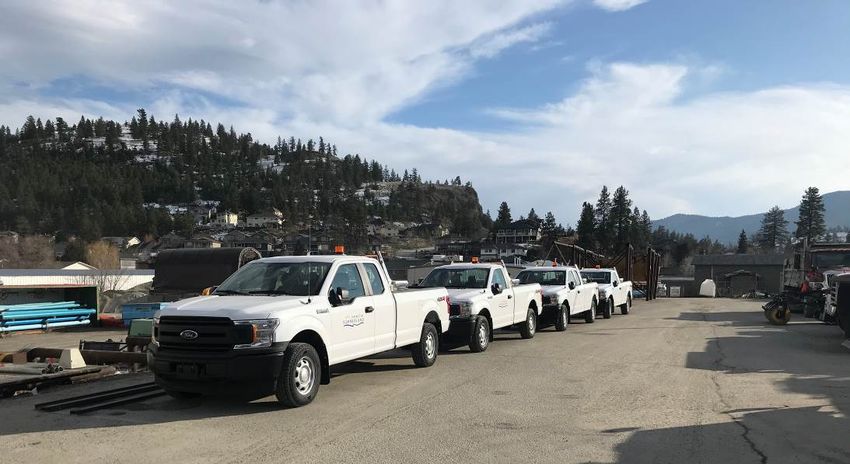
Summerland Corporate Energy and Emissions Management Plan

Table of Contents
Acknowledgements................................................................................................................................................................. 2
Table of Contents .................................................................................................................................................................... 3
List of Figures .......................................................................................................................................................................... 4
List of Tables ........................................................................................................................................................................... 4
Abbreviations .......................................................................................................................................................................... 5
Executive Summary ................................................................................................................................................................. 7
Introduction .......................................................................................................................................................................... 11
   Our Role in Climate Action, & Benefits ............................................................................................................................. 11
   FCM-ICLEI Partners for Climate Protection Program ........................................................................................................ 13
   Two Types of Inventory..................................................................................................................................................... 14
Summerland – A Leading Community................................................................................................................................... 16
Corporate Energy & Emissions Management Plan Development ........................................................................................ 18
Energy & Emissions – Where We Are Now ........................................................................................................................... 20
   Overview ........................................................................................................................................................................... 20
   Breakdown and Trends ..................................................................................................................................................... 21
   Business As Usual Projections ........................................................................................................................................... 26
Summerland Corporate GHG Reduction Target ................................................................................................................... 28
What We Can Do: Recommended Climate Actions .............................................................................................................. 29
What We Can Achieve .......................................................................................................................................................... 43
   Modelling Climate Actions ................................................................................................................................................ 43
Implementation for Success ................................................................................................................................................. 46
Monitoring and Evaluation ................................................................................................................................................... 47
Appendix A: Capital Budget Work Plan for Consolidated Existing Buildings and Fleet Actions ........................................... 50
Appendix B: Further Details on CARIP Inventory .................................................................................................................. 57
Appendix C: PCP Inventory and BAU .................................................................................................................................... 62
   Inventory ........................................................................................................................................................................... 62
   Business As Usual Projections ........................................................................................................................................... 66
Appendix D: Inventory and Modelling Assumptions ............................................................................................................ 68
Appendix E: Project Scoring Matrix ...................................................................................................................................... 71
Summerland Corporate Energy and Emissions Management Plan

List of Figures
Figure 1 – Co-benefits to climate action initiatives with a Low Carbon Resilience approach .............................................. 12
Figure 2 – PCP program milestones ...................................................................................................................................... 14
Figure 3 - Development of the Summerland Corporate Energy and Emissions Management Plan ..................................... 19
Figure 4 – District of Summerland energy consumption in GJ, by fuel in 2018 .................................................................... 21
Figure 5 - District of Summerland energy consumption in GJ, by fuel, 2012-2018 .............................................................. 22
Figure 6 - District of Summerland GHG emissions in tCO2e, by fuel, in 2018 ....................................................................... 22
Figure 7 - District of Summerland GHG emissions in tCO2e, by fuel, 2012-2018.................................................................. 23
Figure 8 - District of Summerland energy expenditures, by fuel, in 2018 ............................................................................ 23
Figure 9 - District of Summerland energy expenditures, by fuel, 2012-2018 ....................................................................... 24
Figure 10 - District of Summerland energy consumption, emissions, and energy expenditures by CARIP classification, in
2018 ...................................................................................................................................................................................... 25
Figure 11 – District of Summerland BAU energy consumption forecast to 2050 ................................................................. 27
Figure 12 – District of Summerland BAU GHG emissions forecast to 2050 .......................................................................... 27
Figure 13 – District of Summerland’s modelled GHG emissions from proposed climate actions by fuel ............................ 43
Figure 14 – GHG emissions savings by action, in 2025 ......................................................................................................... 44
Figure 15 – GHG emissions reductions from each action category in 2025 ......................................................................... 45
Figure 16 – Plan cost savings ................................................................................................................................................ 45
Figure 17 – Emissions by CARIP classification, 2012-2018.................................................................................................... 57
Figure 18 – Energy expenditures by CARIP classification, 2012-2018 .................................................................................. 59
Figure 19 – Top 5 CARIP inventory building energy users .................................................................................................... 60
Figure 20 – Top 5 CARIP inventory building GHG emitters ................................................................................................... 61
Figure 21 – District of Summerland PCP energy consumption in GJ, by fuel in 2018........................................................... 62
Figure 22 - District of Summerland PCP energy consumption in GJ, by fuel, 2012-2018 ..................................................... 63
Figure 23 - District of Summerland PCP GHG emissions in tCO2e, by fuel and waste, in 2018 ............................................ 63
Figure 24 - District of Summerland GHG emissions in tCO2e, by fuel, 2012-2018 ............................................................... 64
Figure 25 - District of Summerland energy expenditures, by PCP classification, in 2018 .................................................... 64
Figure 26 - District of Summerland PCP energy expenditures, by fuel, 2016-2018.............................................................. 65
Figure 27 - District of Summerland energy consumption, emissions, and energy expenditures by PCP classification, in
2018 ...................................................................................................................................................................................... 66
Figure 28 – District of Summerland BAU PCP energy consumption forecast to 2050.......................................................... 67
Figure 29 – District of Summerland BAU PCP GHG emissions forecast to 2050................................................................... 67

List of Tables
Table 1 – Summary of existing corporate climate actions .................................................................................................... 16
Table 2 – Breakdown of the District’s CARIP GHG emissions, by CARIP categories ............................................................. 20
Table 3 – New community and corporate GHG reduction targets ....................................................................................... 28
Table 4 – Climate actions – overview ................................................................................................................................... 31
Table 5 – High priority climate actions ................................................................................................................................. 33
Table 6 – Funding Sources BC Local Governments Typically Use for Climate Action ........................................................... 46
Table 7 – Ways Local Governments Can Institutionalize a Community Energy and Emissions Plan .................................... 47
Table 8 – Examples of Ways Summerland Can Monitor and Evaluate Corporate Climate Action Progress ........................ 48
Table 9 – Breakdown of the District’s PCP GHG emissions, by PCP categories .................................................................... 62
Table 10 – Emissions factors used for inventory years ......................................................................................................... 68
Summerland Corporate Energy and Emissions Management Plan                                           5

Abbreviations
BAU         Business as Usual
CAC         Climate Action Charter
CARIP       Climate Action Revenue Incentive Program (administered through the Province of BC)
CDD         Cooling Degree Day
CEA         Community Energy Association
CEEMP      Corporate Energy and Emissions Management Plan
CEERP      Community Energy and Emissions Reduction Plan
CO2         Carbon Dioxide
CO2e        Carbon Dioxide equivalent
CEEPA       Corporate Energy and Emissions Plan and Assessments: the 2010 plan created by the District
EV         Electric Vehicle
FCM        Federation of Canadian Municipalities
GHG        Greenhouse Gas (there are several different anthropogenic GHGs and they have different
           relative impacts. When tonnes of GHGs are stated in the document the standard practice of
           stating this in equivalent of tonnes of carbon dioxide is followed.)
GJ          Gigajoules (one of the standard measures of energy)
HDD        Heating Degree Day
HVAC       Heating Ventilation and Air Conditioning
ICABCCI    Integrated Climate Action for BC Communities Initiative (part of Simon Fraser University’s
           Adaptation to Climate Change Team)
IPCC        Intergovernmental Panel on Climate Change (an intergovernmental body of the United Nations
            dedicated to providing the world with an objective science-based view of climate change, its
            possible impacts, risks, and response options)
KPI         Key Performance Indicator
kWh         kilowatt hours (standard measure of energy, typically used with electricity)
LCR         Low Carbon Resilience. A step change to climate action that breaks down the silos between
            adaptation, mitigation and co-benefits, and mainstreams their consideration across municipal
            decision-making
LED         Light Emitting Diode
MCIP        Municipalities for Climate Innovation Program
OCP         Official Community Plan
PCP         FCM-ICLEI’s Partners for Climate Protection
PV          Photovoltaics (solar panels that generate electricity)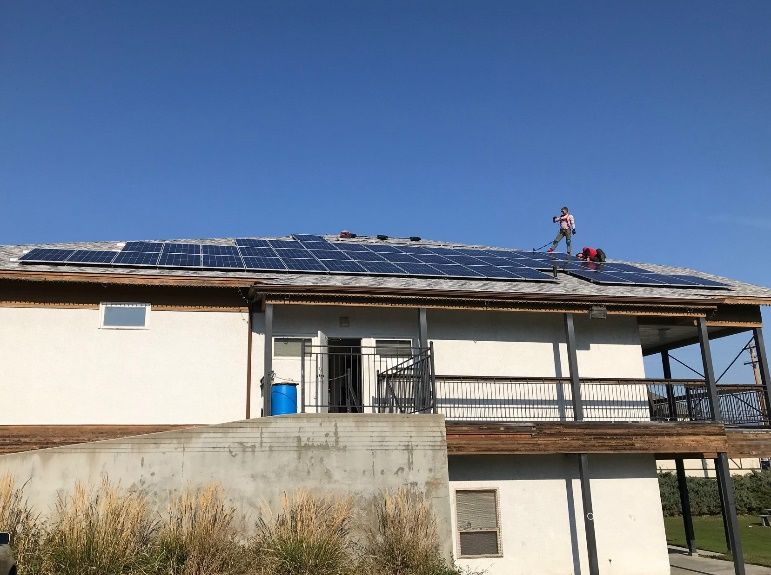
Summerland Corporate Energy and Emissions Management Plan                                        6

RCP         Representative Concentration Pathway (four RCPs were adopted by the IPCC as scenarios for
            the 2014 Fifth Assessment Report, depending on how much GHGs are emitted in future years)
SAEC        Sustainability / Alternative Energy Coordinator (a staff position at the District)
UBCM        Union of BC Municipalities
WWTP        Wastewater Treatment Plant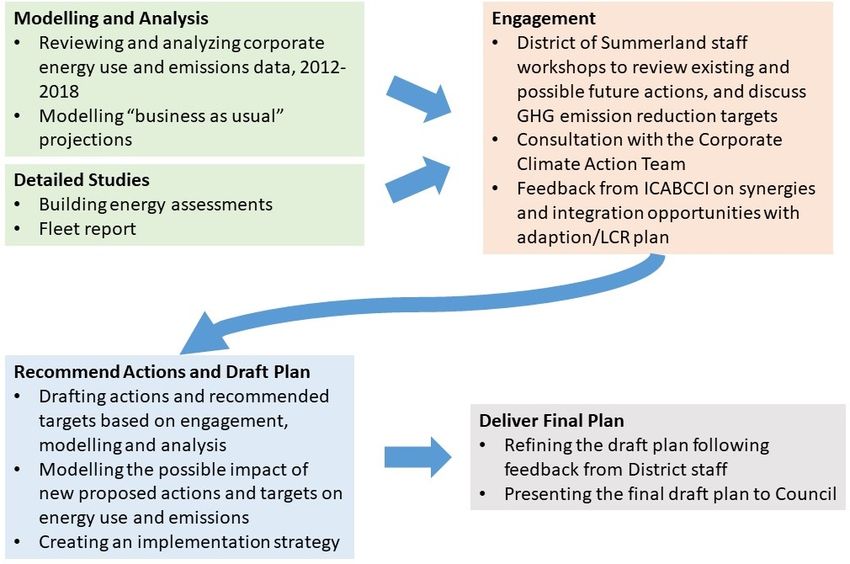
Summerland Corporate Energy and Emissions Management Plan 7
Executive Summary
Introduction
This Corporate Energy and Emissions Management Plan (CEEMP) is one piece of an in-progress low carbon
resilience (LCR) strategy for the District. The fulsome LCR strategy will include additional work on adaptation,
such as a risk and vulnerability assessment, and also includes the District’s Community Energy and Emissions
Reduction Plan (CEERP).
Part of a community’s role in dealing with climate action is to reduce emissions caused by its own buildings
and fleet. This helps it to meet its requirements as a signatory of the BC Climate Action Charter.
Reducing corporate GHG emissions offers many co-benefits, including:
• Increasing energy conservation and efficiency, reducing municipal energy costs, i.e., providing better
value for money to taxpayers
• Providing improved thermal regulation and quality of lighting, resulting in a more comfortable working
environment for staff and visitors
• Minimizing air pollution and improving air quality by transitioning to low or zero carbon fleets and
infrastructure
The District joined the FCM-ICLEI Partners for Climate Protection (PCP) program in 2017, and intends to use
the CEEMP and CEERP to help it progress through the program milestones. For Milestones 1-3, this report with
its appendices will be sufficient.
Despite this, the inventory in this Executive Summary and the body of this report the corporate inventory is
defined as it is according to the Province’s methodology in line with the Climate Action Revenue Incentive
Program (CARIP), and not as a corporate inventory is defined according to PCP.
Summerland leading the way
Although Summerland’s first Corporate Energy and Emissions Plan and Assessments, released in 2010, did not
identify specific GHG reduction targets, it did specify many actions with an overall goal of reducing emissions
by as much as possible. Together, with the allocation of CARIP funds for GHG emissions reduction initiatives,
the hiring of a full-time staff resource, and the establishment of the Corporate Climate Action Team, a
significant number of actions were able to be implemented:
• Buildings / lighting – LED streetlight conversions, numerous retrofits including HVAC upgrades
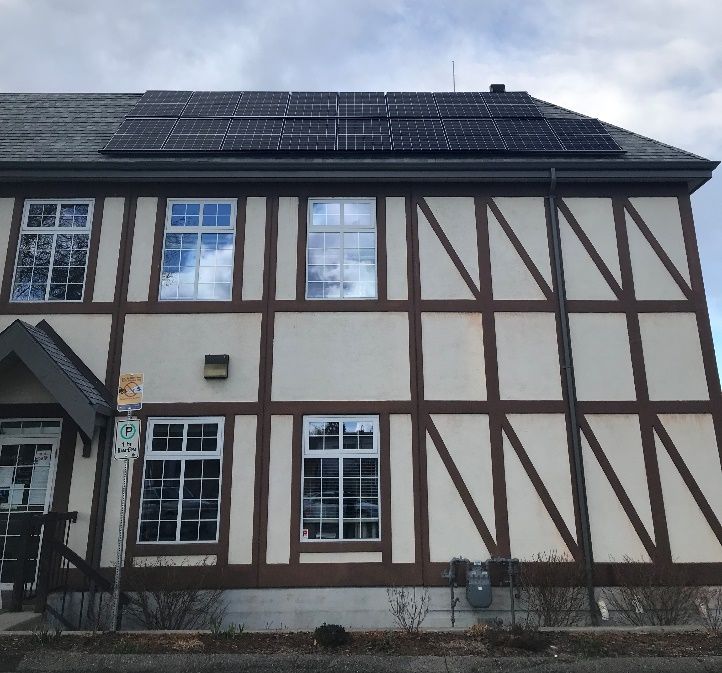
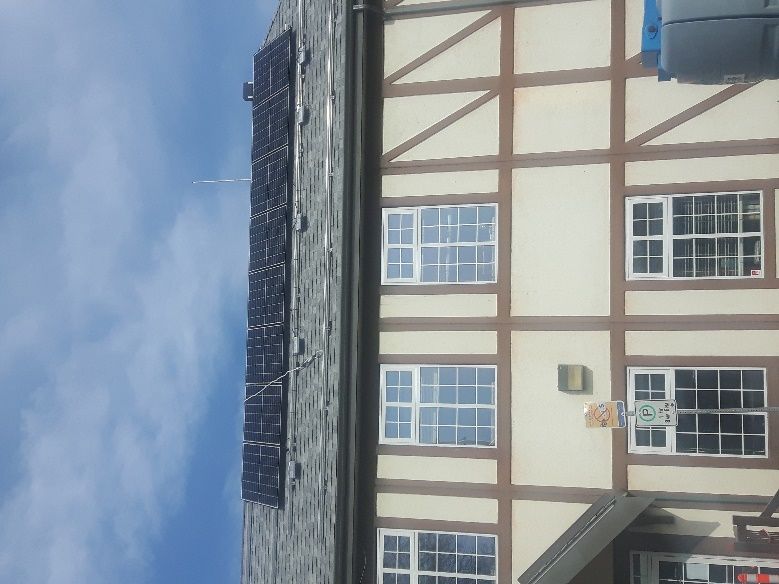
• Energy generation – solar photovoltaic systems on Arts & Cultural Centre and Municipal Hall, solar hot
water on Aquatic Centre, heat recovery/exchange plant between new RCMP building and Arena
• Transportation – replacing older vehicles with more fuel-efficient models, addition of electric battery-
back-ups, encouraging carpooling
• Solid waste reduction – encouraging recycling, and requiring that solid waste pickup contractor use
emissions reduction measures in operations
• Water / wastewater – updates to the District’s water conservation plan
• Institutionalisation – Green Revolving Fund established and 1st Canadian government body to join
Billion Dollar Green Challenge, Corporate Climate Action Team established
Summerland Corporate Energy and Emissions Management Plan                                                                8

Summerland’s current emissions

Summerland’s corporate emissions for 2012-2018 (available inventory years), using the CARIP inventory
method and split by CARIP categories, are as follows:

                                      CARIP Emissions by classification (tCO2e)
                                                  2012       2013      2014     2015        2016       2017      2018
    Administration and Governance                       67         63       65        52        63        85        80
    Arts, Recreation and Cultural Services             382        375      345       331       343       346       324
    Drinking, Storm and Waste Water                    196        220      162       168       154       178       189
    Fire Protection                                     39         38       34        33        35        44        38
    Roads and Traffic Operations                       242        265      208       248       253       295       261
    Solid Waste Collection, Transportation and
    Diversion                                          119        119      121       121       122       100        82
    Total                                            1,045      1,080      936       953       970     1,047       975

The largest area of emissions is Arts, Recreation and Cultural Services. The second largest is Roads and Traffic
Operations.
There has been no substantial overall variation from 2012 to 2018, although energy expenditures have
increased 20% from $1,000,000 in 2012 to $1,200,000 in 2018. This is despite the fact that overall energy
consumption stayed approximately flat – 2018 was 1% more than 2012.

Summerland’s corporate GHG reduction target

To achieve Corporate Milestone 2 under the PCP program, the District of Summerland has set a corporate
emissions reduction target in this plan. The new corporate targets, compared to the new community targets in
the CEERP, are:

                                             New community target         New corporate target in
                                             from CEERP, reduction          CEEMP, reduction
                                                from 2007 levels             from 2012 levels
                              2025                    18%                          25%
                             2030 *                   30%                          35%
                              2050                    80%                          80%

It is not possible to select 2007 as the baseline year for the corporate GHG target as well, because there is no
corporate data from that year. 2012 is the most recent accurate corporate year.

*
 2030 targets for the CEERP and CEEMP are milestone targets. They have not been adopted by Council, but will help to ensure that
the District is on the right track.
Summerland Corporate Energy and Emissions Management Plan                                                   9

What we can do: recommended climate actions

Based on staff consultation, best practices, and energy audits and a green fleet report completed for the
District, actions were identified to implement over the next five years and beyond within the following six
categories:
      1. New Buildings: Optimizing energy performance and lowering GHG emissions in new District buildings
         while addressing risks and building in resilience measures.
      2. Existing Buildings & Infrastructure: Retrofit existing District buildings and infrastructure to increase
         energy efficiency, reduce GHG emissions, and be resilient to the impacts of climate change. Prioritize
         retrofits of District buildings that can double as cooling and clean air shelters.
      3. Transportation: Improving fuel efficiency and reducing emissions of GHG’s and other pollutants from
         the District’s fleet, and shifting how District employees commute to work.
      4. Renewable Energy: Increasing the use of renewable energy that can be generated by the District.
      5. Adaptation: Ensuring that the District is prepared for coming climatic changes.
      6. Other – Institutionalisation, Waste & Water: Institutionalising the Corporate Plan, tackling Corporate
         waste creation, and water consumption.

               New Buildings          Existing                   Renewable
                                      Buildings &                Energy
                                      Infrastructure

               Transportation         Climate Adaptation         Other – Institutionalisation,
                                                                 Waste & Water

The full, detailed list of actions is outlined in the body of this plan. The specific timeframe for implementation,
department or position responsible for implementation, and possible partners or funding sources for each
action are also noted. Available resources and capacity of staff to implement were considered throughout the
process and the actions selected are intended to save the District time and money. The intention of the
CEEMP is to rethink business as usual, rather than creating new work projects.

What our actions can achieve, and reduction targets

As shown in the following figure, by implementing the CEEMP, total emissions are expected to decline by the
following percentages below 2012 emissions:
           •   29% by 2025
           •   37% by 3030
           •   60% by 2050
Summerland Corporate Energy and Emissions Management Plan                                                      10

As such, it should be possible to achieve the corporate target for 2025 through the actions outlined in this
plan. For 2030 and 2050, additional planning work and actions will be necessary.

Figure - District of Summerland’s modelled GHG emissions from proposed climate actions by fuel

                                                     1,200
                          GHG Emissions (tCO2e/yr)

                                                     1,000

                                                      800

                                                      600

                                                      400

                                                      200

                                                        -

                                                             Electricity   Natural Gas      Gasoline
                                                             Diesel        Propane          Corporate Target

The top two actions that will achieve the largest reductions in GHG emissions over the next six years, by a
considerable margin, are:

    •    EBI1: Complete energy improvements identified by building energy audits
    •    T1: Implement consolidated fleet actions
In addition to reducing emissions, the planned climate actions will lower energy expenditures compared to
BAU levels. The Plan is expected to save $230,000 a year in corporate energy-related costs by 2025 (including
O&M), just over 50% of which will be from electricity savings.
In five years, it is advisable to renew this plan as most actions should be completed by then. This will allow the
District to continue making progress towards its 2030 and 2050 corporate targets.
Summerland Corporate Energy and Emissions Management Plan 11
Introduction
Our Role in Climate Action, & Benefits
Climate action consists of both reducing emissions, or mitigation,
and preparing for the impacts of a changing climate, or adaptation.
This Corporate Energy and Emissions Management Plan is one piece
of an in-progress low carbon resilience (LCR) strategy for the District.
A more integrated climate action plan, or LCR plan, will include
additional work on adaptation, such as a risk and vulnerability
assessment, and the District’s Community Energy and Emissions
Reduction Plan (CEERP). This plan is focused on corporate emissions,
and ideally, over time will be linked with this other data in order to
build out an LCR plan. As such, key intersections with adaptation
have been highlighted throughout the report.
Part of the District’s role in dealing with climate action is to assess
risk to infrastructure, populations, and ecosystems and to ensure
that core services are maintained under diverse scenarios over time.
As a signatory to the BC Climate Action Charter (CAC), it also the
responsibility of the District to reduce emissions caused by its own
Solar photovoltaics (PV) being installed on
buildings and fleet, transitioning to zero carbon operations over Municipal Hall. Source: District of Summerland
time.
The BC Climate Action Charter is a voluntary agreement between the Province of BC, the Union of BC
Municipalities (UBCM), and each local government signatory.
The Charter was launched at the 2007 UBCM Convention. By signing it, local governments acknowledge
that they and the Provincial government have an important role in addressing climate change. Local
governments make commitments including to measure and report on their corporate emissions, and
progress towards becoming carbon neutral in their own operations. Summerland is a signatory to this
Charter, along with almost every local government in BC.
This Corporate Energy and Emissions Management Plan includes actions from buildings energy assessments
delivered by Building Energy Solutions and a report outlining strategies to reduce emissions in vehicles by
Richmond Sustainability Initiatives. These were funded by Federation of Canadian Municipalities’ (FCM)
Municipalities for Climate Innovation Program (MCIP) and provide critical data for assessing the District’s
emissions profiles and forecasts over time.
Reducing corporate GHG emissions has the following co-benefits:
• Increasing energy conservation and efficiency, reducing municipal energy costs, i.e., providing better
value for money to taxpayers
• Providing improved thermal regulation and quality of lighting, resulting in a more comfortable working
environment for staff and visitorsSummerland Corporate Energy and Emissions Management Plan 12
• Minimize air pollution and improve air quality by transitioning to low or zero carbon fleets and
infrastructure
• Leading by example to consider key risks and emissions reduction opportunities in assets, stimulates
community businesses and residents to do the same, leading to further GHG emission reductions and
enhanced climate adaptation in the community
• Contributing towards community economic development by leveraging infrastructure dollars and
other funds
Figure 1 – Co-benefits to climate action initiatives with a Low Carbon Resilience approach
Source: Integrated Climate Action for BC Communities Initiative, Adaptation to Climate Change Team, Simon Fraser University (2019)
The co-benefits of climate action also demonstrate the potential to leverage and streamline resources in ways
that help the community recover economically from COVID and other economic shocks. In addition, FederalSummerland Corporate Energy and Emissions Management Plan 13 and Provincial infrastructure funding can be leveraged, and thus improve on the business cases identified in this project. In 2010 the District of Summerland created a Corporate Plan, called Moving Towards Carbon Neutrality in Summerland / Corporate Energy and Emissions Plan and Assessments. Versions 1 and 2 of this plan were created in 2010, and version 3 in 2011. This Corporate Energy and Emissions Management Plan replaces this earlier plan. FCM-ICLEI Partners for Climate Protection Program The District joined the FCM-ICLEI Partners for Climate Protection (PCP) program in 2017, and intends to use the CEEMP and CEERP to help it progress through the program milestones. PCP is mitigation specific. What is the FCM-ICLEI Partners for Climate Protection (PCP)? PCP is a network of Canadian municipal governments that have committed to reducing GHGs and to acting on climate change. Since the program's inception in 1994, over 350 municipalities have joined PCP, making a public commitment to reduce GHG emissions. PCP membership covers all provinces and territories and accounts for more than 65 per cent of the Canadian population. The PCP program is managed and delivered by FCM and ICLEI Canada. They form the PCP Secretariat, which provides administrative and technical support, develops tools and resources, and delivers capacity building activities to support members in reducing local GHG emissions. The Secretariat also provides national recognition for member achievements. The program empowers municipalities to take action against climate change through a five-milestone process that guides members in creating GHG inventories, setting GHG reduction targets, developing local action plans, implementing actions to reduce emissions, and monitoring and reporting on results. Under PCP, there are five milestones for mitigation, under both corporate and community categories. The five milestones are set out in the following figure.
Summerland Corporate Energy and Emissions Management Plan 14
For Milestones 1-3, this report with its appendices will be
sufficient, although to achieve Milestone 2 the report will
need to be adopted by Council.
For Milestone 4, the District will need to implement actions
in this Corporate Plan, and report on this activity in its
annual CARIP reports. Then it will need to submit these
reports to FCM-ICLEI.
For Milestone 5, the District will need to create a document
with updated corporate inventory information (already
being collected for CARIP), and that quantifies the impacts of
Figure 2 – PCP program milestones
individual actions that have been conducted.
Source: PCP
Two Types of Inventory
There are two principal ways for a corporate inventory to be defined, following the CAC/CARIP methodology,
and following the PCP methodology. These are described in more detail in the following text box.
In this report, we will define Summerland’s corporate inventory according to CAC/CARIP, and in Appendix C:
PCP Inventory and BAU define it according to PCP. This is in part because as the District owns its local landfill,
it needs to be included in the PCP inventory, even though it accepts waste from the entire community. The
scale of the emissions from the landfill means that it dwarfs the emissions from other aspects of the corporate
inventory, making it difficult to identify trends in emissions that the District has much more direct control over
and which are able to be tracked with much greater precision.
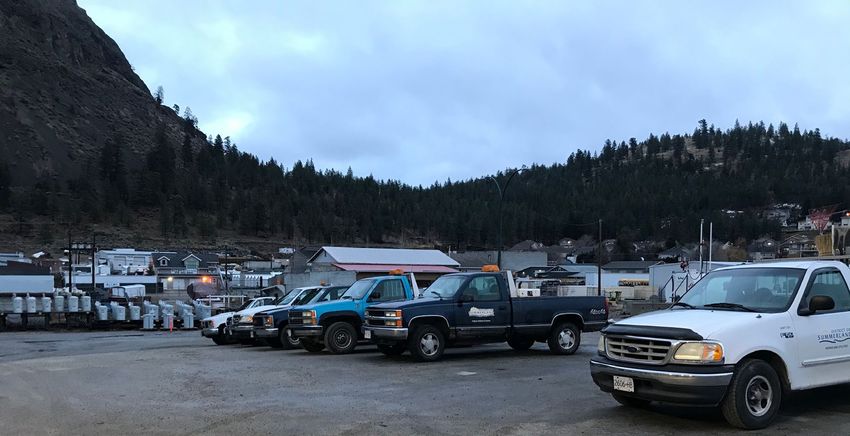
District of Summerland fleet vehicles. Source: District of SummerlandSummerland Corporate Energy and Emissions Management Plan 15
Corporate Reporting for Climate Action Charter vs. Partners for Climate Protection
BC Climate Action Charter (CAC) Reporting is the reporting conducted by local governments in BC each
year to receive their Climate Action Revenue Incentive Program (CARIP) grant. It includes fuels used
through the local governments’ traditional services including:
• Administration and Governance
• Drinking, Storm and Waste Water
• Solid Waste Collection, Transportation and Diversion
• Roads and Traffic Operations
• Arts, Recreation and Cultural Services
• Fire Protection
Note that policing (i.e. RCMP Buildings and Fleet) and emissions from solid waste (i.e. the landfill) are not
included in BC CAC reporting. Fuel from contracted services and from staff-owned vehicles on mileage for
District work are however included in fuel inventories. Any buildings that are leased out by the District or
paid by the operator would not be included in CAC inventories (e.g. restaurants in parkades or seniors
centres) as these do not fall under traditional services.
FCM’s Partners for Climate Protection (PCP) reporting is conducted by local governments if they wish to
hit PCP corporate milestone 1. It includes anything that is under “operational control” of the local
government. The inventory data needs to be organized into the following five “activity sectors”:
• Buildings (electricity, natural gas data) – includes buildings leased by the District; such as RCMP
• Street Lights (electricity)
• Water and Sewer (electricity, natural gas, propane) – including treatment plants
• Vehicle Fleet (gasoline and diesel) – includes contracted services providing traditional services
(contracts over $25,000); includes staff-owned vehicles used for District work
• Solid Waste – includes all the emissions from the landfill because this is owned by the District
Inventories for PCP must include energy consumed by everything a local government owns (e.g. buildings,
fleet) and/or operates including leased buildings and contracted services so long as the District has “full
authority to introduce and implement operating policies at the operation”. Unlike CAC reporting, PCP
reporting includes solid waste, and the District-owned RCMP building.
Note: Transit fleet is excluded from both because neither is it a traditional service nor is it under the
“operational control” of the District.Summerland Corporate Energy and Emissions Management Plan 16
Summerland – A Leading Community
Although Summerland’s first Corporate Energy and Emissions Plan and Assessments, released in 2010, did not
identify specific GHG targets, it did specify many actions with an overall goal of reducing emissions by as much
as possible. Together, with the annual CARIP reporting, the allocation of CARIP funds for GHG emissions
reduction initiatives, and more recently, the hiring of a full-time staff resource and the establishment of the
Corporate Climate Action Team, a significant number of actions were able to be implemented. These are
described in Table 1.
Table 1 – Summary of existing corporate climate actions
Buildings/lighting In 2019, buildings audits carried out on all buildings, as part of this Corporate Plan
update.
Previously:
• Conversion of streetlights to LED (all but decorative streetlights) – see text
box
• Works & Infrastructure office roof repairs to increase efficiency
• Christmas light upgrades to LED
• LED lights and REALice system in arena
• LED lights at Fire Dept. training facility, 6 truck bays and light tower of rescue
truck
• LED light conversion at curling rink
• Fluorescent lights at Municipal Hall upgraded to increase energy efficiency
• HVAC schedule at Municipal Hall adjusted to optimize comfort/energy
efficiency
• Heat reflective film added to some windows at Municipal Hall to lower HVAC
demands
• Replacement of HVAC systems at Municipal Hall
• Installed energy efficient lighting, ballasts, motion sensor switches at Works
& Infrastructure office
• Added occupancy sensors for arena’s exhaust fans
• Added fan coils for dressing room and arena building to eliminate 2 gas
furnaces operating 24/7
• New pool covers purchased to reduce heat loss and energy useSummerland Corporate Energy and Emissions Management Plan 17
Energy generation Solar photovoltaic (PV) systems
installed:
• Fall 2018 – Arts &
Cultural Centre. 50 panel.
17.25 kW
• Spring 2020 – Municipal
Hall. 17 panel. 5.4 kW
Other:
• New heat pump installed
at curling rink
• Heat recovery from ice
plant for new RCMP
building
5.4 kW solar PV array installed on Municipal Hall
Source: District of Summerland
Transportation In 2019, fleet report completed, as part of this Corporate Plan update.
Previously:
• Promoted carpooling and active transportation to staff
• Replaced some older vehicles with more fuel-efficient models
• Improved remote access for work stations for remote support functionality
(lowers transportation emissions from on-site repairs)
• Established fleet renewal reserve fund
• Council commitment for developing Fleet Management Policy for long-term
funding for efficient fleet replacement
• Installation/connection of RealIce system for Zamboni
• Electric Zamboni purchased
Solid waste • Paper and bottle recycling added to recreation facilities
reduction • Renewed contract for waste pickup, ensuring vendor uses emissions
reduction measures in operations
Water / wastewater • Wastewater Treatment Plant (WWTP) upgrades. Including boiler
infrastructure replacement/upgrade to higher efficiency
• Commissioned HVAC system at WWTP to lower energy requirements
• Installation of motion sensors at WWTP to lower light use
• Optimization of WWTP to reduce chemical use and equipment operationSummerland Corporate Energy and Emissions Management Plan 18
Institutionalisation The District of Summerland established the Climate Action Reserve Fund and
accompanying Climate Action – Funding The Reduction Of Greenhouse Gases &
Corporate Carbon Neutrality policy to voluntarily allocate 0.001% of the District’s
annual operating budget and all monies received through the CARIP to the Climate
Action operating budget. Unspent operating funds are then transferred annually into
the Climate Action Reserve Account. This reserve fund is used for programs and
strategies for greenhouse gas reductions and is targeted at corporate emissions. The
reserve fund is used at as an alternative to purchasing external carbon offsets.
The District’s Green Revolving Fund was established in 2018 after the District joined
the Billion Dollar Green Challenge (1st Canadian Government Body to join) in 2017.
The Corporate Climate Action Team was established in 2017.
Summerland’s LED streetlight conversion
One of the biggest changes in Summerland’s energy consumption has been the LED streetlight conversion.
By completing a change out of the cobra head style lights, total streetlight consumption reduced from
1,155,776 kWh per year to 408,361 kWh, a reduction of about 65%, or of $57,000 a year. The decorative
and floodlight fixtures present an opportunity for further savings. Because this conversion occurred in late
2018, it does not yet appear in the corporate inventory data within this plan.
Corporate Energy & Emissions Management Plan Development
In 2019, the District of Summerland, in collaboration with CEA, began the process of creating an updated
Corporate Energy and Emissions Management Plan. The planning process consisted of four main steps, as
illustrated in Figure 2.
In the workshops, staff reviewed the buildings actions using a scoring matrix, which is in Appendix E: Project
Scoring Matrix.Summerland Corporate Energy and Emissions Management Plan 19 Figure 3 - Development of the Summerland Corporate Energy and Emissions Management Plan Available resources and capacity of staff to implement were considered throughout the process and the actions selected are intended to save the District time and money, even though some may require up-front time and capital dollars. The intention of the CEEMP is to rethink business as usual, rather than creating new work projects. To that point, all of the CEEMP actions are related to Council priorities (i.e., Infrastructure Investment; Active Lifestyle; Good Governance), as well as the District’s forthcoming energy strategy, the Asset Management strategy, and corporate risk mitigation efforts.
Summerland Corporate Energy and Emissions Management Plan                                                          20

Energy & Emissions – Where We Are Now
Overview
An inventory is a compiled list of all the energy consumed, the money spent on energy, and the associated
greenhouse gas emissions created by the local government in their operations. This helps identify the best
opportunities for cost and emissions reductions.
This inventory describes the GHG emissions, energy consumption, and annual energy expenditures of all
corporate assets based on the CARIP inventory definition. Further details on the inventory are in Appendix B:
Further Details on CARIP Inventory, and assumptions are described in Appendix D: Inventory and Modelling
Assumptions.
The following table breaks down the District’s CARIP GHG emissions by the CARIP categories. The largest area
of emissions is Arts, Recreation and Cultural Services. The second largest is Roads and Traffic Operations.

Table 2 – Breakdown of the District’s CARIP GHG emissions, by CARIP categories

                                          CARIP Emissions by classification (tCO2e)
                                                      2012       2013      2014     2015     2016   2017    2018
 Administration and Governance                                 67          63    65    52      63      85     80

 Arts, Recreation and Cultural Services                       382         375    345   331    343     346    324
 Drinking, Storm and Waste Water                              196         220    162   168    154     178    189
 Fire Protection                                               39          38     34    33     35      44     38
 Roads and Traffic Operations                                 242         265    208   248    253     295    261
 Solid Waste Collection, Transportation and
 Diversion                                                   119         119     121   121    122     100     82
 Total                                                     1,045       1,080     936   953    970   1,047    975

There has been no substantial overall variation from 2012 to 2018, although some categories have increased
(Administration and Governance, Roads and Traffic Operations), some categories have decreased (Arts and
Recreation, Solid Waste Collection), and some are about the same (Drinking Storm and Waste Water, Fire
Protection).
Historically, the District of Summerland had used SMARTTool, a web based GHG emissions inventory and
reporting tool developed and maintained by Shared Services BC, providing a standardized approach to
calculating and reporting corporate greenhouse gas emissions. In 2020, SMARTTool was retired and replaced
with the Clean Government Reporting Tool (CGRT). Through SMARTTool/CGRT, Summerland tracks corporate
energy consumption and GHG emissions, and reports annually for the Provincial CARIP grant. CEA has used the
information provided through SMARTTool to compile the graphs and charts shown in this report.
Summerland Corporate Energy and Emissions Management Plan 21
Compared to the last full community inventory year of 2016 of just under 60,000 tCO2e, corporate GHG
emissions in that year were about 1.6% of the community total.*
Breakdown and Trends
The charts in this section show the summarized data for 2012 to 2018, for internal operations.
What is a GJ? What is a tonne (tCO2e) of GHG?
A gigajoule (one billion joules) is a measure A tonne of greenhouse gases (GHG’s) is the
of energy. One GJ is about the same energy amount created when we consume:
as:
• 385 litres of gasoline (about 10 fill-ups)
• Natural gas for 3-4 days of household use • $200 of natural gas (a month of winter
• 25-30 litres of diesel or gasoline heating)
• Two 20 lb propane tanks • Enough electricity for 8.5 average BC
• The electricity used by a typical house in Hydro homes for a year (93,700 kWh)
9 days
Figure 4 – District of Summerland energy consumption in GJ, by fuel in 2018
Diesel, 3,879,
10% Propane Gas,
301, 1%
Gasoline,
3,256, 8%
Natural Gas, Electricity,
8,926, 22% 23,281, 59%
In 2018 over half of the energy consumed by the District was electricity, and over a fifth was natural gas.
Diesel and gasoline made up most of the remainder, with just a small fraction of propane.
*
Based on the PCP corporate inventory methodology, which includes the landfill because that is owned by the District, corporate
GHG emissions were 4,131 tCO2e, or 5%.Summerland Corporate Energy and Emissions Management Plan 22
Figure 5 - District of Summerland energy consumption in GJ, by fuel, 2012-2018
50,000
45,000
40,000
35,000
Energy (GJ)
30,000
25,000
20,000
15,000
10,000
5,000
0
2012 2013 2014 2015 2016 2017 2018
Electricity Natural Gas Gasoline Diesel Propane Gas
Fuel consumption in District operations has been very consistent from 2012-2018. Note that in 2019 and 2020
the results of the major streetlight retrofit should become apparent as a reduction in electricity consumption.
The installation of the solar PV systems and other efficiency activities will also have an impact.
Figure 6 - District of Summerland GHG emissions in tCO2e, by fuel, in 2018
Propane Gas, 18, 2% Electricity, 17,
2%
Diesel, 274,
28%
Natural Gas,
445, 46%
Gasoline, 221,
22%
Gasoline & diesel are together responsible for about 50% of the District’s 2018 corporate GHG footprint, and
natural gas is responsible for 46%. In order to reduce GHG emissions, actions that tackle the consumption of
these fuels should have priority.Summerland Corporate Energy and Emissions Management Plan 23
Figure 7 - District of Summerland GHG emissions in tCO2e, by fuel, 2012-2018
1,200
1,000
Emissions(tCO2e) 800
600
400
200
0
2012 2013 2014 2015 2016 2017 2018
Electricity Natural Gas Gasoline Diesel Propane Gas
GHG emissions have been relatively consistent at around 1,000 tCO2e since 2012. There has been a reduction
in natural gas emissions as a result of a reduction in consumption (about 13% over this period), as well as a
reduction in diesel emissions (6%). But these have been partially offset by an increase in gasoline emissions
(18%). This increase provides an opportunity for improvement, particularly given the aging fleet’s existing
need of reinvestment and renewal.
Figure 8 - District of Summerland energy expenditures, by fuel, in 2018
Diesel, Propane Gas, $10,592 , 1%
$191,019 ,
16%
Gasoline,
$136,921 ,
12%
Natural Gas, Electricity,
$76,383 , 6% $778,122 ,
65%
Although electricity forms a small part of the carbon footprint because it has a low GHG intensity, it accounted
for the largest part of the District’s energy expenditures in 2018 because it has a high cost per unit of energy.Summerland Corporate Energy and Emissions Management Plan 24
Thus, work to reduce electricity usage is also very important as it will reduce operating costs, even though it
will have a low impact on the corporate GHG footprint.
The primary mobility fuels of diesel and gasoline are the next largest part of the energy expenditures at 28%.
Natural gas is relatively low at 6%.
Figure 9 - District of Summerland energy expenditures, by fuel, 2012-2018
$1,400,000
$1,200,000
$1,000,000
$800,000
$600,000
$400,000
$200,000
$-
2012 2013 2014 2015 2016 2017 2018
Electricity Natural Gas Gasoline Diesel Propane Gas
Energy costs for the District have risen about 20% from 2012 to 2018, with some fluctuations. The biggest
cause for the increase by far is electricity. All forms of energy increased in expenditures from 2012-2018, with
the exception of natural gas that has decreased.
Comparing Figure 5 and Figure 9, it is clear that while energy consumption has fluctuated, energy prices have
steadily risen. Overall energy consumption in 2018 is about 1% more than in 2012, yet energy expenditures
are about 20% more. The primary reason is that the cost per unit of energy for all forms of energy (except for
natural gas) have increased. The secondary reason is that consumption of electricity has risen relative to other
forms of energy (particularly at the expense of natural gas).
Rising energy costs present a risk to the District of Summerland, and need to be managed. High electricity
costs in particular further emphasize the need to tackle electricity consumption through efficiency measures
and the generation of local renewable electricity, despite the low GHG emission reductions.Summerland Corporate Energy and Emissions Management Plan 25
District of Summerland fleet vehicles. Source: District of Summerland
Figure 10 - District of Summerland energy consumption, emissions, and energy expenditures by CARIP classification, in 2018
45%
40%
35%
30%
25%
20%
15%
10%
5%
0%
Administration Arts, Recreation Drinking, Storm Fire Protection Roads and Traffic Solid Waste
and Governance and Cultural and Waste Water Operations Collection,
Services Transportation
GJ tCO2e $
and Diversion
The preceding chart shows what percentage of energy consumption, GHG emissions, and energy expenditures
can be attributed to each CARIP classification. Arts & recreation has the highest GHG emissions, but drinking,
storm and wastewater has the highest energy expenditures. High sources of GHG emissions and energy
expenditures can be readily identified.Summerland Corporate Energy and Emissions Management Plan 26
Business As Usual Projections
Business As Usual (BAU) projections for the District’s CARIP inventory are shown in this section. For
projections for the PCP inventory, see Appendix C: PCP Inventory and BAU.
What does Business as Usual mean?
Business as Usual, or BAU, is a way of describing what is estimated to happen if the District does not try
to reduce emissions going forward. A number of factors are taken into account, the same as with the
CEERP. Population growth and the subsequent growth in corporate assets is a very important
consideration. As the number of people increase in a community, more corporate assets are needed to
serve them. Other things that are taken into account include:
• Changing climate patterns, as warmer winters and hotter summers change the way that energy
is consumed in corporate buildings
• Impacts of policies already adopted by higher levels of government, such as:
o Renewable and low carbon fuel standards
o Vehicle emissions standards
o That progressive policies on electric vehicles will have an impact on District purchases
for gasoline vehicles, in particular the Zero Emissions Vehicles mandate (same
assumption as the CEERP)
o The greening of the BC Building Code (Step Code - progressive steps towards net zero
energy ready buildings by 2032)
If the District of Summerland conducts no special efficiency or conservation activities, and assuming that
future changes are proportional with population increase at 0.59% per year, then the District’s energy
consumption and emissions are forecast to change as shown in the following charts under a Business As Usual
(BAU) scenario. Energy consumption is forecast to increase by 15% from 2018 levels by 2050, and GHG
emissions are forecast to decrease by 9%.Summerland Corporate Energy and Emissions Management Plan 27
Figure 11 – District of Summerland BAU energy consumption forecast to 2050
50,000
45,000
40,000
35,000
30,000
25,000
20,000
15,000
10,000
5,000
-
Electricity (Total) Natural Gas Gasoline Diesel Propane Gas
Figure 12 – District of Summerland BAU GHG emissions forecast to 2050
1,200
1,000
800
600
400
200
-
Electricity (Total) Natural Gas Gasoline Diesel Propane Gas
It is difficult to predict these future increases, but it is clear that an increasing population will provide upward
pressure, while the policies from higher levels of government and some other factors will provide downward
pressure. It would be prudent for the District to also conduct its own measures to manage its energy
consumption and GHG emissions.
No BAU chart for energy expenditures has been created because of the considerable uncertainty around
predicting future energy prices.Summerland Corporate Energy and Emissions Management Plan 28
Summerland Corporate GHG Reduction Target
To achieve Corporate Milestone 2 under the PCP program, the District of Summerland has set a corporate
emissions reduction target as part of this process.
In its 2015 OCP, the District does not specify a corporate GHG reduction target, but it has a community GHG
reduction target of 33% below 2007 levels by 2020, and 80% by 2050. In the new CEERP, the community GHG
reduction target was updated. The new corporate target was arrived at in consultation with the Corporate
Climate Action Team, and it is based on the results of the building energy assessments and green fleet report.
See Table 3 for both new targets.
Table 3 – New community and corporate GHG reduction targets
New community target New corporate target in
from CEERP, CEEMP,
from 2007 levels from 2012 levels
2025 18% 25%
2030 * 30% 35%
2050 80% 80%
It is not possible to select 2007 as the baseline year for the corporate GHG target as well, because there is no
corporate data from that year. The most recent corporate data is from 2009 and 2010, in Moving Towards
Carbon Neutrality in Summerland / Corporate Energy and Emissions Plan and Assessments. However this data
is not being used for the baseline year in order to ensure a consistent corporate inventory methodology. †
Provincial & Federal Corporate GHG Emission Reduction Targets & Progress
The Provincial Government has been carbon neutral since 2010 through the purchase of offsets. From 2010-2018 it
has reduced its corporate GHG emissions by 8.5%.
The Federal Government has set targets of a 40% reduction by 2025, and at least 90% by 2050 while also being
carbon neutral with offsets. The Government also aspires towards an additional 10% reduction every 5 years from
2025. From 2005-2020 it has reduced its corporate GHG emissions by 34.6%.
*
2030 targets for the CEERP and CEEMP are milestone targets. They have not been adopted by Council, but will help to ensure that
the District is on the right track.
†
Note that in the 2010 Corporate report 2009 GHGs are 1,223 t CO2e and 2010 GHGs are 1,125 t CO2e.Summerland Corporate Energy and Emissions Management Plan 29
What We Can Do: Recommended
Climate Actions
Based on staff consultation and best practices, the
following actions were identified to implement over the
next five years and beyond.
Staff consultation took place in two sessions, in
November 2019 and January 2020. The first session took
an overview of the detailed buildings actions with a GHG
scoring matrix (see Appendix E: Project Scoring Matrix),
and teams of staff rated the actions. Then the SAEC took
the scoring and compiled it and used that data to
identify the priority buildings actions (see Appendix A:
17.25 kW solar PV array being installed on Arts & Cultural Centre
Capital Budget Work Plan for Consolidated Existing
Buildings and Fleet Actions). Source: District of Summerland
These actions fall under the following six categories:
1. New Buildings: Optimizing energy performance and lowering GHG emissions in new District buildings
while addressing risks and building in resilience measures.
• Opportunities exist to build climate resilient and low GHG new buildings.
2. Existing Buildings and Infrastructure: Retrofit existing District buildings and infrastructure to increase
energy efficiency, reduce GHG emissions, and be resilient to the impacts of climate change. Prioritize
retrofits of District buildings that can double as cooling and clean air shelters.
• Opportunities exist to ensure that retrofits occur with consideration of future climate
impacts including extreme heat, precipitation events, droughts, and air quality impacts
from wildfire smoke.
3. Transportation: Improving fuel efficiency and reducing emissions of GHG’s and other pollutants from
the District’s fleet, and shifting how District employees commute to work.
• Opportunities exist for the District to demonstrate best practice in Low Carbon
Resilience, save money, and reduce pollution.
4. Renewable Energy: Increasing the use of renewable energy that can be generated by the District.
• An opportunity exists to consider the District’s use of renewable energy as an energy
security action, particularly under potential impacts of extreme weather on the macro-
grid.
5. Adaptation: Ensuring that the District is prepared for coming climatic changes.
• Opportunities exist to help ensure that local government services can continue to be
reliably provided during the coming changes to climate that are expected, and are able t
provide additional services for community members such as cooling centres.
6. Other – Institutionalisation, Waste & Water: Institutionalising the Corporate Plan, tackling Corporate
waste creation and consumption, and water consumption.
• An opportunity exists to link to water and waste management that builds the District’s
resilience under projected climate change.You can also read