PREPARING DISTRIBUTION UTILITIES FOR THE FUTURE - UNLOCKING DEMAND-SIDE MANAGEMENT POTENTIAL - NREL
←
→
Page content transcription
If your browser does not render page correctly, please read the page content below

PREPARING DISTRIBUTION
 UTILITIES FOR THE FUTURE -
 UNLOCKING DEMAND-SIDE
 MANAGEMENT POTENTIAL
 A Novel Analytical Framework
GREENING THE GRID (GTG)
A Partnership Between USAID and Ministry of Power, Government of India

 Photo from iStock 508408184

JULY 2021
This report was produced by the National Renewable Energy Laboratory.
Prepared by

Disclaimer
This report is made possible by the support of the American People through the United States Agency for International Development
(USAID). The contents of this report are the sole responsibility of National Renewable Energy Laboratory and do not necessarily
reflect the views of USAID or the United States Government.

This work was supported by the U.S. Department of Energy under Contract No. DE-AC36-08GO28308 with Alliance for
Sustainable Energy, LLC, the Manager and Operator of the National Renewable Energy Laboratory.
PREPARING DISTRIBUTION
 UTILITIES FOR THE FUTURE -
 UNLOCKING DEMAND-SIDE
 MANAGEMENT POTENTIAL
 A Novel Analytical Framework

Authors
Killian McKenna, Kapil Duwadi, Shibani Ghosh, Adarsh Nagarajan and David Palchak,
National Renewable Energy Laboratory (NREL)

Abhishek Ranjan, Avinash Kumar, BSES Rajdhani Power Limited (BRPL)

Jayanta Bora, Krushna Kaant Gupta, USAID Greening the Grid (GTG)
Renewable Integration and Sustainable Energy (RISE) Initiative
Acknowledgments
This study was supported by the U.S. Agency for International Development as part of the Greening the Grid
Renewable Integration and Sustainable Energy (GTG-RISE) initiative, in collaboration with BSES Rajdhani
Power Ltd (BRPL). The authors thank the Hon. Director and Group CEO, BSES Delhi, Mr. Amal Sinha and the
team—including Abhishek Ranjan and Avinash Kumar—for their timely support and help regarding the data sets
used in this report as well as the GTG-RISE team for their valuable feedback and coordination.

 iii
List of Acronyms and Abbreviations
AC air conditioner
BRPL BSES Rajdhani Power Ltd.
BTM behind-the-meter
C&I commercial and industrial
DSM demand-side management
DR demand response
EFLCH Equivalent Full-Load Cooling Hours
EFFORT Effectiveness of Rate Structures for Enabling Demand Response
NREL National Renewable Energy Laboratory
PEM price elasticity matrix
PV photovoltaic
R rupee
TOD time-of-day
TOU time-of-use

 iv
Abstract
The balance of supply and demand in the power systems has traditionally been served solely through generation
and network capacity planning and operations. However, with increased requirements for flexibility due to the
uptake in variable renewable generation sources such as wind and solar, there is a need to increase demand-side
flexibility. In addition, there are increased communications and flexibility capabilities emerging on the demand-
side from the adoption of advanced metering infrastructures with smart meter deployment and intelligent loads
such as smart thermostats and schedulable white goods (e.g., dishwashers and washing machines). Unlocking
demand-side flexibility can bring system benefits, from peak load reduction bringing about generation capacity
and network upgrade deferral to reducing demand and bringing about more efficient utilization of generation and
network capacity.

Unlocking demand-side flexibility is an evolving process for utilities, and solutions must be tailored to each
specific consumer class. Demand-side management (DSM) is a broad set of tools that can include demand
response (DR) (both dispatchable and non-dispatchable), energy efficiency and distributed energy resources, and
consumer-sited resources. NREL, in collaboration with BRPL and GTG-RISE, examined the potential of DSM in
BRPL’s service territory, developing detailed information on consumer classes and willingness to participate in
DSM. The study developed modeling frameworks for load analysis and the analysis tools to assess the potential of
time-of-use (TOU) tariffs in motivating consumers to reduce their peak period energy consumption. The study
shows that BRPL consumers, specifically their domestic consumers, are willing to participate in DSM programs
and that TOU pricing can help BRPL reduce their peak demand and help unlock demand-side flexibility.

 v
Executive Summary
Context and Problem Description
The power system requires supply and demand to be balanced at all times; otherwise, system voltage and
frequency challenges can occur. Until few years ago, it was common to treat demand as an inflexible resource and
to adjust supply to match demand at any given time. In recent years, unlocking demand-side flexibility has been a
topic of interest, with strong potential, all over the world. Enabling demand-side flexibility can bring about utility
and consumer cost benefits such as providing effective peak load reduction and avoiding the use of expensive
peaking generation. Three primary stakeholders can be identified for DSM to be an effective mechanism—
consumers who enable DSM, utilities that encourage the consumers, and regulatory authorities who provide
directions for utilities. This research work is designed to enrich the knowledge base for these three stakeholders as
the study addresses some of germinal questions about DSM and its implementation.

As energy consumption in the Indian grid is expected to grow steadily, triggered by electrification, DSM is
recognized as an effective mechanism to promote energy efficiency. For instance, the recently published Draft
National Electricity Policy 2021 issued by Ministry of Power emphasizes the importance of energy conservation
and DSM. Converting these policy initiatives to regulatory directives, nodal stakeholders such as State Electricity
Regulatory Commissions can contribute to making DSM a reality. Along similar lines, Rajasthan Electricity
Regulatory Commission recently issued directives to utilities to implement the policy provision on energy storage
purchase obligation (in MW) for up to 5% of the overall renewable purchase obligation target. With this
Rajasthan Electricity Regulatory Commission order, utilities can specify storage requirements (minimum rated
capacity to be 50% of project capacity) with solar/wind capacity bidding on a pilot basis. Similar actions for DSM
can prescribe energy efficiency targets for distribution companies and help them attain those targets by
implementing utility-led DSM programs.

Before regulatory directives are put forward from policy initiatives, sufficient evidence is needed to determine the
value add from new technologies. This work is designed to provide this required evidence that can help regulatory
authorities sanction applications of DSM and foster growth of distributed energy resources. In this work, we focus
on the first step in unlocking flexible demand for all the primary stakeholders involved in DSM programs. NREL,
in collaboration with BRPL and Greening the Grid RISE, studied the potential of DSM in Delhi, India, for this
study. The research team addressed the DSM design problem and presented their findings in the form of two
major research components: i) tool development for evaluating DSM as a resource in utilities’ planning processes,
and ii) a survey component to understand possible consumer participation in designing an effective DSM
program.

The first component is a tool/analysis framework developed by NREL for evaluating optimal TOU tariffs called
EFFORT. This open-source tool uses a scalable analysis framework that utilities and distribution companies can
use for their TOU rate planning. The potential of time-varying rate structures is investigated under this framework
by conducting load analysis. EFFORT utilizes insights from the survey on BRPL consumers to output the optimal
ratio of peak to off-peak price points.

For the second component, BRPL conducted surveys among a select set of consumers. This survey was critical in
understanding the importance of consumer classes under their service territory and how they can contribute to
managing the system peak. One of the important aspects of this survey was unveiling how consumers are
adopting new technologies such as solar, energy storage, and electric vehicles (EVs); DSM programs can make
the best of these technologies. While rooftop solar can play a cardinal role in changing the grid landscape with
grid-edge generation, EVs, on the other hand, denote a new class of consumer category with unique
characteristics, able to reshape traditional demand profiles. There is a need for a suitable time-of-day (TOD)/TOU
regime for EVs to integrate renewable energy further for EV charging and optimize the distribution network
usage.

 vi
This report focuses on the first step in unlocking flexible demand for utilities and consumers in Delhi. NREL, in
collaboration with BRPL and the Greening the Grid RISE team, studied the potential of DSM in Delhi. The work
described in this report aims at developing a scalable framework that the utilities and distribution companies can
utilize to evaluate DSM as a resource in their planning processes. The potential of time-varying rate structures
was investigated by conducting load analysis, surveying BRPL consumers, and performing optimization and
sensitivity analysis.

Methodology

Data analysis, consumer surveys and analysis, and optimization techniques were used to evaluate the potential of
DSM for BRPL and their consumers. The methodology used to assess the DSM potential involved four steps as
listed below:

 • Assessing the overall consumer class breakdown in BRPL’s service territory

 • Establishing the energy consumption end-uses for each class

 • Evaluating consumer class willingness and ability to participate in designing a DSM program

 • Quantifying the overall potential benefit to BRPL and their consumers

The methodology ensured that our steps to identify the potential for DSM in BRPL were correct. The purpose of
this research study was achieved performing the actionable tasks listed below:

 • Load analysis: BRPL’s system and consumer level load data were analyzed to investigate the
 characteristics of peak load and the key consumer classes (e.g., domestic, commercial, industrial) that
 contribute to overall system energy consumption and peak demand.

 • Survey construction and surveying consumers: A survey was constructed and circulated to domestic,
 commercial, and industrial consumers to gather socioeconomic data and to assess their energy
 consumption patterns, motivation, and willingness to participate in DSM programs and their attitudes
 toward emerging demand-side technologies and distributed energy resources. Four hundred and thirteen
 residential and 318 commercial and industrial (C&I) consumers were surveyed from June to October
 2020.

 • Survey analysis: The survey results were analyzed to understand consumption patterns and assess the
 key motivations and consumer groups willing to participate in DSM and what mechanisms they would
 adopt to respond to DSM programs.

 • TOU modeling optimization and potential: A TOU modeling and optimization analysis tool was
 created to aid in modeling TOU to obtain the maximum peak demand reduction and cost savings
 potential. A sensitivity analysis was run to obtain a sweep of results for different levels of consumer price
 responsiveness.

 vii
Notable Outcomes

There has been an increased evolution of the role of the demand side in power systems over the past decades in
terms of increased load responsiveness, increased energy efficiency, and adoption of behind-the-meter (BTM)
technologies such as rooftop solar and battery technologies. DSM has been shown to deliver cost and efficiency
benefits both to the consumer and to utilities operating and managing the grid. Successful implementation of
DSM involves assessing the load sector breakdown and potential for efficiency and response from consumers in a
utility’s service area and tying the load potential to DSM schemes that will produce a successful response.

The results presented in this report establish the positive outcomes from tariff-based DSM programs as they can
bring cost benefits to both consumers and the utility, BRPL in this case. The following bulleted list provides a
brief snapshot into notable outcomes from this study.

 • Quantifying need for and value from peak load reduction: Peak load results in cost capacity and
 energy cost inefficiencies that are passed on to BRPL and their consumers. One percent of network and
 generation capacity (approximately 30 MW) is only required 0.01% (less than 1 hour) of the year, and 2%
 of capacity (approximately 60 MW) is only required 0.05% of the year. Reducing peak demand could
 bring capacity savings, and BRPL estimates annual savings of Rs 2 crore (rupees) per MW peak load
 reduction. Peak demand also has a positive correlation with higher electricity prices; for every MW
 increase in load, the energy price per MWh on average increases by 1 rupee, so leveling the load could
 reduce the cost of providing energy to BRPL consumers.

 • Targeting domestic consumers for reducing peak demand is key: Domestic consumers account for
 approximately 87% of the overall consumer base and 67% of annual energy consumption. C&I
 consumers account for 13% of consumers and 31% of annual energy consumption. Average domestic
 consumption during the top 10% of loads hour is 58% of its peak, whereas for industrial l consumers it is
 38% and for commercial consumers, 26%. This shows that domestic consumers are the key driver behind
 BRPL peak demand. TOU pricing schemes are currently in place for BRPL non-domestic consumers.
 However, non-domestic consumers are not the main driver of peak demand, and the survey shows they
 are also less willing to participate in DR than domestic consumers.

 • Domestic consumers are willing to participate in DR: Domestic consumers are willing to participate in
 DSM measures, with more than 95% of consumers interested in reducing energy consumption for both
 environmental reasons and to achieve bill savings, and over 95% of respondents interested in further
 transitioning to energy efficient lighting. More than 75% of consumers were willing to stop doing laundry
 during evening hours and increase AC temperature during summer evenings.

 • C&I consumers are more willing to participate in energy efficiency than DR: C&I consumers are
 more willing to participate in energy efficiency than in DSM measures that involve changing
 consumption patterns. More than 80% of consumers are willing to reduce energy consumption to protect
 the environment and believe they should be more active in using energy efficient appliances, and more
 than 77% of consumers are interested in energy efficiency to reduce their electricity bill, whereas only
 58% of consumers were willing to modify cooling use during on-peak hours and only 22% of consumers
 were willing to change the operation of some business activities.

 • BRPL’s journey towards enabling DSM: BRPL load has two distinct seasonal shapes with dual
 peaking in summer, with peak load of 2,972 MW in July of 2018, and single peak in winter, in January
 (1,824 MW in 2019). The minimum load for 2019 of 532 MW, occurred in February. This study found
 that a two-season TOU price structure had the opportunity to reduce summer and winter peak load. In
 summer (April to October) a two-peak tariff was found to have potential, as load was found to peak
 between the hours of 15:00 and 17:00 and 22:00 and 01:00, and a single on-peak tariff in winter

 viii

(November to March) between the hours of 09:00 and 12:00 was found to have potential. This study
 estimates that BRPL has the potential to reduce summer peak demand by 2% (58 MW) and winter peak
 demand by 3.8% (70 MW). This could bring reduced capacity and energy costs to BRPL and their
 consumers. BRPL should further investigate rolling out a TOU tariff for its consumers and examine
 introducing smart meters for domestic consumers, providing information on smart appliances (e.g., smart
 thermostats and schedulable white goods) and energy efficiency measures to consumers.

• Reusable Framework for Assessing Demand-Side Potential (EFFORT): EFFORT is
 an analysis framework developed in Python for modeling and designing TOU tariffs using optimization.
 It uses historical time series system-level load data, cost and capacity data of dispatchable generators,
 and consumer price responsiveness to compute optimal on-peak and off-peak price ratios. The utility can
 customize the level of consumer price responsiveness based on surveyed information and pricing trails to
 better reflect the response levels of their consumers. In addition to this, independent modules are also
 included to generate realistic on-peak hours by analyzing utility load profile data. Utilities can also
 compute seasonal TOU by grouping year-long load profiles into multiple seasons to specifically target
 seasonal changes in peak load consumption patterns. Scenario analysis can be leveraged in the absence of
 data required for computing realistic consumer price responsiveness.

 ix
Table of Contents
1 Introduction ........................................................................................................................................................ 1
 1.1 DSM Review ............................................................................................................................................... 1
 1.1.1 Price Plans for Achieving Demand Response ................................................................... 3
 1.2 Assessing the DSM Potential for BRPL ...................................................................................................... 5
2 Demand-Side Load Profile Analysis................................................................................................................. 7
 2.1 Seasonal Energy Consumption Pattern ........................................................................................................ 7
 2.2 Load Sector Analysis ................................................................................................................................... 8
 2.3 Peak Load Analysis ................................................................................................................................... 12
 2.4 Relation Between Load and Price .............................................................................................................. 17
3 BRPL Demand-Side Survey Analysis ............................................................................................................ 18
 3.1 Domestic Survey Analysis ......................................................................................................................... 18
 3.1.1 Profile of Respondents ...................................................................................................... 18
 3.1.2 Equipment Ownership ....................................................................................................... 19
 3.1.3 Usage of Cooling and Heating Load ................................................................................. 20
 3.1.4 Analysis of Monthly Energy Consumption ....................................................................... 21
 3.1.5 Consumption Pattern of Consumers .................................................................................. 22
 3.1.6 Estimating the Consumption of AC .................................................................................. 23
 3.1.7 Understanding the Willingness of Domestic Consumers to Participate in DSM Programs26
 3.1.8 Affinity for New Technologies ......................................................................................... 27
 3.2 C&I Consumer Survey Analysis................................................................................................................ 28
 3.2.1 Consumption Profile.......................................................................................................... 29
 3.2.2 Equipment Ownership and Usage ..................................................................................... 30
 3.2.3 Understanding the Willingness of C&I Consumers to Participate in DSM Programs ...... 31
 3.3 Notable Mentions From the Consumer Survey ......................................................................................... 34
4 TOU Pricing Modeling and Analysis: Potential for Consumers And The Utility ...................................... 35
 4.1 Technical Terminology .............................................................................................................................. 36
 4.2 Design of TOU Tariff—Analysis and Optimization ................................................................................. 38
 4.2.1 Price Elasticity Matrix ....................................................................................................... 39
 4.2.2 Optimization Model .......................................................................................................... 39
 4.2.3 Seasons and On-Peak Hour Design ................................................................................... 40
 4.3 Optimization Results.................................................................................................................................. 41
 4.4 TOU Challenges and Opportunities to Deployment .................................................................................. 44
 4.5 TOU Rate for Different Categories of Consumers .................................................................................... 44
5 Conclusions ....................................................................................................................................................... 45
6 Notable Outcomes of This Study .................................................................................................................... 46
 6.1 BRPL Has Dual Peaking Summer Demand............................................................................................... 46
 6.2 Domestic Consumers Are Willing to Participate in DR ............................................................................ 46
 6.3 C&I Consumers Are More Willing to Participate in Energy Efficiency Than in Demand Response ....... 47
 6.4 TOU Has the Potential to Reduce Peak Demand....................................................................................... 47
 6.5 Utilities Should Further Investigate Steps to TOU Rollout ....................................................................... 48
 6.6 DSM Beyond TOU .................................................................................................................................... 48
Appendix A. Optimization Initialization .............................................................................................................. 51
Appendix B. Key Survey Results .......................................................................................................................... 52
Appendix C. Annual Load Duration Data ........................................................................................................... 63

 x
List of Figures
Figure 1. BRPL’s service territory map in Delhi and neighboring utilities................................................................1
Figure 2. Classification of DSM strategies.................................................................................................................3
Figure 3. Evolution of price plans to motivate flexible demand, smart charging, adoption of solar PV, and use of
energy storage for self-consumption and energy shifting...........................................................................................4
Figure 4. Utility cost components and methods of recovery through different retail price components ...................5
Figure 5. Classification of DSM strategies.................................................................................................................6
Figure 6. Seasonal energy consumption of BRPL system-level load profile .............................................................8
Figure 7. Number of consumers and annual energy consumption (for 2018) for three consumer classes in
percentage ...................................................................................................................................................................8
Figure 8. Breakdown of domestic consumers: number of consumers on the left and total energy consumption on
the right.......................................................................................................................................................................9
Figure 9. Breakdown of non-domestic consumers: number of consumers on the left and total energy consumption
on the right..................................................................................................................................................................9
Figure 10. Breakdown of industrial consumers: number of consumers on the left and total energy consumption on
the right.....................................................................................................................................................................10
Figure 11. Domestic consumers’ daily average profile for all months (data from distribution transformer serving
apartments) ...............................................................................................................................................................10
Figure 12. Box plot of summer load by consumer category for three consumer groups..........................................11
Figure 13. Box plot of winter load by consumer category for three consumer groups ............................................11
Figure 14. Non-domestic consumer daily average profile for all months (data from distribution transformer
serving market complex) ..........................................................................................................................................12
Figure 15. Industrial consumer daily average profile for all months .......................................................................12
Figure 16. Time series BRPL system-level load profile for year 2018-19 ...............................................................13
Figure 17. Average daily load profile for all months of 2018 ..................................................................................13
Figure 18. Percentage of top 10% load hours from monthly load duration curve ....................................................15
Figure 19. Percentage of bottom 10% load hours from monthly load duration curve .............................................16
Figure 20. Load duration curve for BRPL system....................................................................................................17
Figure 21. Relation between load and price .............................................................................................................17
Figure 22. Age distribution of respondents ..............................................................................................................18
Figure 23. Ownership of major equipment...............................................................................................................19
Figure 24. Usage of kitchen appliances ....................................................................................................................19
Figure 25. Geyser usage pattern among the respondents .........................................................................................21
Figure 26. Average monthly consumption of sample...............................................................................................21
Figure 27. Total energy consumption across the year for surveyed consumers .......................................................22
Figure 28. Box plot of domestic consumers’ energy consumption per month (kWh)..............................................23
Figure 29. Willingness of consumers to participate in DSM programs ...................................................................26
Figure 30. Willingness to change equipment operation during off-peak hours........................................................27
Figure 31. Expected compensation for change in usage pattern ..............................................................................27
Figure 32. Square feet distribution of survey consumers’ premises.........................................................................28
Figure 32. Average monthly consumption by C&I consumers ................................................................................29
Figure 33. Average monthly consumption (kVAh) of C&I consumers ...................................................................29
Figure 34. Temperature control preferences of respondents ....................................................................................30
Figure 35. C&I awareness and sentiment toward DSM and energy efficiency........................................................31
Figure 36. Actions to reduce environmental impact and reduce energy consumption .............................................32

 xi
Figure 37. Likelihood of participation in off-peak hour DSM .................................................................................33
Figure 38. Likelihood of participation in peak-hour DSM .......................................................................................33
Figure 39. Illustration for two-tier TOU tariff ..........................................................................................................35
Figure 40. Relation between price and electricity demand.......................................................................................35
Figure 41. Different types of loads and energy shifting; anticipating and postponing; flexible and inflexible
consumers .................................................................................................................................................................36
Figure 42. TOU load response for different elasticity magnitudes ..........................................................................37
Figure 43. TOU load response for different response window ................................................................................37
Figure 44. Illustration for price elasticity matrix ......................................................................................................39
Figure 45. Time series load profile and how to choose on-peak hours ....................................................................41
Figure 46. Annual load duration curve before and after TOU (only 5% of load hours shown) ...............................42
Figure 47. Hourly load profile for peak day (July 9, 2018) before and after TOU ..................................................42
Figure 48. Hourly load profile for peak day for winter (January 4, 2019) before and after TOU............................42
Figure 49. Box plot of summer load by consumer category for three consumer groups..........................................46
Figure 50. Annual load duration curve before and after TOU (only 5% of load hours shown) ...............................47
Figure 51. Hourly load profile for peak day (July 9, 2018) before and after TOU ..................................................48

 xii
List of Tables
Table 1. BRPL TOD Tariff for Non-Domestic and Industrial consumers .................................................................5
Table 2. Data Received from BRPL That Was Used for Load Analysis ...................................................................7
Table 3. Monthly Statistics of System-Level Load Profile ......................................................................................14
Table 4. Profile of Domestic Survey Respondents ...................................................................................................18
Table 5. Distribution of ACs Across Various Categories ........................................................................................20
Table 6. Total ACs in the Sample ............................................................................................................................23
Table 7. Calculating Load (in kW) of ACs ..............................................................................................................24
Table 8. Percentage of ACs in Operation .................................................................................................................25
Table 9. Estimating Monthly Energy Consumption (kWh) by the ACs for the Summer Months ...........................25
Table 10. Profile of the Respondents in C&I Survey ...............................................................................................28
Table 11: Summary of Optimization Results for Summer and Winter Seasons ......................................................43
Table 12. On-Peak to Off-Peak Price Ratio for Different Price Elasticities and Consumer Response Window in
Both Summer and Winter Seasons ...........................................................................................................................43
Table 13. Percentage Peak Reduction for Various Levels of Price Elasticities and Response Window in Both
Summer and Winter Seasons ....................................................................................................................................43
Table 15. Summary of TOU Results and Analysis for Summer and Winter Seasons ..............................................48
Table 16. C&I Consumers’ End-Use Frequency for Different Categories ..............................................................52
Table 17. C&I Consumers’ Attitudes and Responses to Changes in Energy Consumption and Behavior ..............52
Table 18. C&I Consumers’ Response to Different Energy Efficiency and Environmental Energy Use Statements
..................................................................................................................................................................................53
Table 19. C&I Consumers’ Response to Air Conditioning Demand Response Proposal ........................................53
Table 20. C&I Consumers’ Interest in Rooftop Solar Systems ................................................................................53
Table 21. C&I Consumers’ Number of Ceiling and Portable Fans Owned .............................................................53
Table 22. C&I Consumers’ Number of Air Coolers at Establishment .....................................................................54
Table 23. C&I Consumers’ Months of the Year in Which Air Coolers Are Used ...................................................54
Table 24. C&I Consumers’ Types of AC Used on Premises ...................................................................................54
Table 25. C&I Consumers’ Ability to Control AC System ......................................................................................54
Table 26. C&I Consumers’ Temperature Setting Used During Summer Months ....................................................54
Table 27. C&I Consumers’ Temperature Settings Used for Heating in Winter Months..........................................55
Table 28. C&I Consumers, What Months Air Cooling Usage Starts and Ends .......................................................55
Table 29. C&I Consumers’ Presence of Plug-In Heaters .........................................................................................55
Table 30. C&I Consumers’ Start and End Month for Use of Air Heating If Used ..................................................55
Table 31. C&I Consumers’ Percentage of Owned Light Bulbs That Are Energy Efficient.....................................56
Table 32. Domestic Consumers’ Use of Key Appliances ........................................................................................56
Table 33. Domestic Consumers: How Many Light Bulbs Are on Premises ............................................................57
Table 34. Domestic Consumers’ Likelihood of Responding to Different Demand Response Measures .................58
Table 35. Domestic Consumers’ Use of Cooling and Heating Loads Across Months.............................................59
Table 36. Domestic Consumers: Type of AC Used .................................................................................................59
Table 37. Domestic Consumers’ Control of AC Systems ........................................................................................59
Table 38. Domestic Consumers’ Set-Points Use for AC Systems ...........................................................................59
Table 39. Domestic Consumers’ Temperature Settings Used for Heating in Winter Months .................................60
Table 40. Domestic Consumers’ Duration of Use for Electric Geysers When Turned on .......................................60
Table 41. Domestic Consumers’ Time of Use for Electric Geysers.........................................................................60
Table 42. Domestic Consumers’ Size of Battery Systems Owned in kWh ..............................................................60

 xiii
Table 43. Domestic Consumers’ Occupancy Patterns Before and During the COVID-19 Pandemic .....................61
Table 44. Domestic Consumers’ Ownership of Rooftop Solar ................................................................................61
Table 45. Domestic Consumers’ Capacity of Rooftop Solar ...................................................................................61
Table 46. Domestic Consumers’ Ownership of EVs ................................................................................................61
Table 47. Domestic Consumers’ Method of Charging EV.......................................................................................62
Table 48. Domestic Consumers’ Response to Demand Response Potential Payments for Reducing AC Load ......62
Table 49. Annual load duration data as seen in Figure 50 (for top 5%) ...................................................................63

 xiv
1 Introduction
BRPL is a distribution utility that serves part of the city of Delhi in North Central India. The utility serves over 2.4
million consumers as of March 2017 in a highly urban territory, with a consumer density of 3,100 consumers per
square kilometer. BRPL is a distribution load-serving utility. Both consumers and the utility benefit from flexibility
on the demand-side to help alleviate peak demand and underutilized generation and network capacity, to use demand
response to help integrate renewable energy, and to help promote energy efficiency to reduce energy consumption.

The work in this report details research performed by NREL in collaboration with GTG-RISE team and BRPL to
support and investigate the potential of DSM for consumer- and grid- benefits in Delhi. This research was supported
by the U.S. Agency for International Development. The overall aim of this research was to assess the potential
responsiveness of BRPL consumers and establish the potential benefits of DSM (About BRPL).

BRPL is a public-private company and is a joint venture between the Government of Delhi and Reliance
Infrastructure Limited. It is one of three electricity distribution companies in Delhi; see Figure 1 (BRPL, FAQ). The
utility principally serves residential and commercial consumers and has a high consumer density. The utility has
experienced high growth in the number of consumers served, increasing its number of distribution transformers by
63% between 2003 and 2017.

 Figure 1. BRPL’s service territory map in Delhi and neighboring utilities
As a distribution load-serving utility, BRPL can achieve energy reduction and flexibility by motivating DSM
strategies. The principal form of achieving this is through retail price plans. To date, BRPL has some forms of
variable pricing schemes, detailed in the next section, for their C&I consumers. However, the majority of the
utility’s energy consumption comes from their residential sector. The next section documents the different forms of
DSM and focuses on those that might be of greatest import for BRPL.

1.1 DSM Review
The U.S. Energy Information Administration states about DSM, “Demand-side management (DSM) programs
consist of the planning, implementing, and monitoring activities of electric utilities which are designed to encourage
consumers to modify their level and pattern of electricity usage (USEIA).

 1
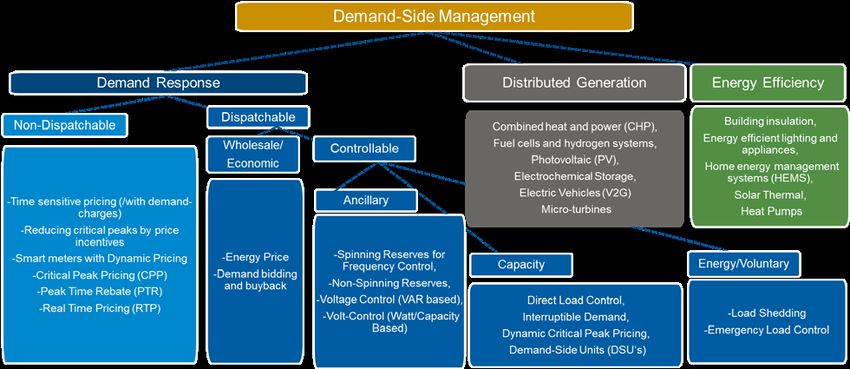
DSM comes in many forms, such as DR and energy efficiency, and it can be expanded to include demand-side, or
BTM, resources such as distributed generation; see Figure 2. The three broad categories of DSM are as follows:

 • Demand response: DR can be broadly defined as trying to motivate a change in the level and pattern of
 consumer energy consumption. DRs can be broken down into those that are dispatchable and those that
 generate a response but are non-dispatchable.

 o Dispatchable: Dispatchable DRs are those forms of DR which a utility has some form of control
 over, either through direct dispatch comments, wholesale market dispatch, or controllable DR for
 capacity services, ancillary services, and/or energy voluntary services. These forms of DR require
 communication and generally a level of sophistication for calculating energy bid prices, ensuring
 reliability of response and outcome. Typically, larger C&I consumers are best suited to these forms
 of DR.

 o Non-dispatchable: Non-dispatchable DRs are those forms of DR for which a utility can create a
 signal to motivate a response, but over which typically the utility does not have any direct control
 regarding reliability or level of response. Retail price plans that motivate energy shifting and energy
 efficiency fall into this category and can be used for a wide set of consumers (e.g., residential and
 C&I consumers) without the need for any sophisticated controls or communications. Smart
 metering infrastructures are typically needed to provide these forms of DR.

 • Energy efficiency: Energy efficiency can be achieved through a variety of mechanisms, including
 behavioral changes, appliance upgrades, and dwelling thermal insulation. The incentives for energy
 efficiency are principally economic (i.e., reducing consumer utility bills) and conscientiousness (e.g.,
 concern for environmental impacts of energy use). Regulations on appliances meeting efficiency targets
 and the regulatory phase-out of inefficient appliances (e.g., bans on incandescent light bulbs) are a major
 way of achieving energy efficiency. Energy efficiency can also be achieved by availability of information
 on saving energy and switching to energy efficient appliances and price plans (e.g., incremental block
 tariffs) that incrementally increase the price per unit of energy as energy consumption increases.

 • Distributed generation and storage: BTM or demand-side distribution generation can be classified as a
 form of DSM and can have many of the characteristics of non-dispatchable DR and energy efficiency. The
 same conscientiousness around environmental impacts of energy use that may motivate energy efficiency
 can motivate the adoption of rooftop solar photovoltaic (PV), and both serve to decrease the energy
 consumed from the grid. Likewise, distributed storage can achieve energy shifting that has characteristics
 similar to price responsiveness of consumers moving consumption away from peak periods.

The research performed and documented in this report focuses on non-dispatchable DR techniques such as using
retail price plans to motivate energy efficiency and peak demand reduction and/or energy shifting.

 2
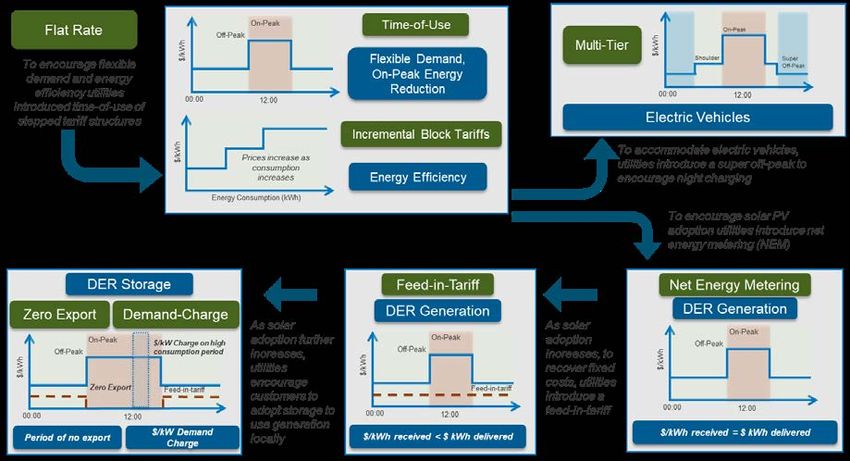
Figure 2. Classification of DSM strategies
1.1.1 Price Plans for Achieving Demand Response
Pricing for electricity can be used to motivate changes in energy usage patterns and overall reduction in energy
consumption. Utility price plans have been evolving over decades, motivating energy efficiency, flexible demand,
and peak flat-rate tariffs (e.g., a single price per kWh) do not motivate lower energy consumption usage beyond a
consumer simply purchasing less of electricity as a commodity. Flat-rate tariffs, where electricity costs are uniform
across all hours, also do not motivate any change in consumption patterns. Both rewarding consumers who have
lower energy consumption and motivating a change in energy consumption patterns can be achieved with
incremental block tariffs and time-based, or TOU, price plans:

 • Incremental block tariffs: These tariffs, also known as block tariffs, stepped rate, or slab tariffs,
 incrementally increase the unit price of electricity as consumers’ electricity consumption increases. This
 gives low energy consumption consumers an overall lower levelized cost of electricity (i.e., overall cost
 divided by total energy consumption) and motivates high consumption consumers to reduce their energy
 consumption, promoting energy conservation and efficiency.

 • TOU: Motivating a change in energy consumption patterns and a shift away from peak period usage to
 help flatten the load curve can be achieved by time-based or TOU pricing. Utilities can design tariffs to
 shift energy consumption away from peak periods and thereby promote both an overall reduction in demand
 and shifting of other energy usage. TOU tariffs can be multiperiod, such as those used for EVs, where
 utilities motivate both a reduction in on-peak energy consumption and off-peak or shoulder tariff, and a
 super off-peak price to shift EV charging to late night periods.

Utility price plans have also evolved to motivate and provide price signals for the adoption and use of solar PV
systems as a form of distributed generation. The evolution of utility price plans typically moves from no financial
reimbursement for generation export, to net energy metering, to some form of feed-in tariffs, to demand charges
and zero export; these are documented below:

 • Net energy metering: Net energy metering is the most financially rewarding rate structure for solar PV
 adoption. Net energy metering offers exports the same price as imports, allowing consumers to offset their
 energy bill with any excess solar exported to the grid, which also eliminates the need for energy storage.
 Although this price plan strongly motivates solar adoption, it can cause issues for utilities where fixed costs

 3
that are still incurred from consumers (i.e., market operation charges, generation, and network capacity
 charges) are lumped into the unit price of electricity are no longer fully recovered.

 • Feed-in tariffs: Feed-in tariffs, also known as export tariffs or export credits, are unit prices for export that
 are typically lower than import tariffs. These prices are designed to not pay consumers for fixed costs for
 solar export and are generally oriented around offering consumers a price that tries to fairly reflect the value
 of exported solar. These rate structures do not motivate solar adoption as strongly as net energy metering,
 and there are arguments that consumers with solar should get paid for some fixed costs as solar installations
 can avert network upgrades and provides a form of generation capacity in addition to energy exports.

 • Demand charges and zero export periods: Demand charges price consumers based on their highest kW
 consumption (usually the highest consumption over a discrete time period during a predefined range of
 time). These rate structures provide an alternative route for utilities to get reimbursed for fixed capacity
 costs incurred as a result of consumption; it is dependent on a consumer’s highest capacity usage rather
 than their energy consumption (Hledik 2014). These can be introduced as a means of fixed cost recovery
 in scenarios of high PV penetration where recovering these costs through other rate structures can be more
 challenging. Utilities are also introducing retail rates that emphasize export, with some utilities moving to
 timed zero export periods (Hoke et al 2018).

Figure 3. Evolution of price plans to motivate flexible demand, smart charging, adoption of solar PV, and
 use of energy storage for self-consumption and energy shifting
Another element of rate structure design is how each cost component is recovered. Utility costs can generally be
broken down into fixed costs (e.g., transmission and distribution network and generation capacity), variable costs
(operation and maintenance, energy and fuel costs, market operator charges) and taxes and obligations (renewable
energy surcharges, taxes and other direct costs). These utility costs can be recovered through four principal price
components: kWh prices (i.e., energy), kW prices (i.e., demand), service and amperage connection charges, and
monthly fixed charges; see Figure 4. Lumping fixed charges into energy prices (i.e., kWh prices) runs the risk of
these prices not being recovered, however, higher kWh prices better motivate energy efficiency and energy shifting.

 4
Figure 4. Utility cost components and methods of recovery through different retail price components
In the next section we assess the demand-side potential for BRPL of non-dispatchable DR in the form of TOU
tariffs. We also detail the tariff structures that BRPL currently has on offer to their consumers.

1.2 Assessing the DSM Potential for BRPL
Introducing DSM measures in BRPL’s service territory will help reduce peak demand, providing network and
capacity upgrade cost deferral, and could also motivate increased energy efficiency. DSM can bring cost savings to
both the consumer and the utility through overall efficiency gains in supply and demand. BRPL can motivate DSM
through their tariff structures, moving to TOU and more advanced retail structures that can motivate changes on the
demand side.

As of February 2021, BRPL has incremental block tariffs for their consumers and has a time-of-day (TOD) tariff
structure available to their C&I consumers (BRPL,FAQ). C&I consumers are also billed on their sanctioned load
(kW or kVA), and a surcharge is added to this bill if their maximum demand exceeds the sanctioned load. The
details of the TOD tariff available to C&I consumers is given in Table 1 (BRPL,Facts you should know) (Comission
(CPUC), California Public Utilities).

 Table 1. BRPL TOD Tariff for Non-Domestic and Industrial consumers
 Month Peak Hours Surcharge Off-Peak Hours Rebate on Energy Charges
 on Energy
 Charges

 May–September 14:00–17:00 20% 04:00–10:00 20%

 22:00–01:00

While TOD tariffs are available to BRPL’s C&I consumers, only incremental block tariffs are available to their
residential consumers. Residential consumers account for 67% of BRPL overall energy consumption. In addition,
C&I consumers can be inflexible; this is because the value of their end-use may be greater than any provided
opportunity cost of shifting or reducing demand during peak hours. To evaluate whether introducing a TOU (this is

 5
the same as a time-of-day in structure, but this report uses “TOU”) tariff structure an evaluation framework was
established, see Figure 5. This involved assessing the consumer class breakdown in BRPL’s service territory,
establishing the end-uses for each class, assessing consumer class willingness and ability to participate, and finally,
designing a DSM program and assessing the overall potential benefit to BRPL and their consumers.

 Figure 5. Classification of DSM strategies
This assessment involved three main stages:

 • Consumer class breakdown and load analysis: This stage involved analyzing BRPL data on their
 different consumer classes, including percentage breakdowns, energy, and peak demand contribution. This
 also involved looking at seasonal peak load analysis; this is documented in the next Chapter.

 • Surveying consumers, usage, and motivation: In this stage, we surveyed 413 domestic consumers and
 318 C&I consumers, gathering information on their energy usage patterns, motivation to achieve demand
 response, and end-uses that had the greatest DR potential.

 • Identification of potential through modeling and optimization: Identifying the TOU potential involves
 examining how to choose TOU seasons, on-peak hours, and on- to off-peak price ratios. This section builds
 a modeling and optimization framework to examine the TOU structure and identify the potential peak
 demand reduction with a sensitivity analysis on consumer responsiveness.

 6
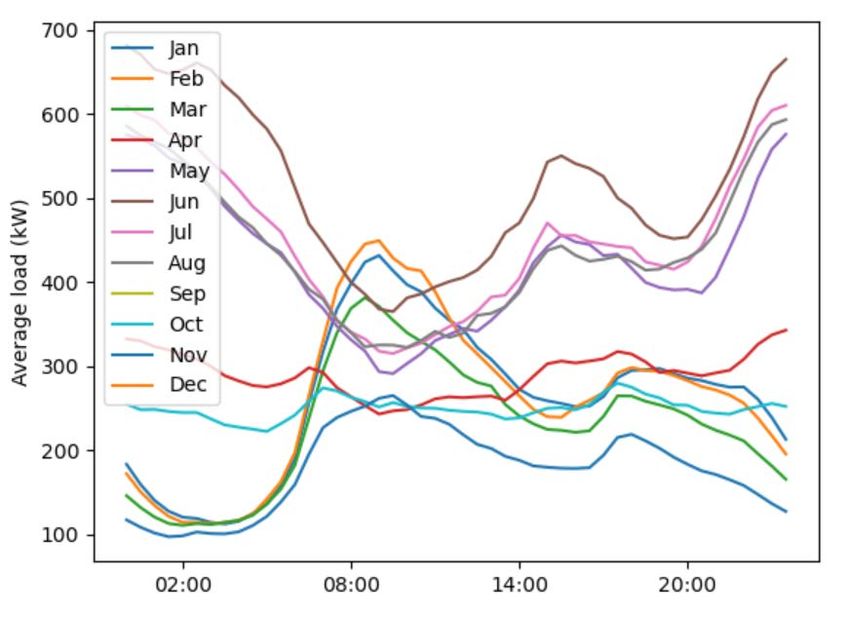
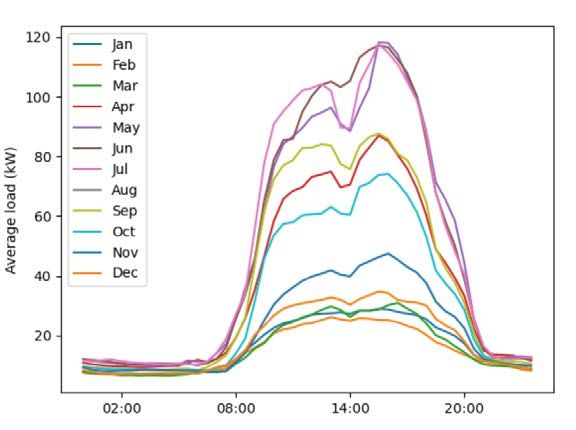
2 Demand-Side Load Profile Analysis
An initial step in DSM assessment is to understand the seasonal and diurnal patterns in consumer demand and to
identify which load classes drive overall consumption. Understanding consumer energy consumption patterns is
crucial in designing an effective DSM strategy, to both target peak hours and impact consumers. NREL received
annual 30-minute load data from BRPL for the year 2018–2019 and distribution transformer data that served
specific consumer classes; see Table 2 for a description of data received. This data was later used to help design a
TOU tariff for BRPL. More on the TOU design is discussed in Section 3. This section will provide in-depth analysis
of BRPL’s load profile using historical data.

 Table 2. Data Received from BRPL That Was Used for Load Analysis
 Data Data Description

 System data • 30-minute resolution load data from April
 2018 to March 2019

 • Monthly generation cost (Rs/MWh) data
 along with contracted capacity for 22
 generators

 Distribution transformer data • 30-minute resolution energy consumption
 data for 24 distribution transformers

 Consumer class energy consumption and • Monthly energy consumption data for 413
 number of consumers data domestic consumers, 318 C&I consumers

2.1 Seasonal Energy Consumption Pattern
The BRPL system-level load profile exhibits seasonal energy consumption patterns related to heating and cooling
use across months. The system annual peak demand occurs in summer months, specifically July for 2018. The load
profile is dual peaking in summer with system peaks in late afternoon (around 4 p.m.) and at night (around
midnight); see Figure 6. In winter months, the system peak is during the morning (around 10 a.m.–11 a.m.), as
shown in Figure 6. The energy consumption is significantly higher in summer months when compared to winter
months.

 7
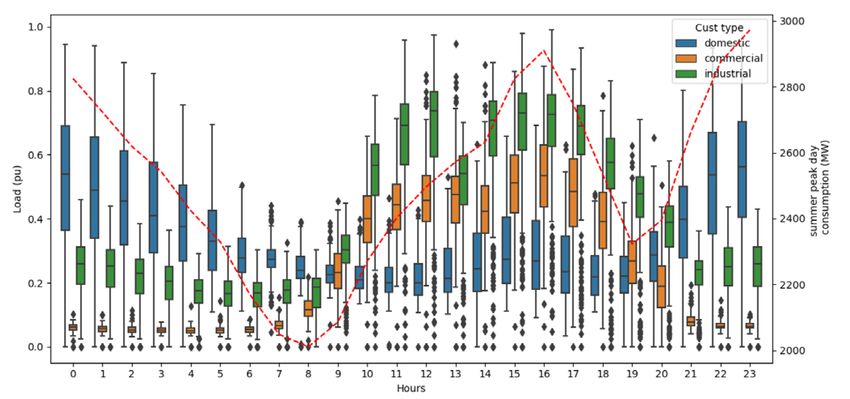
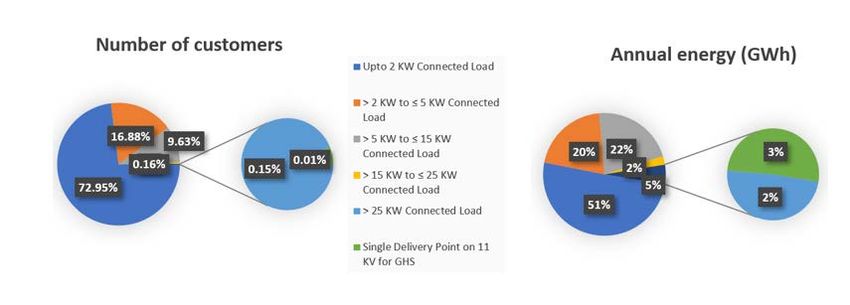
Figure 6. Seasonal energy consumption of BRPL system-level load profile

2.2 Load Sector Analysis
Consumption patterns vary by consumer class (e.g., domestic, industrial, commercial, etc.). Analyzing individual
consumer classes allow an assessment of consumer class contribution to overall system peak demand. Consumer
classes are broadly broken into three categories for this analysis: domestic, non-domestic and industrial. BRPL
consumer classes by number of consumers and annual energy consumption are shown in Figure 7.

Figure 7. Number of consumers and annual energy consumption (for 2018) for three consumer classes in
 percentage
Although domestic consumers account for close to 87% of total number of consumers, their contribution to annual
energy consumption is lower, at 67%. Similarly, C&I consumers account for a greater proportion of energy
consumption than the number of consumer breakdown, contributing to 31% and 2% of total annual energy
consumption respectively in BRPL territory in 2018. This is intuitive, as C&I consumers have much greater energy
end-use by consumer by virtue of the scale of energy requirements. Figure 8, Figure 9, and Figure 10 show the
breakdowns of domestic, non-domestic, and industrial consumers further by number of consumers and annual
energy consumption and utility-sanctioned load (i.e., connected load). Approximately 73% of BRPL domestic
consumers have a connected load less than 2 kW and contributed to 50% of total domestic energy consumption in
2018.

 8
You can also read