1.5 C Pathways for Europe: Achieving the highest plausible climate ambition - EU27, Denmark, France, Germany, Italy, Poland, Portugal, Romania ...
←
→
Page content transcription
If your browser does not render page correctly, please read the page content below
1.5°C Pathways for Europe:
Achieving the highest plausible
climate ambition
EU27, Denmark, France, Germany, Italy, Poland, Portugal,
Romania, Spain, Sweden

October 2021
1.5°C Pathways for Europe: Achieving the
           highest plausible climate ambition
                  EU27, Denmark, France, Germany, Italy, Poland,
                        Portugal, Romania, Spain, Sweden

AUTHORS
Ryan Wilson                                 Jonas Hörsch                            Matthew Gidden
Lara Welder                                 Deborah Ramalope                        Bill Hare
Alexandre Delfosse

Design                                       Designers For Climate Studios

We would like to thank the REMIND research team who have made available the underlying data from global least
cost pathways used in this analysis.

SUPPLEMENTARY MATERIAL
A digital copy of this report is available at:
www.climateanalytics.org/publications

CITATION AND ACKNOWLEDGMENTS
This publication may be reproduced in whole or in part and in any form for educational or non-profit services
without special permission from Climate Analytics, provided acknowledgment and/or proper referencing of the
source is made.

This publication may not be resold or used for any commercial purpose without prior written permission from
Climate Analytics. We regret any errors or omissions that may have been unwittingly made.

This document may be cited as:
Climate Analytics (2021). 1.5°C Pathways for Europe: Achieving the highest plausible climate ambition.

This report has been prepared under the “1.5°C Pathways for Europe Project” supported by the Swedish Postcode
Foundation.

                                                 Supporting science based policy to prevent dangerous
                                                 climate change enabling sustainable development

                                                 www.climateanalytics.org
Executive Summary
To date, governments have submitted inadequate and unambitious national climate targets that
are not sufficient to meet the Paris Agreement long-term temperature goal according to the latest
available science.
This report presents domestic emissions and energy mix pathways required to meet the Paris
Agreement’s 1.5°C goal for the EU27 and nine Member States: Denmark, France, Germany, Italy,
Poland, Portugal, Romania, Spain, and Sweden, and assesses if their current 2030 climate targets
are in line with these pathways. Pathways are derived from the REMIND model, in particular a
scenario that meets the necessary sustainability criteria and achieves the greatest regional emissions
reduction to 2030 found in the IPCC Special Report 1.5°C, and the Paris Agreement Compatible
(PAC) Scenario, a bottom-up derived scenario compiled by the Climate Action Network Europe and
European Environmental Bureau. Key decarbonisation benchmarks for the power and industry
sectors consistent with 1.5°C emissions and energy mix pathways are also provided.
For the EU27, the two assessed scenarios outline the following 1.5°C compatible ranges:
• 2030 GHG emissions reduction target of between 61-74% below 1990 levels (excl. LULUCF)
• Share of renewable power generation in 2030 of between 76-90%
• Share of unabated fossil gas in the power sector of between just 3-8% by 2030, with coal
phased out by 2030
• Achieving net zero emissions between 2040 and 2050
ES Figure 1: Domestic 1.5ºC compatible GHG emissions pathways for the EU27
1.5°C Pathways for Europe iThe EU is currently discussing the proposed ‘Fit for 55’ package of climate-related regulation
amendments and updates. However, none of these proposals, including the 55% headline
emissions reduction target align with the pathways derived in this report that represent the highest
plausible ambition level for Europe.
Among the countries analysed here, all except for Romania are designated as Annex II countries by
the United Nations Framework Convention on Climate Change (UNFCCC), meaning they are
developed countries. Applying equity principles implies that all Annex II countries need to provide
support to developing countries’ emissions reduction efforts above and beyond their cost-effective
1.5°C-consistent domestic emissions reductions.
Country key messages
Denmark’s 2030 and 2050 domestic emission reduction targets are within the range
created by the two downscaled 1.5°C compatible pathways. Focus should now be on
implementing strong and effective policies to phase out remaining fossil fuel use in the
power sector by 2030, and the industry and transport sectors by 2040.
While France’s 2050 net zero emissions target aligns with the downscaled 1.5°C emissions
pathways, its 2030 emissions reduction and renewable generation targets do not.
Improving its 2030 emissions target to between 48-66% below 1990 levels (excl. LULUCF),
phasing out the limited remaining fossil fuel power generation by around 2030, and
ratcheting up its 2030 renewable generation target to between 57-74% would all align with
the 1.5°C compatible national results derived for France.
Recent updates to Germany’s 2030 and net zero emissions targets are a welcome sign of
progress, but the 1.5°C aligned emissions reduction pathways produced in this report show
a further strengthening of its 2030 target to between 72-79% below 1990 levels (excl.
LULUCF) is needed. This could be accompanied by a significant ratcheting up of its 65%
2030 renewable generation target to between 93-97%.
An indication in early 2021 by Italy’s Minister for the Ecological transition that Italy would
set a 60% emissions reduction target for 2030 has yet to lead to a concrete commitment.
While discussions on the target remain ongoing, Italy has the ideal opportunity to ratchet
it up to reach the 1.5°C range derived in this report of 67-73% below 1990 levels (excl.
LULUCF).
Poland’s stated intention to continue burning coal well into the 2040s is far from aligned
with the Paris Agreement’s 1.5°C long-term temperature goal. In this report’s 1.5°C
downscaled emissions and fuel mix pathways, Poland’s current 2030 emissions reduction
target would need to more than double in ambition to between a 65-69% reduction below
1990 levels (excl. LULUCF), while the 2030 share of renewable generation reaches at least
90%.
1.5°C Pathways for Europe iiA 2023 phase-out of coal from the power sector and 2030 renewable generation target of
80% are commendable policy measures adopted by Portugal, but a projected continued
reliance on natural gas in its energy sector beyond 2030 is problematic. Increasing its
current 2030 renewable generation and emissions reduction targets to at least 88% and
43% below 1990 levels (excl. LULUCF) respectively would align with the 1.5°C pathways
derived in this analysis.
A recent announcement by the Romanian government of a 2032 coal phase-out is a
positive development, but still missing are commitments to phase out gas generation and
address the stalled growth in generation from renewables, both critical to achieving a 1.5°C
aligned trajectory. Benchmarks for Romania derived in this analysis include at least an 88%
share of renewables in power generation by 2030 and a 2030 emissions reduction target
of at least 79% below 1990 levels (excl. LULUCF).
Spain’s commitments to phase out coal use by 2030 and achieve net zero emissions by
2050 are examples of 1.5°C compatible climate policies, but some insufficient 2030 targets
remain. The derived 1.5°C compatible mix pathways for Spain set 2030 emissions
reductions of 41-62% below 1990 levels compared to the current target of 23% below 1990
levels, and between an 82-95% share of renewables in power generation by 2030
compared to the current 74% target.
Sweden has so far failed to set an economy-wide GHG emissions reduction target, instead
targeting sector-specific emissions like transport and those not covered by the EU
emissions trading system. According to the two downscaled 1.5°C compatible pathways,
the last remaining fossil fuel in Sweden’s power sector should be phased out by 2030, while
a targeted emissions reduction of 72-78% below 1990 levels by the same date is needed.
1.5°C Pathways for Europe iiiTable of Contents
Executive Summary ............................................................................................................................ i
Country key messages................................................................................................................................... ii
1 Introduction ................................................................................................................................ 1
2 Mitigation pathways consistent with the 1.5°C temperature limit ............................................ 2
2.1 Domestic action and equity considerations ...................................................................................... 2
2.2 Highest plausible ambition ................................................................................................................ 3
2.3 How are the EU27 and national 1.5°C compatible pathways derived? ............................................. 3
2.3.1 SR1.5 IAM scenarios ....................................................................................................................................... 3
2.3.2 REMIND model and the 1.7 CEMICS-1.5-CDR8 scenario .............................................................................. 4
2.3.3 Paris Agreement Compatible (PAC) scenario ................................................................................................. 5
2.3.4 Emissions from the land use, land use change, and forestry (LULUCF) sector ............................................... 6
2.4 Limitations and outlook towards updated global pathways.............................................................. 7
3 1.5°C compatible mitigation pathways for the EU27 ................................................................. 8
3.1 Current targets and policy context .................................................................................................... 8
3.2 Emissions and energy pathways and adequacy of targets ................................................................ 9
3.3 Power sector decarbonisation ......................................................................................................... 11
3.4 Industry sector decarbonisation ...................................................................................................... 12
3.5 Key characteristics of the EU27’s 1.5°C compatible pathways ........................................................ 14
4 National mitigation pathways consistent with the 1.5°C temperature limit............................. 15
4.1 Denmark’s domestic transition pathways ........................................................................................ 16
4.1.1 National context and current targets ........................................................................................................... 16
4.1.2 Emissions and energy pathways and adequacy of domestic targets ........................................................... 17
4.1.3 Decarbonising the power sector and policy implications ............................................................................ 18
4.1.4 Decarbonising the industry sector and policy implications .......................................................................... 19
4.1.5 Key characteristics of Denmark’s 1.5°C compatible pathways and other analyses ...................................... 21
4.2 France’s domestic transition pathways ............................................................................................ 22
4.2.1 National context and current targets ........................................................................................................... 22
4.2.2 Emissions and energy pathways and adequacy of domestic targets ........................................................... 22
4.2.3 Decarbonising the power sector and policy implications ............................................................................ 24
4.2.4 Decarbonising the industry sector and policy implications .......................................................................... 25
4.2.5 Key characteristics of France’s 1.5°C compatible pathways and other analyses ......................................... 26
4.3 Germany’s domestic transition pathway.......................................................................................... 28
4.3.1 National context and current targets ........................................................................................................... 28
4.3.2 Emissions and energy pathways and adequacy of domestic targets ........................................................... 29
4.3.3 Decarbonising the power sector and policy implications ............................................................................ 30
4.3.4 Decarbonising the industry sector and policy implications .......................................................................... 31
4.3.5 Key characteristics of 1.5°C compatible pathways and other analyses ........................................................ 32
1.5°C Pathways for Europe iv4.4 Italy’s domestic transition pathway.................................................................................................. 34
4.4.1 National context and current targets ........................................................................................................... 34
4.4.2 Emissions and energy pathways and adequacy of domestic targets ........................................................... 34
4.4.3 Decarbonising the power sector and policy implications ............................................................................ 36
4.4.4 Decarbonising the industry sector and policy implications .......................................................................... 37
4.4.5 Key characteristics of 1.5°C compatible pathways and other analyses ........................................................ 38
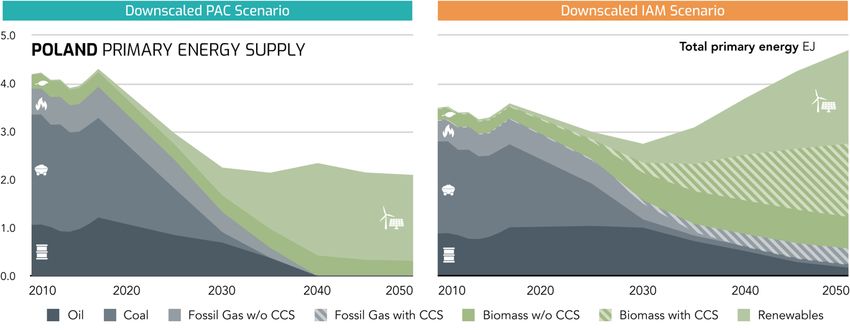
4.5 Poland’s domestic transition pathway ............................................................................................. 40
4.5.1 National context and current targets ........................................................................................................... 40
4.5.2 Emissions and energy pathways and adequacy of domestic targets ........................................................... 41
4.5.3 Decarbonising the power sector and policy implications ............................................................................ 42
4.5.4 Decarbonising the industry sector and policy implications .......................................................................... 43
4.5.5 Key characteristics of 1.5°C compatible trajectories and other analyses ..................................................... 44
4.6 Portugal’s domestic transition pathway ........................................................................................... 46
4.6.1 National context and current targets ........................................................................................................... 46
4.6.2 Emissions and energy pathways and adequacy of domestic targets ........................................................... 46
4.6.3 Decarbonising the power sector and policy implications ............................................................................ 48
4.6.4 Decarbonising the industry sector and policy implications .......................................................................... 49
4.6.5 Key characteristics of 1.5°C compatible pathways ....................................................................................... 51
4.7 Romania’s domestic transition pathway .......................................................................................... 52
4.7.1 National context and current targets ........................................................................................................... 52
4.7.2 Emissions and energy pathways and adequacy of domestic targets ........................................................... 53
4.7.3 Decarbonising the power sector and policy implications ............................................................................ 54
4.7.4 Decarbonising the industry sector and policy implications .......................................................................... 55
4.7.5 Key characteristics of 1.5°C compatible pathways and other analyses ........................................................ 57
4.8 Spain’s domestic transition pathway ............................................................................................... 58
4.8.1 National context and current targets ........................................................................................................... 58
4.8.2 Emissions and energy pathways and adequacy of domestic targets ........................................................... 59
4.8.3 Decarbonising the power sector and policy implications ............................................................................ 60
4.8.4 Decarbonising the industry sector and policy implications .......................................................................... 61
4.8.5 Key characteristics of 1.5°C compatible pathways and other analyses ........................................................ 63
4.9 Sweden’s domestic transition pathway ........................................................................................... 64
4.9.1 National context and current targets ........................................................................................................... 64
4.9.2 Emissions and energy pathways and adequacy of domestic targets ........................................................... 64
4.9.3 Decarbonising the power sector and policy implications ............................................................................ 66
4.9.4 Decarbonising the industry sector and policy implications .......................................................................... 67
4.9.5 Key characteristics of 1.5°C compatible pathways and other analyses ........................................................ 68
5 Conclusion ............................................................................................................................... 69
Annex: Downscaling methodology description .......................................................................................... 71
i Illustrative Pathways......................................................................................................................... 72
i.1.1 Energy - CO2 emissions ................................................................................................................................ 72
i.1.2 Agriculture sector ......................................................................................................................................... 73
i.1.3 Industrial processes, waste and energy non-CO2 emissions ......................................................................... 73
i.1.4 Global Warming Potentials .......................................................................................................................... 74
Bibliography .................................................................................................................................... 75
1.5°C Pathways for Europe v1 Introduction As part of the Paris Agreement, 184 governments have put forward targets (Nationally Determined Contributions, or NDCs) to limit the global average temperature increase to 1.5oC with the aim to ‘significantly reduce the risks and impacts of climate change’. To date, their combined effect is not sufficient to achieve this limit. At the moment, they put the world on a path to approximately 2.4- 2.7°C of warming – at risk of almost doubling the agreed limit (Climate Action Tracker, 2020; UNFCCC, 2021b). In their successive NDCs, governments are required to put forward more ambitious emissions reduction targets that should align with the Paris Agreement. The Intergovernmental Panel on Climate Change (IPCC) Special Report on 1.5°C showed not only why governments must act urgently to prevent higher levels of warming, but also how global emissions need to, and can be reduced, by at least 45% by 2030 compared to 2010 (Rogelj et al., 2018). By mid-century emissions will need to be brought to net zero to limit global warming to 1.5°C. To meet the urgent need to translate these global trajectories to action in line with the Paris Agreement, developing countries will require support. It is expected that developed countries provide such support in the form of climate finance and other measures, and to lead in the mobilisation of finance. Developed countries such as those in the EU27 have a critical role in leading the rapid transition to decarbonised economies, and it is important for such countries to understand the extent to which their current emissions reduction targets need to be strengthened. This analysis aims to be a resource to empower a broad range of national stakeholders, including public institutions, business, and civil society, in understanding decarbonisation pathways in line with the 1.5°C limit. These pathways, assessed with other lines of scientific evidence, show how a selection of nine EU countries can update their 2030 emissions reduction targets and develop long-term low carbon development strategies in line with the Paris Agreement, living up to their pledges to limit temperature rise to 1.5°C. The scenarios chosen for this analysis represent the highest plausible ambition for Europe and embody two methodologically distinct approaches to deriving 1.5°C compatible emissions and energy pathways for the EU27 and its Member States. The analysis is framed around two timelines: the medium term (by 2030), and the long term (by mid-century). Sectoral benchmarks consistent with the analysed emissions pathways are provided for the power and industry sectors that outline a range of fuel mixes and necessary emissions reductions to ensure sectoral alignment with the 1.5°C limit. For the EU27 and all nine Member States covered in this report, both scenarios outline a steep reduction in emissions in the current decade and ramping up of renewable energy technologies to replace fossil fuel combustion, which is subsequently eliminated between 2030 and 2040. This reflects the reality that we are now in the critical decade, where the 1.5°C long-term temperature goal of the Paris Agreement remains within reach, but only if global action drastically ramps up to 2030. The EU27 and its Member States now have an opportunity to light a path forward for the rest of the world to follow, but it will require political courage to embrace the highest plausible climate ambition. This report seeks to illustrate what such climate ambition for Europe could look like. 1.5°C Pathways for Europe 1
2 Mitigation pathways consistent with the
  1.5°C temperature limit

2.1 Domestic action and equity considerations
In 2015, countries adopted the Paris Agreement, and agreed to “[…] strengthen the global
response to the threat of climate change […], including by holding the increase in the global
average temperature to well below 2°C […] and pursuing efforts to limit the temperature increase
to 1.5°C above pre-industrial levels” (UNFCCC, 2021a).

Article 4.1 of the Paris Agreement outlines key elements that would enable the achievement of the
long-term temperature goal:
    1. To reach “global peaking of greenhouse gas emissions as soon as possible”
    2. “To undertake rapid reductions thereafter in accordance with best available science”
    3. “To achieve a balance between anthropogenic emissions by sources and removals by sinks
       in the second half of this century”

This establishes a mandatory requirement for all parties to take action to contribute to the reduction
of global greenhouse gas emissions. The Agreement further affirms that action taken for
implementation should “reflect equity and the principle of common but differentiated
responsibilities and respective capabilities (CBDR)”.

This implies that in order to make a fair contribution to meeting the Paris Agreement’s goals,
developed countries need to both take domestic emissions reduction action and assist developing
countries to reduce their emissions through both financial and technological transfers. This means
that a developed country’s total NDC "fair share" action range is the total sum of domestic
reductions plus support for emission reductions action overseas. This can be in the form of climate
finance, or other support for mitigation consistent with the Paris agreement (Climate Action Tracker,
2018).

For developing countries, the 1.5°C compatible pathways go beyond their needed domestic
emission reduction targets and require additional support to be achieved. The fair share and equity
considerations embedded in the Paris Agreement imply that without support a developing country
would only reduce its emissions to its “fair share” range, and the gap between this fair share range
and the 1.5°C compatible domestic pathway could only likely be bridged with support from
developed countries. If a developing country’s current policy emissions pathway lies above its fair
share range, then it should take further action domestically to bring its emissions to at least this
range.

1.5°C Pathways for Europe                                                                            2
2.2 Highest plausible ambition While there are several equity principles, pathways considered here are not aligned with a given equity principle, but are aligned with the notion of “highest plausible ambition”: defined here as pathways that are technically and economically feasible, but with the steep medium-term emissions reductions. These pathways take into account present day characteristics, such as the current infrastructure (e.g., emissions intensity of the economy), of individual countries. To characterise this notion of “highest plausible ambition”, the choice was made to present two scenarios reflecting disparate methodological approaches to deriving ambitious 1.5°C compatible pathways for the EU27. Incorporating such methodologically divergent approaches reflects an attempt to increase the robustness of the resulting 1.5°C compatible ranges, as it ameliorates the potential for systematic errors or errant assumptions underpinning scenarios derived when using the same methodology. It also shows that deriving results that demonstrate high levels of ambition are not dependent on utilising one particular approach. The choice to present scenarios embodying the highest plausible ambition of a specific region (EU27) differs from other approaches that have been utilised to illustrate 1.5°C compatible energy and emissions pathways. A similar project that sought to portray country-level 1.5°C compatible emissions and energy pathways utilised a large subset of the “no or low overshoot” integrated assessment model (IAM) pathways collated in the IPCC Special Report on 1.5°C (SR1.5) (see section 2.3.1) (Climate Analytics, 2021). This approach was chosen to give a broad representation of the existing IAM literature on achieving the Paris Agreement’s 1.5°C long-term temperature goal, without a specific focus on the highest plausible ambition embodied by individual scenarios for any specific region. 2.3 How are the EU27 and national 1.5°C compatible pathways derived? The two scenarios chosen for this project are the REMIND 1.7 CEMICS-1.5-CDR8 IAM scenario, and the Paris Agreement Compatible (PAC) scenario, a bottom-up collective research exercise involving energy and climate experts and incorporating findings from relevant scientific literature. These scenarios are downscaled to both the EU27 and country level using the SIAMESE (Simplified Integrated Assessment Model with Energy System Emulator) tool. An explanation of the significance of the IAM scenarios included in the IPCC’s Special Report on 1.5°C (SR1.5) and how the REMIND CEMICS-1.5-CDR8 scenario was chosen and the specific characteristics of each scenario (REMIND and PAC) are outlined in the following sections (for a description of the SIAMESE tool and the general methodology for deriving EU27 and national energy mix and emissions projections, see Annex). 2.3.1 SR1.5 IAM scenarios The IPCC Special Report on Global Warming of 1.5°C (SR1.5) authored by more than 91 scientists and policy experts drawn from 44 nationalities, provides the most comprehensive assessment to date of greenhouse gas emission pathways that would meet the long-term temperature goal (LTTG) of the Paris Agreement (Rogelj et al., 2018). Emissions pathways contained in this report are derived from numerous modelled scenarios reflecting different evolutions of global energy demand and consumption and non-energy emissions. 1.5°C Pathways for Europe 3
The only emissions pathways from the IPCC SR1.5 report that are in line with the Paris Agreement
LTTG are those categorised as:
  •    no or low overshoot 1.5°C pathways;
  •    with a probability of more than 33% of limiting warming to below 1.5°C throughout the 21st
       century, and;
  •    with at least a 50% chance of limiting warming to below 1.5°C in 2100.

There are 42 such emissions pathways that are classified as “low or no overshoot 1.5°C pathways”,
with each pathway reflecting a unique set of economic and technological developments that
achieves this goal.

The existence of such a diverse set of global 1.5°C compatible pathways shows not only that there
are many different approaches possible to achieve the Paris Agreement’s 1.5°C temperature goal,
but that this goal is still very much achievable. All of these pathways, however, entail steep
emissions reductions between 2020 and 2030, reflecting the fact that we have entered the critical
decade, during which action to reduce emissions must be drastically scaled up.

Of these “no or low overshoot 1.5°C pathways”, we filter out scenarios that exceed global land-use
sustainability constraints as assessed by Fuss et al. (2018). From the remaining scenarios, we singled
out the scenario with the largest overall drop in emissions by 2030, which we take as signifying the
highest plausible level of ambition for Europe in the IAM literature.

The scenario that meets these criteria is the REMIND 1.7 CEMICS-1.5-CDR8, and hence this
scenario was chosen to represent the IAM approach to deriving a 1.5°C compatible energy mix and
economy-wide emissions trajectory.

2.3.2 REMIND model and the 1.7 CEMICS-1.5-CDR8 scenario

The REMIND (REgional Model of INvestment and Development) model is an integrated assessment
model (IAM) with a special focus on the development of the energy sector and its climate
implications. The goal of REMIND is to find the optimal mix of investments in the economy and
energy sectors of each modelled region given a set of population, technology, policy, and climate
constraints (Potsdam Institute of Climate Impact Research, 2016).

Specifically, REMIND is an energy-economy general equilibrium model linking a macro-economic
growth model with a bottom-up engineering-based energy system model. It covers twelve world
regions including the Europe region, from which the EU27 and country level results for this project
are derived. The macro-economic growth model projects growth, savings and investments, factor
incomes, energy, and material demand, while a nested production function with constant elasticity
of substitution determines the final energy demand.

The REMIND Europe region consists of the EU28 and several small semi-autonomous regions from
the UK and Nordic countries. The SIAMESE tool is used to derive EU27 results from this slightly
larger defined region used by the REMIND model (see Annex). SIAMESE is also used to derive
national level results for the nine Member States covered in this project.

A misalignment of the scope of industry sector energy demand data in the REMIND scenario exists
compared to the IEA World Energy Balances dataset that is used to provide historical data and the
PAC scenario historical demand data. Due to this energy data misalignment it was not possible to
provide downscaled industry sector energy and emissions pathways from the REMIND scenario.

1.5°C Pathways for Europe                                                                            4
The REMIND 1.7 CEMICS-1.5-CDR8 scenario chosen for use in this project envisages some natural
gas and biomass combustion with carbon capture and storage.
2.3.3 Paris Agreement Compatible (PAC) scenario
The PAC scenario is a European-wide energy scenario aligned with the Paris Agreement’s objective
to limit global warming to 1.5°C and which embodies the demands of civil society (PAC Consortium,
2020). In doing this, it suggests a trajectory with:
• 100% renewable energy supply by 2040
• At least 65% greenhouse gas emissions (GHGs) reductions by the year 2030
• Net zero emissions by 2040
The scenario was developed through a process of desk research, comparing and adopting elements
of a multitude of existing studies and models, and feedback on key assumptions gathered through
a comprehensive stakeholder engagement process. This process entailed a series of workshops and
webinars and an online survey and involved around 150 individuals from science, industry, and
member organisations of the Climate Action Network (CAN) Europe and the European Environment
Bureau (EEB).
The resultant scenario provides an ambitious blueprint for building a 1.5°C aligned energy system
for the EU28. Key elements of this scenario are:
1. A mobilisation of energy savings potentials through accelerating deep renovation of
buildings and a modernisation of industrial production processes. The increase of energy
efficiency in transport is also a main contribution. This leads to halving the EU’s energy
demand between 2015 and 2050.
2. A swift ramping up of domestic renewable energy use, in particular of solar PV and wind
energy for electricity production. Renewable electricity generation more than triples during
the decade from 2020 to 2030. This leads to renewables covering 50% of gross final energy
consumption in 2030 and 100% in 2040.
3. An electrification of industrial processes, heating and transport, based on renewable
electricity.
4. A quick phase-out of fossil fuels, starting with coal mostly disappearing from the mix by
2030, fossil gas by 2035 and fossil oil products by 2040. Most nuclear power plants also will
be closed by 2040.
5. A limited role for non-fossil gases and fuels which are based exclusively on renewable
hydrogen. These synthetic gases and fuels produced through electrolysis are essential for
decarbonising industry and aviation, besides a smaller and declining contribution of
sustainably sourced biogas and biomethane.
These elements and the overall scenario provide the starting point from which the EU27 and
national level results are derived using SIAMESE. Consequently, while the dynamics of national
results can differ in the relative composition of various fuels, they are bound by these general
features of the overall scenario.
1.5°C Pathways for Europe 5The PAC scenario is an energy system model, meaning that it does not include a sophisticated estimation of non-energy-related GHG emissions. As part of this project, a methodology was therefore derived to estimate these emissions for the PAC scenario to create robust economy-wide GHG emissions pathways for the EU27 and nine Member States analysed in this project (see Annex). A key assumption underpinning the PAC scenario is that carbon capture and storage will not be required to achieve net zero emissions for the European Union. 2.3.4 Emissions from the land use, land use change, and forestry (LULUCF) sector The scenarios chosen for analysis in this project do not include a capacity for modelling emissions from the LULUCF sector. As a result, the economy-wide emissions pathways generated for the EU27 and nine Member States are all excluding LULUCF emissions. As the PAC scenario assumes the achievement of net zero GHG emissions in 2040, the remaining non-energy related emissions for each country in 2040 shown in this analysis are assumed to be abated by a LULUCF sink of at least the size of these remaining emissions. Crucially, the level of EU27 residual emissions in 2040 under the PAC scenario that represents the size of the LULUCF sink needed to achieve net zero emissions by this date (345 MtCO 2e) is below the nearly 400 MtCO2e LULUCF sink in 2040 projected by the European Commission under its LULUCF+ scenario (European Commission, 2020). In this scenario, initiatives at EU, Member State or regional level have been developed that enable action at the local level and can include optimisation of forest management, afforestation projects and improving soil management including through rewetting and restoration of carbon-rich ecosystems. The size of the implied 2040 LULUCF sink for the EU27 under the PAC scenario is also well below the projected potential sink in numerous analyses in the scientific literature, which range from 430 to 570 in 2030, and 488 to 787 MtCO2e in 2050 (Build Up, 2019; Fraunhofer ISI & Öko-Institut, 2019; PIK, 2020; Welle et al., 2020). This provides strong evidence that the 2040 net zero target of the PAC scenario is achievable with enhanced efforts to maximise the size of the EU’s LULUCF sink. For the REMIND scenario, the implied size of the LULUCF sink required for the EU27 to reach net zero GHG emissions reaches those found in the aforementioned literature between 2040 and 2043. This declines further to just 175 MtCO2e in 2050, well below even the European Commission’s BAU scenario in 2050 of 271 MtCO2e (European Commission, 2021a). 1.5°C Pathways for Europe 6
2.4 Limitations and outlook towards updated global pathways
While global emissions pathways assessed in IPCC reports are essential for the broad scientific
setting and underpinning of the guidance on long-term energy system transformation, these
pathways were published in the scientific literature well ahead of the release of the IPCC SR1.5, and
were therefore often developed in 2017, or before. They do not necessarily keep track of current
developments in energy markets, disruptive technological developments, consumer choices and
policy trajectories. Furthermore, sustainability constraints identified by the IPCC and others and the
plausibility of future large-scale deployment of key technologies, such as BECCS, nuclear power
plants, fossil fuel with CCS and land-use options are often not captured in these pathways.

A parallel workstream to this analysis, together with the global energy-economic modelling
community, aims at developing an additional illustrative set of 1.5°C compatible pathway variants,
taking into account both the IPCC assessments and the latest data and analyses on policies and
technology markets and costs. This will allow the addition of further models and other lines of
evidence to empower stakeholders in understanding and making informed choices about the
necessary transformative changes. A future version of this report is planned to incorporate these
more up to date adjusted pathways that will be added to the two scenarios analysed here.

1.5°C Pathways for Europe                                                                            7
3 1.5°C compatible mitigation pathways for the
  EU27

3.1 Current targets and policy context
Since 1990, total EU27 GHG emissions (excl. LULUCF) have fallen by 26%, reaching 3,610 MtCO2e
in 2019, with much of this decline occurring since 2007, when they were just 8% below 1990 levels
(EEA, 2021). Under current policies,1 total EU27 GHG emissions are projected to reach 48% below
1990 levels including LULUCF (44% excl. LULUCF), achieving its original emissions target of at least
a 40% reduction below 1990 levels (incl. LULUCF) (European Commission, 2021a).

Figure 1: Historical EU27 emissions by sector. Source: (EEA 2020)

In late 2020, EU leaders agreed to enhance the EU27’s 2030 GHG emissions reduction target from
at least a 40% reduction below 1990 levels, to at least 55% by 2030 (incl. LULUCF). The EU
Commission has since adopted a package of revisions and additional regulations under the moniker
of ‘Fit for 55’, for the purpose of achieving this higher revised target (European Commission, 2021b).
The ‘Fit for 55’ package must still be reviewed and approved by the European Parliament and
Council when it will be formally adopted as EU legislation.

As the EU27 includes countries at various stages of development, the emissions reduction burden
to achieve the EU-wide 2030 target is not distributed evenly.

A key pillar to the EU’s policy is the implementation of the EU Emissions Trading System (EU ETS).
This EU regulation sets an EU-wide cap for electricity, industry and intra-EU aviation sectors, while
the remaining sectors are covered by the Effort Sharing Regulation (ESR) which distributes emission
reduction goals between EU Member States, mainly according to their GDP per capita levels. In its
‘Fit for 55’ package of proposals, the Commission suggested more stringent emissions reduction

1
    EU27 emissions under current policies are taken from the EU Reference Scenario 2020. Non-CO2 emissions are
    converted from global warming potentials (GWP) from the Fifth Assessment Report (AR5) into AR4 GWP to maintain
    comparability with emissions data in the remainder of this report.

1.5°C Pathways for Europe                                                                                       8
targets for the EU ETS and non-EU ETS sectors covered. These targets still need to be approved
by the European Parliament and the Council.
The EU27’s total energy supply peaked in 2006 and in 2019 was only marginally below 1990 levels,
falling in recent years due to plummeting coal demand and a steady decline in demand for oil and
petroleum products (IEA, 2020). Renewables have to date displaced considerable amounts of fossil
fuel consumption, with total renewable supply in the EU27 increasing fourfold since 1990, primarily
due to increasing solar and wind generation and biomass consumption.
3.2 Emissions and energy pathways and adequacy of targets
The EU27’s recently updated 2030 NDC of at least a 55% reduction in total GHG emissions below
1990 levels including LULUCF (at least 52% excl. LULUCF2) falls short of the 1.5°C compatible range
derived from the difference between the 2030 emissions levels of the downscaled IAM and PAC
scenarios used in this analysis. For the EU27, that range is determined as 61-74% (excl. LULUCF),
which is taken to represent the highest plausible ambition level for Europe.
Figure 2: Domestic 1.5ºC compatible GHG emissions pathways for the EU27
2
The EU27’s 2030 emissions reduction target excluding LULUCF emissions is calculated by assuming LULUCF emissions in 2030 will
reach the level projected under the EU’s Reference Scenario 2020 (-258 MtCO2e).
1.5°C Pathways for Europe 9Assuming the European Commission’s conservative business-as-usual scenario for the size of the EU27 LULUCF sink in 2030 (-258 MtCO2e), this equates to a 2030 emissions reduction target including LULUCF of 65% below 1990 levels for the downscaled IAM scenario and a 79% reduction below 1990 levels for the downscaled PAC scenario (European Commission, 2021a). The current target of a 55% reduction below 1990 levels (incl. LULUCF) is not 1.5°C compatible according to these downscaled pathways, and therefore cannot reasonably be promoted as a world-leading contribution to global climate mitigation efforts. Under the downscaled PAC scenario, total energy use for the EU27 declines steeply to 2030 whereby coal use is mostly phased out, then continues falling to 2040 as the remaining fossil gas and oil consumption is eliminated. Much of the decline in fossil fuel demand is displaced by renewable power generation which eliminates combustion-related losses, though energy savings, efficiency gains, and behavioural change in the residential, tertiary, and transport sectors contribute strongly (PAC Consortium, 2020). Ongoing efficiency gains prevent total energy demand from rising after 2040, with 2050 demand, consisting of 100% renewable energy, near 2040 levels. Figure 3: 1.5°C compatible primary energy supply pathways by fuel In the downscaled IAM scenario, total energy demand is in large part driven by GDP and population growth assumptions, that are taken from the shared socioeconomic pathway 2 (SSP2), which is a middle-of-the-road scenario (Luderer et al., 2015). This assumption of moderate GDP growth and convergence of per capita energy demand across regions beyond 2100 leads to an overall increase in primary energy demand after 2030 once inefficient coal combustion has been mostly phased out. Further efficiency gains resulting from ongoing displacement of oil and fossil gas combustion with renewable generation is outweighed by increasing demand, leading total demand in the EU27 to reach near current levels by 2050. Unabated fossil gas is mostly phased out by 2035, with over 95% of remaining fossil gas in 2040 utilising carbon capture and storage (CCS). 1.5°C Pathways for Europe 10
3.3 Power sector decarbonisation
Electricity generation in the EU27 has undergone a profound transformation over the last decade,
notably after EU ETS free allocation of allowances were phased out, with supply from coal and oil
roughly halving since 2007, while generation from renewables almost doubled over the same period
(IEA, 2020). This shift occurred while total electricity demand fell slightly, though still well above
1990 levels.

Table 1: 1.5°C compatible 2030 power sector fuel mix

Figure 4: Share of technologies in the power mix consistent with 1.5°C compatible emissions pathways

In 2019, renewable energy generation made up 34% of the total EU27 power supply, up from just
20% ten years earlier (IEA, 2020). To ensure the power sector is aligned with the derived 1.5°C
compatible energy mix pathways, this would need to more than double to at least 76% by 2030;
above the recently projected 2030 level of 64-67%. Coal would need to be phased out by 2030,
while fossil gas should be mostly removed from the system by 2035, with the last remaining fossil-
based generation gone by 2040.

Emissions from the power sector in the EU27 would need to decline by 84-95% below 1990 levels
by 2030 to align with the two downscaled 1.5°C compatible emissions pathways, with total
emissions reaching zero by 2040.

1.5°C Pathways for Europe                                                                              11
Figure 5: 1.5°C compatible power sector emissions for the EU27

3.4 Industry sector decarbonisation
The sectoral composition of the EU27’s multitude of economies varies considerably, including the
size and nature of each member state’s industry sector. Countries with extensive heavy industry
activity like steel or cement production, or fossil fuel or mineral processing generally see higher
shares of industry sector emissions as a proportion of total emissions. This variation should be
considered in the formulation of EU-wide policy proposals to achieve industry sector
decarbonisation, but the existence of extensive industrial output in the EU means setting ambitious
overarching policies and targets is crucial to its realisation.

Variation in GDP per capita across Member States is also substantial and EU-wide policy proposals
must accommodate this to ensure the mitigation burden is spread equitably. One measure that
seeks to address this in the ‘Fit for 55’ package’s proposed revisions to the EU ETS is an increase in
the percentage of the cap auctioned to fund the transition in Member States with below average
GDP per capita through the Modernisation Fund. These funds are allocated to help modernise
these Member States’ energy systems and improve energy efficiency (European Commission,
2021c).

While assisting those Member States with fewer resources to make the necessary rapid transition
to a decarbonised industry sector is important, having overarching targets to guide the
development of policies that reflect the necessary level of urgency to achieve the 1.5°C temperature
limit is crucial. The derived 1.5°C compatible industry energy mix and emissions pathway for the
EU27 seeks to guide the development of such targets, particularly to spur action in the current
critical decade.

Due to the misalignment of industrial energy consumption data from the REMIND model’s Europe
region with historical data used for this project, it was not possible to derive downscaled 1.5°C
compatible energy mix and emissions pathways from the chosen REMIND scenario. As a result,
industry sector results are only provided from the downscaled PAC scenario pathways.

1.5°C Pathways for Europe                                                                           12
Table 2: 1.5°C compatible 2030 industry sector final energy mix

Figure 6: 1.5°C compatible share of technologies in the industry energy mix

According to industry energy mix and emissions pathways downscaled from the PAC scenario, the
EU27 should eliminate fossil fuel combustion by around 2035. Significant energy efficiency gains
are combined with declining overall energy and resource consumption, while electrification and
renewable hydrogen contribute an increasingly significant share over the coming decades. Total
emissions should decline by 68% and 89% below 1990 levels by 2030 and 2050 respectively, with
energy-related emissions reaching zero by 2040.

                       Figure 7: 1.5°C compatible industry sector emissions for the EU27

1.5°C Pathways for Europe                                                                     13
3.5 Key characteristics of the EU27’s 1.5°C compatible pathways
Table 3 below provides a summary of key derived 1.5°C compatible economy-wide and sectoral
benchmarks for the EU27 in 2030 and 2050, compared against recent historical values.
Table 3: Key characteristics of the EU27’s 1.5°C compatible pathways
Historical 1.5°C compatible benchmarks EU27 targets
2017 2030 2050 2030* 2050*
3850 1257–1885 175–282 2355 271
MtCO2e/yr MtCO2e /yr MtCO2e /yr MtCO2e /yr MtCO2e /yr
Total GHG
excl. LULUCF
21 % 61–74 % 94–96 % 52 % 94%
below 1990 below 1990 below 1990 below 1990 below 1990
Emissions intensity of 325 15–53 0
power generation** gCO2/kWh gCO2/kWh gCO2/kWh
Share of renewable
31 % 76–90 % 94-100 % 65 %
power
Share of unabated fossil
fuel in power 43 % 4–10 % 0%
Share of nuclear power 26 % 7–14 % 0–6 % 16 %
Industry electrification
rate 32 % 47 % 63 %
* 2030 and 2050 targets excluding LULUCF calculated using the EU Reference Scenario 2020 projections
** Does not include upstream emissions
1.5°C Pathways for Europe 144 National mitigation pathways consistent with the 1.5°C temperature limit The following sections will provide country level results for the nine member countries selected to be assessed in this project (Denmark, France, Germany, Italy, Poland, Portugal, Romania, Spain, Sweden). Included in each section is a brief discussion of the current situation and recent trajectory of each country, including existing targets and key policies. A set of 1.5°C compatible economy- wide energy and emissions pathways and benchmarks are derived by downscaling the chosen IAM and PAC scenarios, as well as pathways and benchmarks for the power and industry sectors. 1.5°C Pathways for Europe 15
4.1 Denmark’s domestic transition pathways

4.1.1    National context and current targets

Though a small country with just 5.8 million inhabitants, Denmark is a global front-runner in its
commitments and contributions towards climate mitigation. Total Danish GHG emissions in 2019
were 50% below their peak in 1996 (36% below 1990 levels), with the majority of these emission
reductions coming from the power sector which registered an 85% reduction below 1996 levels in
2019 (Government of Denmark, 2021b).

This has been achieved primarily through an ambitious scaling up of renewable energy, particularly
wind energy, with the renewable share of Denmark’s electricity supply in 2019 averaging 50% (IEA,
2020). Transport sector emissions have risen, however, reaching 23% above 1990 levels in 2019
due to increasing road traffic over this time (Government of Denmark, 2021b).

The agriculture sector in Denmark is a significant emitter, constituting 24% of total emissions in
2019, with livestock production making up the bulk of emissions. Emissions from agriculture in 2019
were 17% below 1990 levels though, primarily from a reduction in N2O emissions. Non-combustion
emissions from industry processes and product use made up roughly 4% of total emissions in 2019,
mainly from cement production and F-gases used in refrigeration and air conditioning.

Figure 8: Historical emissions by sector. Source: (Government of Denmark, 2021a)

In 2019, Denmark passed its Climate Act, which targets a 70% reduction in GHG emissions below
1990 levels by 2030 including LULUCF (73% excl. LULUCF), and net zero emissions by 2050. This is
one of the strongest domestic emissions reduction targets in the world given the steep reduction
in emissions required by 2030 (Government of Denmark, 2019).

To achieve these targets, Denmark has put in place a number of ambitious medium-term policies,
including: phasing out coal from its electricity system by 2030, reaching a 55% renewable share of
gross final energy consumption and 100% of electricity generation by 2030, a 90% share of district
heating based on energy sources other than coal, oil, and gas by 2030, and phasing out the sale of
new petrol and diesel cars by 2030.

1.5°C Pathways for Europe                                                                        16
Further and more ambitious policies are needed, however, as under current policies, Denmark is
projected to fall considerably short of its 2030 target, instead reaching just 45% below 1990 levels
excluding LULUCF (Government of Denmark, 2020).

4.1.2    Emissions and energy pathways and adequacy of domestic targets

A reduction of 73-78% below 1990 levels (excl. LULUCF) is determined to be a 1.5°C compatible
range for a 2030 domestic emissions target, making Denmark’s 73% (excl. LULUCF) target aligned
with the Paris Agreement’s 1.5°C temperature goal. Denmark’s current suite of climate policies as
outlined in its National Energy and Climate Plan will, however, fail to achieve this target, reflecting
the need for greater urgency across all sectors of the economy (Government of Denmark, 2020).

In particular, policies are lacking to encourage the necessary rapid decarbonisation of the transport,
industry, and buildings sectors. After falling from their record high in 2018, transport emissions need
to continue to decline. Investments to achieve modal shift from cars to public transport and walking
or cycling are crucial moving forward, as are incentives to encourage house owners to install low
carbon heating options.

Figure 9: Domestic 1.5ºC compatible GHG emissions pathways for Denmark

In the derived 1.5°C compatible pathways, the share of unabated fossil fuels in primary energy
demand is reduced to between 25-32% by 2030, whereas the renewable energy share reaches
between 68-75% by the same date. The transport and industry sectors constitute a combined 42%

1.5°C Pathways for Europe                                                                            17
of total GHG emissions in Denmark, illustrating the need for strong policies to reduce the oil and
natural gas demand that produce these sectoral emissions.

Figure 10: 1.5°C compatible primary energy supply pathways by fuel

4.1.3    Decarbonising the power sector and policy implications

Denmark’s power sector has undergone a transformation over the last decade, marked by rapidly
declining coal and gas use and rising generation from renewables and biomass. The government’s
2030 coal phase-out is 1.5°C compatible, and should now be accompanied by a commitment to
phase out gas use by around the same date.

Table 4: 1.5°C compatible 2030 power sector fuel mix

Figure 11: Share of technologies in the power mix consistent with 1.5°C compatible emissions pathways

1.5°C Pathways for Europe                                                                               18
You can also read