Dose-Dependent Pattern of Cochlear Synaptic Degeneration in C57BL/6J Mice Induced by Repeated Noise Exposure - Hindawi.com
←
→
Page content transcription
If your browser does not render page correctly, please read the page content below
Hindawi
Neural Plasticity
Volume 2021, Article ID 9919977, 12 pages
https://doi.org/10.1155/2021/9919977

Research Article
Dose-Dependent Pattern of Cochlear Synaptic Degeneration in
C57BL/6J Mice Induced by Repeated Noise Exposure

 Minfei Qian ,1,2,3,4 Qixuan Wang,1,2,3 Zhongying Wang,1,2,3 Qingping Ma,1,2,3
 Xueling Wang,1,2,3 Kun Han,1,2,3 Hao Wu ,1,2,3 and Zhiwu Huang 1,2,3
 1
 Department of Otolaryngology-Head and Neck Surgery, Ninth People’s Hospital, Shanghai Jiao Tong University School of Medicine,
 Shanghai 200011, China
 2
 Ear Institute, Shanghai Jiao Tong University School of Medicine, Shanghai 200011, China
 3
 Shanghai Key Laboratory of Translational Medicine on Ear and Nose Diseases, Shanghai 200011, China
 4
 Department of Otolaryngology, Ren-Ji Hospital, Shanghai Jiao Tong University School of Medicine, Shanghai 200127, China

 Correspondence should be addressed to Hao Wu; wuhao@shsmu.edu.cn and Zhiwu Huang; huangzw86@126.com

 Received 16 March 2021; Revised 1 April 2021; Accepted 25 May 2021; Published 10 June 2021

 Academic Editor: Preston E. Garraghty

 Copyright © 2021 Minfei Qian et al. This is an open access article distributed under the Creative Commons Attribution License,
 which permits unrestricted use, distribution, and reproduction in any medium, provided the original work is properly cited.

 It is widely accepted that even a single acute noise exposure at moderate intensity that induces temporary threshold shift (TTS) can
 result in permanent loss of ribbon synapses between inner hair cells and afferents. However, effects of repeated or chronic noise
 exposures on the cochlear synapses especially medial olivocochlear (MOC) efferent synapses remain elusive. Based on a
 weeklong repeated exposure model of bandwidth noise over 2-20 kHz for 2 hours at seven intensities (88 to 106 dB SPL with 3
 dB increment per gradient) on C57BL/6J mice, we attempted to explore the dose-response mechanism of prolonged noise-
 induced audiological dysfunction and cochlear synaptic degeneration. In our results, mice repeatedly exposed to relatively low-
 intensity noise (88, 91, and 94 dB SPL) showed few changes on auditory brainstem response (ABR), ribbon synapses, or MOC
 efferent synapses. Notably, repeated moderate-intensity noise exposures (97 and 100 dB SPL) not only caused hearing threshold
 shifts and the inner hair cell ribbon synaptopathy but also impaired MOC efferent synapses, which might contribute to complex
 patterns of damages on cochlear function and morphology. However, repeated high-intensity (103 and 106 dB SPL) noise
 exposures induced PTSs mainly accompanied by damages on cochlear amplifier function of outer hair cells and the inner hair
 cell ribbon synaptopathy, rather than the MOC efferent synaptic degeneration. Moreover, we observed a frequency-dependent
 vulnerability of the repeated acoustic trauma-induced cochlear synaptic degeneration. This study provides a sight into the
 hypothesis that noise-induced cochlear synaptic degeneration involves both afferent (ribbon synapses) and efferent (MOC
 terminals) pathology. The pattern of dose-dependent pathological changes induced by repeated noise exposure at various
 intensities provides a possible explanation for the complicated cochlear synaptic degeneration in humans. The underlying
 mechanisms remain to be studied in the future.

1. Introduction manent threshold shift (PTS) [3, 12–16]. However, Kujawa
 and Liberman recently demonstrated that even a single acute
Noise-induced hearing loss (NIHL) is a global public health noise exposure at moderate intensity that induces temporary
issue. Hearing loss could be caused by genetic factors, aging, threshold shift (TTS) could result in permanent loss of rib-
infectious diseases, ototoxic drugs, and noise exposure [1–6]. bon synapses, which was then known as synaptopathy [17].
The reported mechanisms of noise-induced hair cells (HCs) Noise-induced cochlear synaptopathy has been the focus of
and spiral ganglion neuron damage mainly include mechan- attention in hearing research in these years. A number of
ical shearing forces and oxidative damage to HCs [7] and glu- studies further found that the loss of ribbon synapse between
tamate excitotoxicity to neurons [8–11]. In the past, noise cochlear inner hair cells and type I afferent nerve (AN) fibers
exposure was considered harmful only when it causes a per- usually accompanies the abnormal suprathreshold auditory

2 Neural Plasticity

brainstem response (ABR) [17–19]. More and more evi- 2.2. Repeated Noise Exposure Procedure. Noise exposure was
dences indicate that cochlear synaptopathy might not only performed by exposing conscious mice in a pie-shaped wire
be the primary mechanism of hidden hearing loss (HHL) cage separated by eight compartments, in a calibrated rever-
but also contribute to tinnitus and age-related hearing loss berating chamber as described previously [31]. Bandpass-
(ARHL) [20–23]. filtered noise of 2-20 kHz generated by MATLAB software
 Despite the large number of pathological studies involv- (version 2007b) was delivered for 2 hours by an amplifier
ing the effects of noise on the cochlear synaptopathy, most and loudspeaker (Yamaha) at seven gradients of intensity
of the previous studies paid attention to the single or acute from 88 to 106 dB SPL. We defined the groups of relatively
noise exposure that induced TTS with the loss of ribbon syn- low intensity (88, 91, and 94 dB SPL), moderate intensity
apses [17, 19, 24, 25]. Although repeated noise exposure is (97 and 100 dB SPL), and high intensity (103 and 106 dB
more common in human daily life (such as noise at bars, cin- SPL) in this study. An acoustimeter (type AWA6228+, Hang-
emas, concerts, and traffics), relatively few studies focused on zhou Aihua) was used to calibrate noise exposure to the tar-
the effects of repeated or chronic noise exposures on the get sound pressure level. The exposure procedure was
cochlear synaptopathy [26–28]. It remains inconsistent performed on seven exposed groups and their corresponding
whether repeated noise exposure would cause more damage control groups of mice for continuous seven days repeatedly.
on cochlear synapses, since the noise exposure procedure The baseline was set at the day before the first day of noise
and experimental animals in previous studies were quite exposure, ABRs were performed at baseline and 1 day and
various. For instance, 16-week-old Sprague-Dawley rats 14 days after NE, and DPOAEs were performed at baseline
exposed to 8-16 kHz octave-band noise at 97 dB SPL for and 14 days after NE. Animals were sacrificed 14 days after
2 hours in 4 repeated days did not produce similar ABR NE (aged seven weeks) for observation of cochlear morphol-
wave I amplitude decrement as acute noise exposure ogy using immunofluorescence (IF). Figure 1 shows the flow-
[27], while repeated white noise at 100 dB SPL for 2 hours chart of the repeated noise exposure procedure.
even cause additional cochlear damages in C57BL/6J mice
[26]. Moreover, a recent study suggested that the medial 2.3. ABR Tests. ABRs were performed at baseline and 1 day
olivocochlear (MOC) efferent feedback protects the and 14 days after the repeated noise exposure procedure.
cochlea from loss of ribbon synapses under the weeklong Mice were anesthetized with xylazine (20 mg/kg) and keta-
exposure to moderate-intensity noise (84 dB SPL) in mice mine (100 mg/kg) through intraperitoneal injection, and the
[29], while few studies reported chronic noise exposure- body temperature was maintained near 37°C using a heating
induced MOC efferent synaptic degeneration. blanket (Harvard Apparatus, USA, 55-7020). Recordings
 In this study, to explore the pattern of cochlear afferent were performed using three subcutaneous needle electrodes
and efferent synaptic degeneration induced by repeated noise at the vertex (active), left mastoid area (reference), and right
exposure, we used seven gradient levels of noise exposure at shoulder (ground), respectively. Short tone burst stimuli of 3
low, moderate, and high intensity. Auditory function and ms duration with 1 ms rise/fall times were generated by the
cochlear immunofluorescence were measured at baseline RZ6 workstation (Tucker-Davis Technologies, USA). Stimu-
and 1 day and 14 days post noise exposure to assess the path- lus sounds were delivered free-field via an MF-1 speaker
ological changes of ribbon and MOC efferent synapses in placed 10 cm away from the vertex, in front of the mouse.
C57BL/6J mice. We proposed a hypothesis that dose- Stimulus roved over frequencies of 32, 22.6, 16, 11.3, 8, and
dependent cochlear synaptic degeneration in C57BL/6J mice 4 kHz, and the sound level started from 90 to 0 dB sound
was induced by repeated noise exposure. pressure level (SPL) in 5 dB steps. For each ABR waveform,
 400 responses were collected and averaged. ABR thresholds
 were identified as the minimal stimulus level that evoked
2. Materials and Methods any noticeable recording of waveforms at each frequency.
 Wave I amplitudes (μV) were measured by averaging the Δ
2.1. Animals. C57BL/6J mice aged four weeks were obtained V of both sides of the peak using the BioSigRZ software
from the SIPPR-BK Laboratory Animal, Ltd. (Shanghai, (Tucker-Davis Technologies, USA). Thresholds and ampli-
China), which were derived from breeders originally pur- tudes were measured by a researcher who was blind to the
chased from The Jackson Laboratory. A total of about 82 information of mice in groups.
male mice were used in this study to exclude potential sex
differences in susceptibility to NIHL [30]. Animals were 2.4. DPOAE Tests. DPOAEs were performed at baseline and
divided into one control group and seven experimental 14 days after repeated noise exposure of groups 88 dB SPL
groups. Mice were housed under quiet laboratory condi- (representative low intensity) and moderate and high intensi-
tions, which showed normal baseline ABR, and distortion ties, by the DPOAE workstation with BioSigRZ software
product otoacoustic emission (DPOAE) thresholds were (Tucker-Davis Technologies). For recordings, the left exter-
included in subsequent noise exposure experiments. Each nal auditory meatus of mice was coupled to a ER10B+ micro-
group included 8-12 mice in the analyses. All experimental phone (Etymotic Research). Two MF-1 speakers were used to
procedures followed the Guide for the Care and Use of Lab- deliver equal intensity primary tones, and the frequency ratio
oratory Animals and were approved by the University (f 2 /f 1 ) was 1.2 of which [32]. The amplitude of distortion
Ethics Committee for Laboratory Animals of Shanghai Jiao product (DP) at the frequency 2f 1 ‐f 2 was collected and aver-
Tong University. aged 512 times, in response to centre frequencies at 8, 16, and
Neural Plasticity 3

 Low: 88, 91, 94 dB SPL
 Moderate: 97, 100 dB SPL
 High: 103, 106 dB SPL
 1 day 14 days
 Baseline Day 1 2 3 4 5 6 7 after NE after NE

 ABR Repeated noise ABR
 ABR DPOAE
 DPOAE 2-20 kHz, 2hrs, 7 days
 IF

Figure 1: Flowchart of the repeated noise exposure procedure. NE: noise exposure; ABR: auditory brainstem response; DPOAE: distortion
product otoacoustic emission; IF: immunofluorescence.

 CtBP2 SYP

 Ribbon synapes
 8 kHz MOC efferent
 synapes

 22.6 kHz
 16 kHz

 100 m 5 m 5 m

 (a) (b) (c)

Figure 2: Morphometric analysis of frequency located ribbon and MOC efferent synapses: (a) frequency mapping on the organ of Corti; (b)
ribbon synaptic counting; (c) MOC efferent synaptic measurement.

22.6 kHz presented from 80 to 20 dB SPL (in 5 dB incre- Images were acquired using a 40x water or 63x oil objective
ments). The DPOAE threshold was defined as the point lens on a LSM880 confocal microscope (Carl Zeiss, Ger-
where the DP can no longer be detected from noise [33]. many) with Z-stack scanning for 10 μm. The maximum
Thresholds were measured by a researcher who was blind intensity projection analysis was performed by using Zen
to the information of mice in groups. software (Carl Zeiss, Germany, version 3.0).
 2.6. Morphometric Analysis. In order to map the location of
2.5. Whole-Mount Cochlear Immunofluorescence. At 14 days specific frequency on the organ of Corti in mice, we used a
after the noise exposure procedure, mice in different noise- location-to-frequency relationship formula as previous stud-
exposed groups and nonexposed control groups were deeply ies described [34, 35]: d ð%Þ = 156:5‐82:5 × log ð f Þ, where d
anesthetized and sacrificed. Cochleae were immediately dis- is the percentage of the distance from the base and f is the
sected from temporal bones in 10 mM phosphate buffer frequency in kHz. For morphometric analysis, confocal
saline (PBS) solution (Sigma, USA) and then perfused with images at frequencies of 8, 16, and 22.6 kHz were mapped
4% paraformaldehyde (Sigma, USA) at 4°C overnight. The (Figure 2(a)). For ribbon synapses, spots of CtBP2 staining
fixed cochlea was decalcified in 10% ethylene diamine tetraa- under each IHC were counted, and the counts of 10 to 12
cetic acid (Sigma, USA) solution until it became boneless. continuous IHCs at a frequency were averaged for each sam-
The organ of Corti was dissected from the decalcified cochlea ple (Figure 2(b)). For MOC efferent synapses [36, 37], the
and then separated into three parts (the apical, middle, and area of SYP staining of each Z-stack maximum intensity pro-
basal turn) in the PBS solution. For immunofluorescence jection image was measured and calculated by using ImageJ
(IF), the tissue was blocked in 10% bovine serum albumin software (National Institutes of Health, USA, version 1.8.0),
solution with 0.3% Triton X-100 (Sigma, USA) for one hour which was expressed as the density of MOC efferent synapses
at room temperature. Primary antibodies mainly included of 5 to 6 continuous columns of three rows of outer hair cells
rabbit anti-myosin VIIa (Abcam, UK, 1 : 500), mouse anti- (OHCs) for each sample (Figure 2(c)).
CtBP2 immunoglobulin (Ig) G1 (BD Biosciences, USA, 1 :
200), and rabbit anti-synaptophysin (SYP) (Abcam, UK, 1 : 2.7. Data Processing and Statistical Analysis. Data processing
500). Secondary antibodies used were Alexa Fluor 633- and statistical analyses were performed using GraphPad
conjugated goat anti-mouse IgG1 and Alexa Fluor 488- Prism (GraphPad Software Inc., USA, version 8.0). Con-
conjugated goat anti-rabbit IgG (Invitrogen, USA, 1 : 200). tinuous variables are presented as the mean (standard
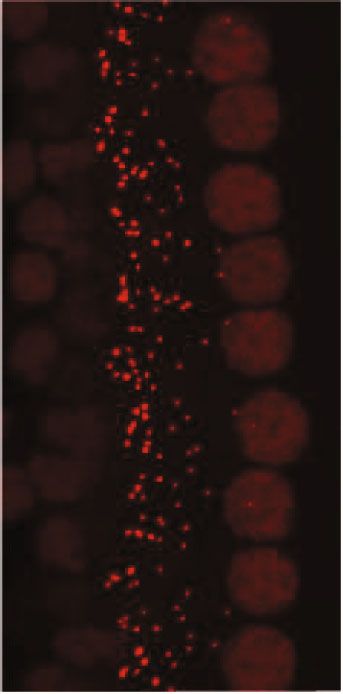
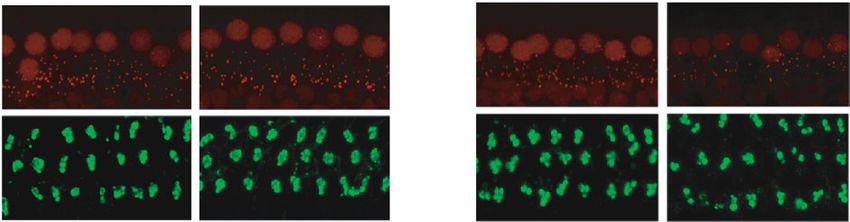
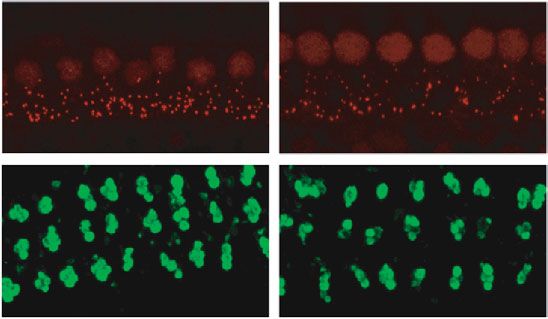
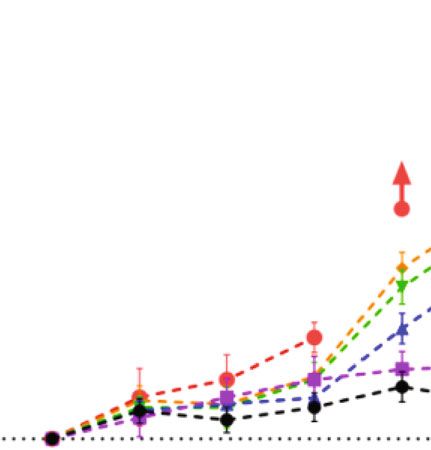
4 Neural Plasticity

 1 day after NE 14 day after NE
 60 60
 Threshold shift (dB) 50 50

 Threshold shift (dB)
 40 40

 30 30

 20 20

 10 10

 0 0

 –10 –10
 Control 88 91 94 97 100 103 106 Control 88 91 94 97 100 103 106
 Intensity of repeated noise exposure (dB SPL) Intensity of repeated noise exposure (dB SPL)

 4 kHz 16 kHz
 8 kHz 22 kHz
 11 kHz 32 kHz
 (a) (b)

Figure 3: Dose-response relations between repeated noise exposure intensities with ABR threshold shifts at 1 day (a) and 14 days (b) after NE.
The error bar represents the SEM for 8-12 mice in each group. Red arrows represent thresholds at 32 kHz frequency greater than 90 dB after
the noise exposure.

deviation, SD) in tables. Cumulative distributions were threshold shifts of ABR, we further analysed DPOAE thresh-
tested by using the Kolmogorov-Smirnov test. Two-way old shifts (representative group of 88 dB SPL, Supplementary
ANOVA with Bonferroni post hoc tests was used to com- Figure 1), ABR wave I amplitudes (Figures 4(a)–4(c)), ribbon
pare the difference between multiple groups. P value < synaptic counts (Figures 4(d) and 4(f)), and the density of
0.05 was considered statistically significant. In the figures, MOC efferent synapses (Figures 4(e) and 4(f)) at 14 days
the error bar represents standard error of the mean after repeated noise exposures, and no significant changes
(SEM), NS represents P > 0:05, ∗ represents P < 0:05, and of which were observed at neither 8 kHz, 16 kHz, nor 22.6
∗∗ represents P < 0:01. kHz frequencies.

3. Results 3.3. Moderate-Intensity Repeated Noise Exposure Impaired
 Cochlear Synaptic Morphology ahead of Function. For
3.1. Dose-Response Relations for Repeated Noise-Induced ABR moderate-intensity noise exposures, the group of 97 dB SPL
Threshold Shifts. ABR threshold shifts at 1 day after NE showed only TTSs at frequencies of 8, 16, and 22.6 kHz, while
(Figure 3(a)) and 14 days after NE (Figure 3(b)) for groups the group of 100 dB SPL showed more serious threshold
of repeated noise exposure at various intensities were mea- shifts than that in the 97 dB SPL group and even a PTS
sured over frequencies from 4 kHz to 32 kHz. No significant (ABR and DPOAE threshold shifts) at the frequency of
threshold shifts were observed in groups of low-intensity 22.6 kHz (Supplementary Figure 1). The frequency of 22.6
noise exposures at 88, 91, and 94 dB SPL at any frequency kHz was most vulnerable to repeated acoustic trauma on
except for 32 kHz (Table 1). Because the frequency of 32 ABR wave I amplitudes, ribbon synapses, and MOC
kHz in C57 mice was extremely vulnerable to hearing loss efferent synapses in groups of moderate-intensity noise
related to a genetic defect of cadherin in the stereocilia [38, exposures (Figures 5(c)–5(f)). Despite the considerable
39], this frequency was excluded from the following analyses degree of threshold shifts at 1 day after NE (averaged 21.82
in this study. For moderate- to high-intensity repeated noise dB for group 97 dB SPL and 30.5 dB for group 100 dB SPL),
exposures, threshold shifts at 1 day and 14 days after NE both 16 kHz was the most robust frequency against the synaptic
showed a more striking increase at higher frequencies with degeneration from repeated noise exposures at 97 dB SPL;
intensity, while no significant PTSs showed at the frequency however, it showed a mild but significant decrease of wave I
of 4 kHz even under the strongest noise exposure (106 dB amplitudes and ribbon synaptic counts in the 100 dB SPL
SPL) at 14 days after NE. Moderate-intensity noise exposures group (Figures 5(b) and 5(d)). Notably, changes at a
(97 and 100 dB SPL) induced significant threshold shifts over frequency of 8 kHz indicated that the lower moderate-
frequencies from 8 kHz to 22 kHz at 1 day after NE, but no intensity (97 dB SPL) repeated noise exposures induced the
significant PTSs of which except for the 22 kHz in the group cochlear ribbon and MOC efferent synaptic degeneration
of intensity at 100 dB SPL (Table 1). (Figures 5(d) and 5(e)) before ABR wave I amplitudes
 decreased (Figure 5(a)).
3.2. Not Significant Auditory Effects Induced by Low-Intensity
Repeated Noise Exposure. For groups of low-intensity noise 3.4. High-Intensity Repeated Noise Exposure Impaired Outer
exposures at 88, 91, and 94 dB SPL without significant Hair Cells despite Cochlear Synaptic Degeneration. In

Neural Plasticity

 Table 1: ABR threshold shifts at 1 day and 14 days after repeated noise exposure at various intensities.

 ABR threshold shifts (dB HL)
Intensity (dB SPL) 4 kHz 8 kHz 11.3 kHz 16 kHz 22.6 kHz 32 kHz
 Mean (SD) P value Mean (SD) P value Mean (SD) P value Mean (SD) P value Mean (SD) P value Mean (SD) P value
At 1 day after NE
 88 (n = 10) 4.00 (5.68) 0.3699 3.00 (8.56) >0.9999 4.00 (4.59) 0.7544 4.50 (4.97) 0.131 5.50 (6.85) 0.2018 6.00 (13.08) —
 91 (n = 11) 2.73 (6.07) >0.9999 6.00 (8.43) 0.357 5.00 (5.00) 0.5525 4.50 (9.26) >0.9999 5.00 (8.50) 0.6249 8.50 (11.32) —
 94 (n = 11) 4.55 (6.88) 0.474 8.50 (10.55) 0.2195 5.91 (6.25) 0.0883 8.50 (7.84) 0.0525 9.00 (9.37) 0.0877 14.55 (7.23) —
 97 (n = 12) 7.50 (7.54) 0.0664 10.00 (8.79) 0.0468 15.83 (7.64) 0.0381 21.82 (8.15) 0.9999 0.45 (8.79) >0.9999 10.91 (8.61) —
 94 (n = 11) 1.00 (8.43) >0.9999 2.00 (8.56) >0.9999 -1.00 (7.38) >0.9999 -1.00 (6.58) >0.9999 1.50 (10.55) >0.9999 12.73 (7.54) —
 97 (n = 12) 0.42 (5.42) >0.9999 1.67 (6.85) >0.9999 1.25 (6.78) >0.9999 -0.42 (4.98) >0.9999 6.25 (8.56) 0.321 — —
 100 (n = 10) 4.00 (6.99) 0.7272 2.50 (6.35) >0.9999 1.50 (5.30) >0.9999 4.00 (6.58) 0.6079 11.5 (9.44) 0.0273 — —
 103 (n = 12) 6.25 (8.56) 0.3317 2.92 (8.65) >0.9999 6.25 (8.01) 0.2999 20.42 (8.38) 0.0003 40.00 (9.29)

6 Neural Plasticity

 14 days post repeated low-intensity noise exposure
 4 4 4
 Wave I amplitude ( V)

 Wave I amplitude ( V)
 Wave I amplitude ( V)
 3 3 3
 NS
 NS
 2 2 2
 NS

 1 1 1

 8 kHz 16 kHz 22.6 Hz
 0 0 0
 50 60 70 80 90 50 60 70 80 90 50 60 70 80 90
 Sound pressure level (dB SPL) Sound pressure level (dB SPL) Sound pressure level (dB SPL)
 88 dB SPL-baseline 88 dB SPL-baseline 88 dB SPL-baseline
 88 dB SPL-NE14D 88 dB SPL-NE14D 88 dB SPL-NE14D
 91 dB SPL-baseline 91 dB SPL-baseline 91 dB SPL-baseline
 91 dB SPL-NE14D 91 dB SPL-NE14D 91 dB SPL-NE14D
 94 dB SPL-baseline 94 dB SPL-baseline 94 dB SPL-baseline
 94 dB SPL-NE14D 94 dB SPL-NE14D 94 dB SPL-NE14D

 (a) (b) (c)

 Control 88 dB SPL
 Ribbon MOC 22.6 kHz
 CtBP2
 25 0.4
 Ribbon synapses/IHC

 Density of MOC
 efferent synapses

 20 NS NS NS 0.3 NS NS
 NS
 15 NS
 0.2 NS
 10
 0.1
 5
 SYP
 0 0.0
 8 kHz 16 kHz 22.6 kHz 8 kHz 16 kHz 22.6 kHz
 Control 91 dB SPL Control 91 dB SPL
 88 dB SPL 94 dB SPL 88 dB SPL 94 dB SPL

 (d) (e) (f)

Figure 4: No significant permanent effects on (a–c) ABR wave I amplitudes, (d) ribbon synapse counts, and (e) MOC efferent synaptic
measurement post low-intensity (88, 91, and 94 dB SPL) repeated noise exposure. (f) Representative IF images of morphometric analysis
at frequency of 22.6 kHz (the scale bar indicates 10 μm). Two-way ANOVA with Bonferroni post hoc tests were used to compare the
difference between groups. The error bar represents the SEM for 8-12 mice in each group. NE14D: 14 days after NE; NS: no significance. ∗
P < 0:05; ∗∗ P < 0:01.

consideration of PTSs induced by repeated high-intensity degeneration induced by repeated noise exposure at various
noise exposures, we performed DPOAE tests and HC count- intensities from 88 to 106 dB SPL in a 3 dB step increment.
ing at 14 days post exposures. No significant loss of HCs was Despite numerous studies that have demonstrated noise-
found, even for the group of highest intensity (Supplemen- induced cochlear synaptic degeneration in various animal
tary Figure 2), while significant DPOAE threshold shifts models [18, 19, 25, 39–42], most of them used a single,
were essentially consistent with PTSs at frequencies of 8, short-duration noise exposure procedure extensively used
16, and 22.6 kHz for each group (Table 1 and Figure 6(a)). in CBA/CaJ mice, Sprague-Dawley rats, guinea pigs, etc.
In accordance with expectations, ABR wave I amplitudes The C57BL/6 strain mouse was not commonly used in previ-
and ribbon synaptic counts permanently reduced in high- ous NIHL studies, because it showed more severe ABR and
intensity noise-exposed groups (Figures 6(b)–6(e)). DPOAE threshold shifts at high frequencies compared with
However, to our surprise, the decrement of MOC efferent CBA mice [39, 43], which was attributed to the genetic defect
synapses was not significant after repeated noise exposures in the stereocilia of carrying Cdh23ahl alleles [38]. However,
at high intensities except for that at the frequency of 22.6 in recent years, since many laboratories have moved their
kHz in the 106 dB SPL group (Figures 6(f)–6(h)). mutant genes of interest to the C57BL/6 background [44],
 this strain was widely used for genetic studies, including
 many NIHL studies [45–47]. Moreover, previous strain com-
4. Discussion parisons revealed that C57 mice were more susceptible than
 CBAs in the older age group only [43], while a recent study
In this study, we explored and summarized the dose- indicated that the susceptibility of noise-induced cochlear
dependent pattern of cochlear functional and morphological ribbon synaptopathy in CBA mice was different from C57
Neural Plasticity 7

 14 days post repeated moderate-intensity noise exposure
 4 4 4

 Wave I amplitude ( V)
 Wave I amplitude ( V)
 Wave I amplitude ( V)

 3 3 3
 ⁎⁎
 ⁎⁎
 2 2 2 ⁎⁎ ⁎⁎

 1 1 1

 8 kHz 16 kHz 22.6 kHz
 0 0 0
 50 60 70 80 90 50 60 70 80 90 50 60 70 80 90
 Sound pressure level (dB SPL) Sound pressure level (dB SPL) Sound pressure level (dB SPL)

 97 dB SPL-baseline 97 dB SPL-baseline 97 dB SPL-baseline
 97 dB SPL-NE14D 97 dB SPL-NE14D 97 dB SPL-NE14D
 100 dB SPL-baseline 100 dB SPL-baseline 100 dB SPL-baseline
 100 dB SPL-NE14D 100 dB SPL-NE14D 100 dB SPL-NE14D

 (a) (b) (c)

 Control 97 dB SPL
 Ribbon MOC CtBP2 22.6 kHz
 25 0.4
 Ribbon synapses/IHC

 ⁎⁎ ⁎⁎
 efferent synapses
 Density of MOC

 20 ⁎⁎ ⁎⁎ ⁎⁎ 0.3 ⁎⁎ ⁎⁎ NS ⁎ ⁎
 15
 0.2
 10
 5 0.1
 SYP
 0 0.0
 8 kHz 16 kHz 22.6 kHz 8 kHz 16 kHz 22.6 kHz
 Control Control
 97 dB SPL 97 dB SPL
 100 dB SPL 100 dB SPL

 (d) (e) (f)

Figure 5: Moderate-intensity (97 and 100 dB SPL) repeated noise-induced permanent effects on (a–c) ABR wave I amplitudes, (d) ribbon
synapse counts, and (e) MOC efferent synaptic quantification. (f) Representative IF images of morphometric analysis for group 97 dB SPL
at a frequency of 22.6 kHz; white arrows indicate significant morphometric changes (the scale bar indicates 10 μm). Two-way ANOVA
with Bonferroni post hoc tests were used to compare the difference between groups. The error bar represents the SEM for 8-12 mice in
each group. NE14D: 14 days after NE; NS: no significance. ∗ P < 0:05; ∗∗ P < 0:01.

mice [31]. Thus, we chose to use young C57 mice aged four weeks in our results). The “low” intensities (up to 94 dB
weeks and followed up to the age of 7 weeks. In this study, SPL) of broadband noise used in this study are remarkably
we provided the characterization of repeated noise-induced higher than that of environmental sounds, which did not
injury to cochlear function, synaptic morphology, and their induce even temporary impairments on cochlear function
dose-response relationships in C57BL/6J mice. and synaptic morphology. These results could be supported
 by some previous studies. Morgan et al. [27] exposed
4.1. Smaller TTS Did Not Show Evidence of Cochlear or Sprague-Dawley rats to 8-16 kHz octave-band noise at 97
Synapse Pathology with Repeated Exposure. Given the com- dB SPL for 2 hours, which repeated for 4 consecutive days.
pelling evidence that even moderate noise exposure can They demonstrated that daily repeated exposures result in
result in cochlear synaptic degeneration, numerous studies diminished TTS and recovered thresholds; moreover, no per-
asked whether prolonged overexposure to various noise manent reduction in suprathreshold ABR responses was
levels that had been considered “harmless” would add signif- observed. Mannström et al. exposed female Sprague-
icant risk to NIHL [48, 49]. One challenge in understanding Dawley rats to 2-20 kHz broadband noise for 1.5 hours at
the cochlear consequence of noise is to overview damage pat- various intensities, which was repeated every six weeks. They
terns of the wide range of possible stimulus parameters. found that rats exposed to the repeated noise exposure at 101
Referring to human daily exposures, we wondered if cochlear and 104 dB SPL did not have any permanent impairment in
synaptic degeneration results from repeated exposures at thresholds or ABR wave I amplitudes in comparison with
lower SPLs. unexposed control rats [50]. Despite the species differences
 Overall, in this study, one-week long repeated noise in the noise dose required to generate cochlear injuries [51,
exposure at relatively low intensities seemed to be benign 52], our results suggested that in C57 mice [27], there is also
for young C57BL/6J mice during a moderate period (two a permissible dose of noise exposure that does not directly
8 Neural Plasticity

 14 days post repeated high-intensity noise exposure
 DPOAE 4 4
 4

 Wave I amplitude ( V)

 Wave I amplitude ( V)
 Wave I amplitude ( V)
 50
Thresholdshift(dB)

 40 ⁎⁎ 3 3 3
 30 ⁎⁎ ⁎⁎ ⁎⁎ ⁎⁎ 2
 ⁎⁎ 2 2 ⁎⁎
 ⁎⁎ ⁎⁎ ⁎⁎
 20 ⁎
 NS 1 1 1
 10
 0 8 kHz 0 16 kHz 0 22.6 kHz
 0
 8 kHz 16 kHz 22.6 kHz 50 60 70 80 90 50 60 70 80 90 50 60 70 80 90
 Sound pressure level (dB SPL) Sound pressure level (dB SPL) Sound pressure level (dB SPL)
 103 dB SPL
 106 dB SPL 103 dB SPL-baseline 103 dB SPL-baseline 103 dB SPL-baseline
 103 dB SPL-NE14D 103 dB SPL-NE14D 103 dB SPL-NE14D
 106 dB SPL-baseline 106 dB SPL-baseline 106 dB SPL-baseline
 106 dB SPL-NE14D 106 dB SPL-NE14D 106 dB SPL-NE14D

 (a) (b) (c) (d)

 Control 103 dB SPL Control 106 dB SPL
Ribbon synapses/IHC

 Ribbon MOC CtBP2 22.6 kHz CtBP2 22.6 kHz
 25
 Density of MOC

 0.4
 efferent synapses

 ⁎⁎ ⁎⁎ ⁎⁎ ⁎⁎ ⁎⁎ ⁎⁎
 20 0.3 NS ⁎
 15 NS
 0.2
 10
 5 0.1
 SYP NS SYP
 0 0.0
 8 kHz 16 kHz 22.6 kHz 8 kHz 16 kHz 22.6 kHz
 Control Control
 103 dB SPL 103 dB SPL
 106 dB SPL 106 dB SPL

 (e) (f) (g) (h)

Figure 6: High-intensity (103 and 106 dB SPL) repeated noise-induced permanent effects on (a) DPOAE, (b–d) ABR wave I amplitudes, (e)
ribbon synapse counts, and (f) MOC efferent synaptic quantification. Representative IF images of morphometric analysis for groups (g) 103
dB SPL and (h) 106 dB SPL at the frequency of 22.6 kHz; white arrows indicate significant morphometric changes (the scale bar indicates 10
μm). Two-way ANOVA with Bonferroni post hoc tests were used to compare the difference between groups. The error bar represents the
SEM for 8-12 mice in each group. NE14D: 14 days after NE; NS: no significance. ∗ P < 0:05; ∗∗ P < 0:01.

cause the significant TTS as well as the cochlear synaptic nerability to repeated noise-induced cochlear synaptic
degeneration. However, the long-term effects of accumulated degeneration was more remarkable at the higher frequency
noise-induced trauma in cochlea synapses should be further of 22.6 kHz and the lower frequency of 8 kHz, while the mid-
considered in future studies. dle frequency of 16 kHz was most robust against synaptic
 degeneration. For all frequencies, TTSs first occurred with
4.2. Damage Pattern of Repeated Noise Exposures. Noise- the increased doses of repeated noise exposure, which were
induced cochlear damage may take various patterns underly- not always accompanied by synaptic degeneration. More-
ing different degrees and mechanisms for reversible or per- over, the change of ribbon synaptic counts appeared to be
manent impairments. To date, the sustained cochlear consistent with MOC efferent synapses under low- and
damage across all mammalian species studies seems to prog- moderate-intensity noise exposure. However, PTSs accom-
ress similarly with the noise dose increase, which first occurs panied by damage on DPOAEs were more likely to result in
in IHC ribbon synapses, then the stereocilia, later the loss of loss of ribbon synapses rather than MOC efferent synapses
HCs and ANs [52, 53]. Different from the single octave band (Table 2). To our knowledge, this present study showed for
of noise extensively used in many previous studies [17, 18, the first time that repeated noise exposure leading to cochlear
22], we used the repeated broadband noise at intensities from synaptic degeneration could also cause reduction of MOC
97 to 106 dB SPL without producing significant loss of HCs, efferent synapses, which depended on the vulnerability of fre-
in order to focus on the cochlear synaptic degeneration and quency and function of OHCs.
dysfunction of OHC stereocilia (reflected on DPOAE) and As previous studies indicated, the relationship between
their vulnerability at various frequencies. Notably, we took threshold shifts at 1 day after NE criterion change and ABR
not only ribbon synapses but also MOC efferent synapses amplitudes or synaptic counts at each frequency was quite
into consideration of the cochlear synaptic degeneration. complicated [22, 51, 54, 55]. Among Sprague-Dawley rats,
 As expected, repeated noise-induced hearing threshold only the 8-16 kHz bandpass noise exposures producing TTSs
shifts in C57 mice were more severe at higher frequencies, at 1 day after NE greater than 30 dB could reduce ABR wave I
which should be attributed to the dysfunction or damage of amplitudes, while the degree of ABR wave I reduction was
OHC stereocilia. In this study, we further found that the vul- not related to the degree of threshold shifts [19]. However,
Neural Plasticity 9

 Table 2: Cochlear function and synaptic morphology changes related to repeated noise exposure at various intensities.

 Function Synaptic morphology
Frequency Intensity (dB SPL) Threshold shifts Threshold shifts Decreased ABR Ribbon MOC efferent
 at 1 day after NE at 14 days after NE wave I amplitude synaptopathy synaptic degeneration
 Low 88, 91, 94 (-) (-) (-) (-) (-)
 97 (+) (-) (-) (+) (+)
 Moderate
8 kHz 100 (+) (-) (+) (+) (+)
 103 (+) (-) (+) (+) (-)
 High
 106 (+) (+) (+) (+) (-)
 Low 88, 91, 94 (-) (-) (-) (-) (-)
 97 (+) (-) (-) (-) (-)
 Moderate
16 kHz 100 (+) (-) (+) (+) (-)
 103 (+) (+) (+) (+) (-)
 High
 106 (+) (+) (+) (+) (-)
 Low 88, 91, 94 (-) (-) (-) (-) (-)
 97 (+) (-) (+) (+) (+)
 Moderate
22 kHz 100 (+) (+) (+) (+) (+)
 103 (+) (+) (+) (+) (-)
 High
 106 (+) (+) (+) (+) (+)
(+) indicates significant change; (-) indicates nonsignificant change.

Maison et al. reported significant cochlear ribbon synaptopa- of the efferent fibers greatly exacerbated the ribbon synapto-
thy in CBA mice exposed to lower intensity but more pro- pathy in both basal and apical regions of the cochlea in
longed octave noise that only produced a 15 dB TTS [29]. CBA/CaJ mice under one-week exposure at 84 dB SPL [29].
Here, we found that the degree of threshold shifts at 1 day A recent study used mice with a gain-of-function point
after NE producing cochlear synaptic degeneration was par- mutation in the α9 subunit of the nicotinic acetylcholine
ticularly related to the frequency. Our results suggested that receptor, which strengthened cochlear suppression of the
approximately 10 dB at 8 kHz, 30 dB at 16 kHz, and 20 dB at MOC efferent system protecting the loss of ribbon synapses
22.6 kHz of threshold shifts at 1 day post exposure are able from acoustic injury [62]. The aging-induced MOC system
to result in permanent loss of ribbon synapses. Moreover, decline has been demonstrated in numerous previous stud-
the degree of threshold shifts at 1 day after NE progress fol- ies. The density of MOC efferent terminals decreased with
lowing PTSs was about 30 dB at 8 kHz and 22.6 kHz, which age prior to OHC degeneration, as measured by contralateral
was higher than 40 dB at a frequency of 16 kHz (Table 1). suppression (CS) of DPOAEs in humans and CBA mice [63,
The findings suggested that repeated or prolonged noise 64].
exposure might cause greater cochlear synaptic degeneration However, it remains unclear whether noise exposure
at lower and higher frequencies, in the order of ARHL pat- results in damage to MOC efferent nerves. Only a few studies
terns of IHC synapse loss observed in human temporal bones have focused on damage to efferent nerve endings following
[56, 57]. Fernandez et al. previously demonstrated that noise exposure. Although the previous work failed to observe
CBA/CaJ mice exposed to 8-16 kHz noise at 91 dB SPL for any effects on CS of acute recreational noise exposure in nor-
2 hours or 8 hours produced no loss of synapses at 16 kHz mal hearing threshold adults [65], Boero et al. first demon-
and below, while the synaptic loss increased with frequency strated that acute 1-16 kHz noise exposure at 100 dB SPL
for 8-hour exposure compared with the 2-hour exposure for 1 hour can produce degeneration of MOC terminals con-
[22]. Repeated exposures to the single noise that induced tacting the OHCs [60]. Consistently in this study, we first
only TTSs resulted in cumulative cochlear ribbon synaptopa- demonstrated that repeated noise exposure in C57 mice also
thy at frequencies of 16 kHz and above as well [58]. These results in MOC efferent synaptic degeneration. Our results
results suggested that repeated noise overstimulation proba- indicated that the MOC efferent synapses showed strong
bly accelerates the cochlear synaptic degeneration in the ani- resistance to noise damage, as well as partial protection from
mal model of ARHL [59]. ribbon synaptopathy at middle frequencies of 16 kHz
 (Table 2), in accordance with the distribution of MOC termi-
4.3. Potential Effects on MOC Efferent Synapses of Repeated nals as previous observations [63, 66]. Further studies to
Noise Exposure. It is widely accepted that the feedback from reveal repeated noise-induced functional changes of MOC
the MOC efferent system can protect cochlear ribbon synap- efferent nerves need to be performed in the future.
topathy from both acute and chronic noise exposures [29, 60, Notably, we found that various repeated noise-induced
61]. Maison et al. removed all efferent feedback to the inner effects on patterns of TTSs, PTSs, ABR wave I amplitudes,
ear by cutting the efferent bundles, whereas the sectioning ribbon, and MOC efferent synaptic degeneration were quite
10 Neural Plasticity

complex. For instance, although both ribbon and MOC effer- Supplementary Materials
ent synapses decreased at frequency of 8 kHz, ABR wave I
amplitudes reduced in group 100 dB SPL rather than 97 dB Supplementary Figure 1: representative low-intensity (88 dB
SPL (Figure 4). We proposed that the different damage pat- SPL) and moderate-intensity (97 and 100 dB SPL) repeated
terns may depend on balance of the degree of injury of vari- noise-induced DPOAE threshold shifts at 14 days after NE.
ous inner ear elements, especially the MOC efferent feedback. Two-way ANOVA with Bonferroni post hoc tests were used
Besides, repeated high-intensity noise exposures enabled to compare the difference compared with baseline. The error
production of PTSs unexpectedly resulting in slighter MOC bar represents the SEM for 8-12 mice in each group. NS: no
efferent synaptic degeneration than that under moderate- significance; ∗ P < 0:05. Supplementary Figure 2: whole-
intensity noise. These results suggested that noise-induced mount cochlear immunofluorescence at 14 days after 106
PTS may alter synaptopathic outcomes. Fernandez et al. dB SPL repeated noise exposure. No significant HC loss
recently assessed the dose-response effects on ribbon synap- was observed at frequencies of 8, 16, or 22.6 kHz. The scale
topathy and HC damage of acute 8-16 kHz octave-band noise bar indicates 20 μm. (Supplementary Materials)
exposure in CBA/CaJ mice. They also observed that higher-
level noise exposure producing mixed sensory and neural loss References
resulted in smaller synapse losses, despite greater declines in
suprathreshold ABR amplitudes [53]. Underlying mecha- [1] C. Zhu, C. Cheng, Y. Wang et al., “Loss of ARHGEF6 causes
nisms might involve HC injury attenuating the direct stimu- hair cell stereocilia deficits and hearing loss in mice,” Frontiers
lus on synapses, which protected them from synaptic in Molecular Neuroscience, vol. 11, p. 362, 2018.
excitotoxicity [17]. [2] S. Gao, C. Cheng, M. Wang et al., “Blebbistatin inhibits
 neomycin-induced apoptosis in hair cell-like HEI-OC-1 cells
 and in cochlear hair cells,” Frontiers in Cellular Neuroscience,
5. Conclusions vol. 13, p. 590, 2019.
In summary, we demonstrated the dose-dependent charac- [3] Y. Zhang, W. Li, Z. He et al., “Pre-treatment with fasudil pre-
terization of the repeated noise-induced injury to cochlear vents neomycin-induced hair cell damage by reducing the
function, synaptic morphology, and their complex dose- accumulation of reactive oxygen species,” Frontiers in Molecu-
 lar Neuroscience, vol. 12, p. 264, 2019.
response relationships in C57BL/6J mice. We proposed that
the noise-induced various cochlear damage patterns attribute [4] S. Zhang, Y. Zhang, Y. Dong et al., “Knockdown of Foxg1 in
to the balance of degrees of injury on HCs, ribbon and MOC supporting cells increases the trans-differentiation of support-
 ing cells into hair cells in the neonatal mouse cochlea,” Cellular
efferent synapses, etc. Notably, this study provided a sight
 and Molecular Life Sciences, vol. 77, no. 7, pp. 1401–1419,
into the hypothesis that the interruption in synaptic commu- 2020.
nication between MOC efferent terminals and OHCs,
 [5] F. Qian, X. Wang, Z. Yin et al., “The slc4a2b gene is
together with loss of ribbon synapses, contributes to pro-
 required for hair cell development in zebrafish,” Aging,
longed noise-induced cochlear synaptic degeneration. vol. 12, no. 19, pp. 18804–18821, 2020.
 [6] H. Zhou, X. Qian, N. Xu et al., “Disruption of Atg7-dependent
Data Availability autophagy causes electromotility disturbances, outer hair cell
 loss, and deafness in mice,” Cell Death & Disease, vol. 11,
The analysed data used to support the findings of this study no. 10, p. 913, 2020.
are included within the article; further inquiries are available [7] A. Dhukhwa, P. Bhatta, S. Sheth et al., “Targeting inflamma-
from the corresponding authors upon request. tory processes mediated by TRPVI and TNF-α for treating
 noise-induced hearing loss,” Frontiers in Cellular Neurosci-
Conflicts of Interest ence, vol. 13, p. 444, 2019.
 [8] R. Guo, M. Xiao, W. Zhao et al., “2D Ti3C2TxMXene couples
The authors declare that there is no conflict of interest electrical stimulation to promote proliferation and neural dif-
regarding the publication of this paper. ferentiation of neural stem cells,” Acta Biomaterialia, 2020.
 [9] L. Xia, Y. Shang, X. Chen et al., “Oriented neural spheroid for-
Authors’ Contributions mation and differentiation of neural stem cells guided by
 anisotropic inverse opals,” Frontiers in Bioengineering and
Minfei Qian and Qixuan Wang contributed equally to this Biotechnology, vol. 8, p. 848, 2020.
work. [10] Y. Yang, Y. Zhang, R. Chai, and Z. Gu, “A polydopamine-
 functionalized carbon microfibrous scaffold accelerates the
Acknowledgments development of neural stem cells,” Frontiers in Bioengineering
 and Biotechnology, vol. 8, p. 616, 2020.
This study was supported by the Natural Science Foundation [11] R. Guo, X. Ma, M. Liao et al., “Development and application of
of Shanghai Science and Technology Committee cochlear implant-based electric-acoustic stimulation of spiral
(20ZR1431200), the Elite Program of Shanghai Ninth Peo- ganglion neurons,” ACS Biomaterials Science & Engineering,
ple’s Hospital (JY201802), and the Shanghai Key Laboratory vol. 5, no. 12, pp. 6735–6741, 2019.
of Translational Medicine on Ear and Nose Diseases [12] A. Li, D. You, W. Li et al., “Novel compounds protect auditory
(14DZ2260300). hair cells against gentamycin-induced apoptosis by
Neural Plasticity 11

 maintaining the expression level of H3K4me2,” Drug Delivery, [28] Z. Zhang, L. Fan, Y. Xing et al., “Temporary versus permanent
 vol. 25, no. 1, pp. 1033–1043, 2018. synaptic loss from repeated noise exposure in guinea pigs and
[13] S. Sun, M. Sun, Y. Zhang et al., “In vivo overexpression of X- C57 mice,” Neuroscience, vol. 432, pp. 94–103, 2020.
 linked inhibitor of apoptosis protein protects against [29] S. F. Maison, H. Usubuchi, and M. C. Liberman, “Efferent
 neomycin-induced hair cell loss in the apical turn of the feedback minimizes cochlear neuropathy from moderate noise
 cochlea during the ototoxic-sensitive period,” Frontiers in Cel- exposure,” The Journal of Neuroscience, vol. 33, no. 13,
 lular Neuroscience, vol. 8, p. 248, 2014. pp. 5542–5552, 2013.
[14] Z. He, S. Sun, M. Waqas et al., “Reduced TRMU expression [30] Q. Wang, X. Wang, L. Yang, K. Han, Z. Huang, and H. Wu,
 increases the sensitivity of hair-cell-like HEI-OC-1 cells to “Sex differences in noise-induced hearing loss: a cross-
 neomycin damage in vitro,” Scientific Reports, vol. 6, sectional study in China,” Biology of Sex Differences, vol. 12,
 p. 29621, 2016. no. 1, p. 24, 2021.
[15] X. Yu, W. Liu, Z. Fan et al., “c-Myb knockdown increases the [31] H. Liu, H. Peng, L. Wang et al., “Differences in calcium clear-
 neomycin-induced damage to hair-cell-like HEI-OC1 cells ance at inner hair cell active zones may underlie the difference
 in vitro,” Scientific Reports, vol. 7, p. 41094, 2017. in susceptibility to noise-induced cochlea synaptopathy of
[16] Q. Wang, M. Qian, L. Yang et al., “Audiometric phenotypes of C57BL/6J and CBA/CaJ mice,” Frontiers in Cell and Develop-
 noise-induced hearing loss by data-driven cluster analysis and mental Biology, vol. 8, p. 635201, 2020.
 their relevant characteristics,” Frontiers in Medicine, vol. 8, [32] X.-Y. Zheng, D. Henderson, B.-H. Hu, D.-L. Ding, and S. L.
 p. 331, 2021. McFadden, “The influence of the cochlear efferent system on
[17] S. G. Kujawa and M. C. Liberman, “Adding insult to injury: chronic acoustic trauma,” Hearing Research, vol. 107, no. 1-
 cochlear nerve degeneration after "temporary" noise-induced 2, pp. 147–159, 1997.
 hearing loss,” The Journal of Neuroscience, vol. 29, no. 45, [33] K. E. Froud, A. C. Y. Wong, J. M. E. Cederholm et al., “Type II
 pp. 14077–14085, 2009. spiral ganglion afferent neurons drive medial olivocochlear
[18] G. Mehraei, A. E. Hickox, H. M. Bharadwaj et al., “Auditory reflex suppression of the cochlear amplifier,” Nature Commu-
 brainstem response latency in noise as a marker of cochlear nications, vol. 6, no. 1, 2015.
 synaptopathy,” The Journal of Neuroscience, vol. 36, no. 13, [34] M. Müller, K. . Hünerbein, S. Hoidis, and J. W. T. Smolders, “A
 pp. 3755–3764, 2016. physiological place-frequency map of the cochlea in the CBA/J
[19] E. LOBARINAS, C. SPANKOVICH, and C. G. LE PRELL, mouse,” Hearing Research, vol. 202, no. 1-2, pp. 63–73, 2005.
 “Evidence of "hidden hearing loss" following noise exposures [35] L. Yang, D. S. Chen, T. F. Qu et al., “Maximal number of pre-
 that produce robust TTS and ABR wave-I amplitude reduc- synaptic ribbons are formed in cochlear region corresponding
 tions,” Hearing Research, vol. 349, pp. 155–163, 2017. to middle frequency in mice,” Acta Oto-Laryngologica,
[20] L. D. Liberman and M. C. Liberman, “Dynamics of cochlear vol. 138, no. 1, pp. 25–30, 2018.
 synaptopathy after acoustic overexposure,” Journal of the [36] B. CANLON, A. FRANSSON, and A. VIBERG, “Medial olivo-
 Association for Research in Otolaryngology, vol. 16, no. 2, cochlear efferent terminals are protected by sound condition-
 pp. 205–219, 2015. ing,” Brain Research, vol. 850, no. 1-2, pp. 253–260, 1999.
[21] Y. Sergeyenko, K. Lall, M. C. Liberman, and S. G. Kujawa, [37] D. E. Vetter, M. C. Liberman, J. Mann et al., “Role of α9 nico-
 “Age-related cochlear synaptopathy: an early-onset contribu- tinic ACh receptor subunits in the development and function
 tor to auditory functional decline,” The Journal of Neurosci- of cochlear efferent innervation,” Neuron, vol. 23, no. 1,
 ence, vol. 33, no. 34, pp. 13686–13694, 2013. pp. 93–103, 1999.
[22] K. A. Fernandez, P. W. C. Jeffers, K. Lall, M. C. Liberman, and [38] R. R. Davis, J. K. Newlander, X.-B. Ling, G. A. Cortopassi, E. F.
 S. G. Kujawa, “Aging after noise exposure: acceleration of Krieg, and L. C. Erway, “Genetic basis for susceptibility to
 cochlear synaptopathy in "recovered" ears,” The Journal of noise-induced hearing loss in mice,” Hearing Research,
 Neuroscience, vol. 35, no. 19, pp. 7509–7520, 2015. vol. 155, no. 1-2, pp. 82–90, 2001.
[23] M. Qian, Q. Wang, L. Yang et al., “The effects of aging on [39] S.-N. Park, S.-A. Back, K.-H. Park et al., “Comparison of func-
 peripheral and central auditory function in adults with normal tional and morphologic characteristics of mice models of
 hearing,” American Journal of Translational Research, vol. 13, noise-induced hearing loss,” Auris Nasus Larynx, vol. 40,
 no. 2, pp. 549–564, 2021. no. 1, pp. 11–17, 2013.
[24] K. Hill, H. Yuan, X. Wang, and S. H. Sha, “Noise-induced loss [40] M. D. Valero, J. A. Burton, S. N. Hauser, T. A. Hackett,
 of hair cells and cochlear synaptopathy are mediated by the R. Ramachandran, and M. C. Liberman, “Noise-induced
 activation of AMPK,” The Journal of Neuroscience, vol. 36, cochlear synaptopathy in rhesus monkeys (Macaca mulatta),”
 no. 28, pp. 7497–7510, 2016. Hearing Research, vol. 353, pp. 213–223, 2017.
[25] A. C. Furman, S. G. Kujawa, and M. C. Liberman, “Noise- [41] M. Kobel, C. G. Le Prell, J. Liu, J. W. Hawks, and J. Bao,
 induced cochlear neuropathy is selective for fibers with low “Noise-induced cochlear synaptopathy: past findings and
 spontaneous rates,” Journal of Neurophysiology, vol. 110, future studies,” Hearing Research, vol. 349, pp. 148–154, 2017.
 no. 3, pp. 577–586, 2013. [42] C. D. Escabi, M. D. Frye, M. Trevino, and E. Lobarinas, “The
[26] Y. Luo, T. Qu, Q. Song et al., “Repeated moderate sound expo- rat animal model for noise-induced hearing loss,” Journal of
 sure causes accumulated trauma to cochlear ribbon synapses the Acoustical Society of America, vol. 146, no. 5, p. 3692, 2019.
 in mice,” Neuroscience, vol. 429, pp. 173–184, 2020. [43] K. K. Ohlemiller, J. S. Wright, and A. F. Heidbreder, “Vulner-
[27] D. S. Morgan, A. A. Arteaga, N. A. Bosworth et al., ability to noise-induced hearing loss in 'middle-aged' and
 “Repeated temporary threshold shift and changes in young adult mice: a dose-response approach in CBA, C57BL,
 cochlear and neural function,” Hearing Research, vol. 381, and BALB inbred strains,” Hearing Research, vol. 149, no. 1-
 p. 107780, 2019,. 2, pp. 239–247, 2000.
12 Neural Plasticity

[44] A. Kraev, “Parallel universes of Black Six biology,” Biology [60] L. E. Boero, V. C. Castagna, M. N. Di Guilmi, J. D. Goutman,
 direct, vol. 9, p. 18, 2014. A. B. Elgoyhen, and M. E. Gómez-Casati, “Enhancement of
[45] N. J. Ingham, S. A. Pearson, V. E. Vancollie et al., “Mouse the medial olivocochlear system prevents hidden hearing loss,”
 screen reveals multiple new genes underlying mouse and The Journal of Neuroscience, vol. 38, no. 34, pp. 7440–7451,
 human hearing loss,” PLoS biology, vol. 17, no. 4, 2018.
 p. e3000194, 2019. [61] G. Attanasio, M. Barbara, G. Buongiorno et al., “Protective
[46] M. R. Bowl, M. M. Simon, N. J. Ingham et al., “A large scale effect of the cochlear efferent system during noise exposure,”
 hearing loss screen reveals an extensive unexplored genetic Annals of the New York Academy of Sciences, vol. 884,
 landscape for auditory dysfunction,” Nature communications, pp. 361–367, 1999.
 vol. 8, no. 1, p. 886, 2017. [62] J. Taranda, S. F. Maison, J. A. Ballestero et al., “A point muta-
[47] K. K. Ohlemiller, S. M. Jones, and K. R. Johnson, “Application tion in the hair cell nicotinic cholinergic receptor prolongs
 of mouse models to research in hearing and balance,” JARO: cochlear inhibition and enhances noise protection,” PLoS Biol-
 Journal of the Association for Research in Otolaryngology, ogy, vol. 7, no. 1, article e18, 2009.
 vol. 17, no. 6, pp. 493–523, 2016. [63] L. D. Liberman and M. C. Liberman, “Cochlear efferent inner-
[48] S. G. Kujawa and M. C. Liberman, “Synaptopathy in the noise- vation is sparse in humans and decreases with age,” The Jour-
 exposed and aging cochlea: primary neural degeneration in nal of Neuroscience, vol. 39, no. 48, pp. 9560–9569, 2019.
 acquired sensorineural hearing loss,” Hearing research, [64] X. Zhu, O. N. Vasilyeva, S. Kim et al., “Auditory efferent feed-
 vol. 330, pp. 191–199, 2015. back system deficits precede age-related hearing loss: contra-
[49] P. M. Rabinowitz, D. Galusha, C. Dixon-Ernst, J. E. Clough- lateral suppression of otoacoustic emissions in mice,” Journal
 erty, and R. L. Neitzel, “The dose-response relationship of Comparative Neurology, vol. 503, no. 5, pp. 593–604, 2007.
 between in-ear occupational noise exposure and hearing loss,” [65] Q. Wang, L. Yang, M. Qian et al., “Acute recreational noise-
 Occupational and Environmental Medicine, vol. 70, no. 10, induced cochlear synaptic dysfunction in humans with normal
 pp. 716–721, 2013. hearing: a prospective cohort study,” vol. 15, p. 659011, 2021.
[50] P. M. Rabinowitz, D. Galusha, C. Dixon-Ernst, J. E. Clough- [66] S. F. Maison and M. C. Liberman, “Predicting vulnerability to
 erty, and R. L. Neitzel, “Repeated moderate noise exposure in acoustic injury with a noninvasive assay of olivocochlear reflex
 the rat—an early adulthood noise exposure model,” Journal strength,” The Journal of Neuroscience, vol. 20, no. 12,
 of the Association for Research in Otolaryngology, vol. 16, pp. 4701–4707, 2000.
 no. 6, pp. 763–772, 2015.
[51] R. A. Dobie and L. E. Humes, “Commentary on the regulatory
 implications of noise-induced cochlear neuropathy,” Interna-
 tional journal of audiology, vol. 56, no. sup1, pp. 74–78, 2017.
[52] S. G. Kujawa and M. C. Liberman, “Translating animal models
 to human therapeutics in noise-induced and age-related hear-
 ing loss377,” Hearing research, pp. 44–52, 2019.
[53] K. A. Fernandez, D. Guo, S. Micucci, V. De Gruttola, M. C.
 Liberman, and S. G. Kujawa, “Noise-induced cochlear synap-
 topathy with and without sensory cell loss,” Neuroscience,
 vol. 427, pp. 43–57, 2020.
[54] A. E. Hickox and M. C. Liberman, “Is noise-induced cochlear
 neuropathy key to the generation of hyperacusis or tinnitus?,”
 Journal of Neurophysiology, vol. 111, no. 3, pp. 552–564, 2014.
[55] J. B. Jensen, A. C. Lysaght, M. C. Liberman, K. Qvortrup, and
 K. M. Stankovic, “Immediate and delayed cochlear neuropathy
 after noise exposure in pubescent mice,” PLoS One, vol. 10,
 no. 5, p. e0125160, 2015.
[56] P. Z. Wu, L. D. Liberman, K. Bennett, V. De Gruttola, J. T.
 O'Malley, and M. C. Liberman, “Primary neural degeneration
 in the human cochlea: evidence for hidden hearing loss in
 the aging ear,” Neuroscience, vol. 407, pp. 8–20, 2019.
[57] L. M. Viana, J. T. O'Malley, B. J. Burgess et al., “Cochlear neu-
 ropathy in human presbycusis: confocal analysis of hidden
 hearing loss in post-mortem tissue,” Hearing research,
 vol. 327, pp. 78–88, 2015.
[58] Y. WANG and C. REN, “Effects of repeated “benign” noise
 exposures in young CBA mice: shedding light on age-related
 hearing loss,” Journal of the Association for Research in Otolar-
 yngology, vol. 13, no. 4, pp. 505–515, 2012.
[59] J. C. Alvarado, V. Fuentes-Santamaría, M. C. Gabaldón-Ull,
 and J. M. Juiz, “Age-related hearing loss is accelerated by
 repeated short-duration loud sound stimulation,” Frontiers in
 neuroscience, vol. 13, p. 77, 2019.
You can also read