DRAFT Valuing Crypto Assets - SobelCo
←
→
Page content transcription
If your browser does not render page correctly, please read the page content below
Valuing Crypto Assets
                  [DRAFT]

Abstract: This paper identifies three approaches to
valuing Crypto Assets. We review the three approaches,
1) cost of production, 2) equation of exchange and 3)
network value. We then propose a new model,
modifying the cost of production. Given the growing
popularity and value of the Crypto Asset market, we
add to the growing academic and professional research.

Key Words: Crypto Assets, Crypto Currency,
blockchain, bitcoin, value, ethereum, cost of
production, equation of exchange, network value,
Metcalfe’s Law

            Luigi D’Onorio Demeo, CVA
             Christopher Young, Ph.D.
DRAFT -- Valuing Crypto Assets, Luigi D’Onorio DeMeo, and Christopher Young
1.0 INTRODUCTION
There is a digital revolution taking place globally and words such as blockchain and bitcoin,
which are hallmark terms of this revolution, are permeating media sites, journals, government offices, and
the list goes on. Born from this digital revolution is a new yet burgeoning asset class broadly referred to
as Crypto Assets. The origin of Crypto Assets is approximately November of 2008, when a
pseudonymous entity referred to as Satoshi Nakamoto released a whitepaper titled, Bitcoin: A Peer-to-
Peer Electronic Cash System. This paper proposed a digital payment system that did not require a
singular, trusted third party but rather a network of incentivized participants. Bitcoin is typically referred
to as a Crytpo Currency. The underlying technology of Crypto Currencies is referred to as blockchain,
and it is this technology that has propelled the growth of the Cypto Asset market. The blockchain has
provided a new ability to build trusted decentralized products and services, with the intent of
disintermediating many of the larger business and government agents which have unilaterally controlled
most of society’s information and wealth. These new products and services developed on the blockchain,
yet which are not a Crypto Currencies, are referred to as Crypto Projects.
This Crypto Asset market is so avant-garde and business plans so different than traditional
business enterprises that it has created a need to reconsider the definitional concepts of revenue, expenses,
capital, taxable income, profit, shareholders, stakeholders and value identification to name only a few. In
this paper we consider the definition of value, and examine the currently proposed models to value Crypto
Assets. We identify benefits and shortcomings of these models, propose modifications to improve the
models, and then suggest additional considerations for future research.
This paper will progress in the following manner. First, we explain the major drivers of the
Crypto Asset market and identify and explain each of the Crypto Assets and how they work, and also
discuss the financing and public market for these assets. Next, we review the three most accepted
valuation models currently in use and then explain the benefits and shortcomings to each. Third, we
propose modifications and changes to the existing models and provide a detailed examination of how our
model works. Last, we propose a future research agenda, and questions that researchers may consider as
we further refine the models and develop a body of literature with substantial foundation.
2DRAFT -- Valuing Crypto Assets, Luigi D’Onorio DeMeo, and Christopher Young
2.0 EXPLAINING CRYPTO ASSETS
The Blockchain
To understand how the blockchain works can be quite difficult though a precursor for
understanding how value is created by companies in the Crypto Asset marketplace. The following is an
explanation of how the Bitcoin 1 blockchain works. It is important to note that all blockchains operate
differently, however we explain the Bitcoin blockchain mainly due to the enormity of media attention as
of the writing of this paper.
Unlike the traditional banking system, where a bank is trusted to maintain the ledger of
transactions (single ledger), the record of ownership to digital assets in a blockchain are known by the
entire population simultaneously (distributed ledger), removing the need to trust a single
entity. Transactions are completed peer-to-peer and broadcast through open-source software to all
computers 2 that maintain the distributed ledger. This distributed ledger is updated periodically and
information on the distributed ledger is saved in periods of time, typically referred to as a block (block of
time), and chained together through cryptography. Blocks are created when a miner 3 solves a difficult
mathematical problem. To solve these problems, miners employ computers that require a substantial
amount of processing speed and a signification amount of electrical power. We refer to this as
computational power. Upon successfully solving the mathematical problem, the miner will broadcast
their solution to the nodes and now has proof of its work. Once the nodes recognize that the problem was
solved and confirm that all information on the block is valid, the block is created, and chained to the
previous block. Since there is no central government authority issuing bitcoins (such as the Federal
Reserve), the underlying blockchain software is programmed where after each block is created, the miner
who solved the underlying mathematical problem is rewarded with newly created bitcoin.
1
NOTE: In this paper we use bitcoin, lower case b to represent the crypto currency, and Bitcoin, upper case B to
represent the Bitcoin protocol.
2
NOTE: These computers are also referred to as nodes, but for purposes here we will refer to them as simply
computers.
3
NOTE: A miner is a computer which organizes transactions into chronological order. These computers are tasked
with solving a resource intensive math problem and, if they do, are rewarded in coins. This process is similar to that
of a gold miner that needs to run machinery to “mine” gold from the Earth and are rewarded with Au or gold.
3DRAFT -- Valuing Crypto Assets, Luigi D’Onorio DeMeo, and Christopher Young
The Bitcoin protocol targets creating blocks every 10 minutes, on average 4. This is done by using
what is referred to as the difficulty algorithm. If the mathematical problems are solved in less than ten
(10) minutes, the difficulty of the mathematical problem increases, and if the block takes longer than ten
(10) minutes, the difficulty is decreased. The mathematical problem is constructed so computational
power is required to solve it. This is designed so that the miners 5 have an economic cost associated with
working on the blockchain, and will be incentivized to operate based on the rules of the protocol. Should
a miner attempt to break the rules, they will lose the opportunity to win the bitcoin. As miners incur
energy costs, they will seek profit by winning bitcoins by way of block rewards and transaction fees. As
miners accumulate bitcoin they can do two things with it. They can sell their bitcoin on a crypto
exchange, such as Coinbase, sell their bitcoin directly to another individual, or hold it in anticipation of
bitcoin increasing in value. Because of this, miners are aligned with the success of the Bitcoin protocol
and are aligned with further development and wide adoption of its use.
Crypto Assets
With so many new terms and references, it can be confusing to follow the Crypto Asset market.
To help understand how this works consider the following. The blockchain is the technology
infrastructure and Crypto Assets are the native tokens created to be used over the blockchain. As
explained earlier, Crypto Assets can be delineated into Crypto Currencies, Crypto Commodities and
Crypto Projects. A Crypto Currency is a digital asset that acts predominately as a medium of exchange,
unit of account, and store of value. While Crypto Currencies act as a means to transmit monetary value,
Crypto Commodities are digital assets used as inputs to perform services or create finished goods. For
example, cloud storage and online bandwidth are two examples of digital commodities that help to
provision a service. This is similar to a traditional commodity such as oil which can is typically used to
power machinery. In an ever more digital economy, there is a need for Crypto Currencies to serve as a
means to transmit monetary value and Crypto Commodities to power the creation of digital finished
goods. Last, Crypto Projects are the digital finished goods and services. As applications are built using the
blockchain, Crypto Projects are needed as a consumer-facing digital asset. Similar to how traditional
applications are built using Apple IOS or Android, Crypto Projects are built on top of Ethereum or a
similar protocol. Although Bitcoin is a protocol, the original creators did not allow any development on
4
NOTE: Other protocols, such as Ethereum, target a much faster creation protocol.
5
NOTE: In this context we are talking about the shareholders of the company who has the computers employed, and
who are using these computers to mine.
4DRAFT -- Valuing Crypto Assets, Luigi D’Onorio DeMeo, and Christopher Young
top of it. There are presently over 1,000 Crypto Assets actively trading on exchanges and at the time of
writing worth over $500 billion 6.
Financing Crypto and the New Challenges
Today, most entrepreneurs raise capital for their companies in the form of angel, venture and/or
friends and family capital. Most of these capitals are invested directly into the company seeking the
capital, and in return for the investment, these investors most often receive equity and/or notes in return.
As entrepreneurial companies mature, many of them continue to raise capital in subsequent
rounds of equity or debt sales. While for some companies this continues indefinitely with growth, others
become cash flow sustainable and have no need for additional financing. For many entrepreneurs and
shareholders (generally speaking – but not including everyone) the ultimate event is a successful sale of
the company in the public stock markets or by sale in a private transaction. With the evolution of
blockchain technologies, there is a new type of financing emerging giving entrepreneurs a different
avenue to raise capital. Will this new financing mechanism be sustainable is unclear but for the short
term it is something to consider.
Although many Crypto Assets have raised equity and debt capital from angel, venture,
crowdsourcing and friends and family, they have relied mostly on a new form of financing typically
referred to as an ICO (initial coin offering) or token sale. The token sale is a process where a Crypto
Asset company creates a digital asset called a token, and then sells the tokens to investors or future users
of the company’s services. In exchange for the token, the issuing company receives cash, mainly for
development purposes.
Although it is very early in the evolution of the token sale, many Crypto Asset companies using
this form of financing have typically raised capital selling one of three types of tokens. Tokens are
usually referred to as utility, security or hybrid tokens. Utility tokens are tokens that provide the
purchaser access to a good or a service, which in most situations, have yet to be developed. Many times
utility tokens provide the user the opportunity to gain access to some online platform, or may entitle them
to special privileges or deals on future goods and services offered by the company or it may provide them
a mechanism for exchanges. A security token is different and resembles something like a common stock,
6
“Cryptocurrency Market Capitalizations”, https://coinmarketcap.com/, December 10, 2017.
5DRAFT -- Valuing Crypto Assets, Luigi D’Onorio DeMeo, and Christopher Young
where token holders may have rights to future profits or sales of the company, or perhaps liquidation
preferences and or other rights. In many instances, security tokens have rights that are similar, but most
often inferior, to rights afforded the debt or equity holders. The last type of token is the hybrid, which has
attributes associated with utility and security tokens. Although we do not address the issue within this
paper, the Securities and Exchange Commission and the Internal Revenue Service, among other
government authorities have expressed interest in how tokens are defined.
Token Marketplace
A distinguishing feature of tokens is with respect to liquidity. Most often, an early investor or
debtor in a private company has limited ability to sell their equity or debt to another party. Unlike these
traditional forms of capital, most often, companies issuing tokens list their tokens on a public exchange,
such as Bitfinex, Poloniex, Kraken, Gemini, Hitbtc, and Gdax. Because of this, token owners can sell
their tokens over the exchange at the market price. This applies for all Crypto Assets.
Token Buyers and Investors
There are three types of token buyers. There is the buyer who purchases a token for access to a
company’s software or services or future use as a commodity or medium of exchange. Second, there is
the buyer who anticipates an increase in the token’s value and so is looking for a return on investment.
This return may be in the form of periodic benefits or some gain on an exit event. Lastly, there are buyers
who hope to accomplish both goals simultaneously.
Additionally and not dissimilar to early stage companies granting stock options or shares to
employees and partners, many companies issuing tokens do the same thing, but rather than issuing shares
they are granting tokens. Many times these tokens are granted at once and other times they vest over a
period of time. This new phenomenon of selling or issuing tokens and the subsequent ability to sell these
tokens on a public exchange creates a host of valuation issues for the issuing company, the owner of the
token and future token holder. A few often overlooked valuation issues include but are not limited to the
value of the token on gift or grant to the employee, the value of the token during an exchange, the value
of tokens for the future buyers, and the value of tokens in a hypothetical acquisition. Other considerations
that have not been given their due in the literature is with respect to valuing tokens for IRS tax reporting
purposes, or for FASB financial reporting purposes – each of which will probably encompass its own
body of valuation research.
6DRAFT -- Valuing Crypto Assets, Luigi D’Onorio DeMeo, and Christopher Young
Underlying each of these purchasing decisions is an inquiry into value. Is the company selling
the initial token at the right price? Is the buyer of the token on the secondary market purchasing the token
at an inflated or deflated price? Unlike the equity or debt markets where financial models such as the
discounted cash flow model or capitalization of earnings model have been broadly adopted there is almost
no consensus on how tokens can and or should be valued. It is these questions which we now turn.
3.0 EXISTING MODELS
There is an emerging body of industry insights and economic research associated with valuing
Crypto Assets, with a major portion of the research focused on valuing bitcoin or ether. Most of these
insights and research come from academics, though some of the research comes from the financial
services community, and although less common, a smattering of the insight comes from a small group of
blockchain sub-culturalists. Based on a detailed literature search, we have found three approaches to
valuing Crypto Assets: (1) cost of production, (2) value as a currency and (3) the value as a network. We
review each approach below.
Cost of Production Approach
Adam Hayes, a Ph.D. student at The New School for Social Research has produced a series of
empirical papers 7 on valuing Crypto Assets. The observations from his research suggest that there are
three (3) variables that can determine approximately 84% of the value of Crypto Assets: (1)
computational power, (2) rate of coin production, and (3) the relative difficulty of the mining algorithm.
Hayes proposes that the marginal revenue of mining bitcoin should be greater than or equal to the
marginal cost, suggesting simply that the minimum market value of bitcoin should be the cost to
produce. 8
Hayes suggests that bitcoin has intrinsic value. While bitcoin is intangible, it has similar
attributes to traditional commodities, such as labor value. Mining for bitcoin requires the use of
electricity to win bitcoins which can be viewed similarly to running an oil rig in search for oil. Hayes
7
SOURCE: “What Factors Give Cryptocurrencies Their Value,” Adam S. Hayes, March, 2015: “Cryptocurrency
Value Formation: An Empirical analysis leading to a Cost of Production Model for valuing bitcoin,” Hayes, Adam,
May 2016; “Bitcoin price and its Marginal Cost of Production: supporting evidence,” Adam S. Hayes, September
2017.
8
SOURCES: ibid, pp.1-21.
7DRAFT -- Valuing Crypto Assets, Luigi D’Onorio DeMeo, and Christopher Young
states that “instead of approaching bitcoin as a digital money or currency, it is perhaps more appropriate
to consider it a virtual commodity with a competitive market against producers.” 9 Hayes argues that the
more mining power employed the more acceptance of the Crypto Asset. A Crypto Asset with no
acceptance or usage will have neither value nor computational power directed at it. A rational miner
would only employ mining resources if profitable, and therefore if the marginal cost of mining exceeded
the marginal revenue of mining, that miner would redeploy resources and thus removing computational
power from the network.
According to Hayes, any opportunities for excess returns are short-lived as competition drives
down profit. This is based on two forces, 1) Miners seek and mine for the most profitable coin which
raises the aggregate network hashing power 10 in that coin, causing the difficulty to increase. 2) As the
difficulty increases, profitability falls per unit of mining effort and the market exchange rate will change
as mining participants actively produce and subsequently sell relatively overpriced coins.
The variables in Hayes’ formula are: 1) the cost of electricity, measure in cents per kilowatt-
hour; 2) the energy consumption per unit of mining effort, measured in watts per GH/s; 3) the monetary
price of bitcoin in the market; and 4) the difficulty of the bitcoin algorithm. Using established
microeconomic theory, the marginal product of mining should theoretically equal its marginal cost in
competitive markets, which should also equal selling price. Therefore, Hayes proposes the following
formula,
$P = Eday / BTC / day,
where,
$P is expressed in dollars per bitcoin,
Eday is the cost of mining per day, and
BTC/day is the expected number of coins to be mined per day on average.
Hayes applies this formula in his 2017 paper, back-testing the model using historically observed
bitcoin price data as compared to what the implied model price would have been at the time. After
completing a multi-variable ordinary least squares regression, he suggests that nearly 92% of bitcoin’s
9
SOURCE: ibid, p. 13.
10
NOTE: Hashing power is the aggregate computational power being applied to the network at a given time. It is
also referred to as mining effort, hashrate, or hashpower.
8DRAFT -- Valuing Crypto Assets, Luigi D’Onorio DeMeo, and Christopher Young
observed market price can be explained by the cost of production model. To understand causality, Hayes
relies on a Granger Test 1112, and finds that the cost of production model predicts market price. 13
Valuing a Crypto Asset as a Currency
In Cryptoassets: The Innovative Investors Guide to Bitcoin and Beyond, co-author Chris Burniske
proposes valuing Crypto Assets using the Equation of Exchange formula, originally developed by Irving
Fisher 14. This equation was originally developed to predict the value of a currency based on the
acceptance and speed of economic transactions in the macro-economy. The equation of exchange is
commonly seen as the formula, MV=PQ, however Burniske argues that a Crypto Asset valuation is
largely comprised of solving for M, and thus the formula is rearranges as follows,
M=PQ/V,
where,
M = size of the monetary base necessary to support a cryptoeconmy of size PQ, at Velocity V,
V = velocity of the asset,
P = price of the digital resource being provisioned, and
Q = quantity of the digital resource being provisioned.
Burniske, in his model conducts a total addressable market (TAM) analysis, used typically in
traditional finance for analyzing start-up companies. A TAM analysis is a top-down approach to value,
starting with the total size of a market and attempting to ascertain what share of the market the specific
asset being valued will obtain. To value bitcoin, Burniske emphasizes the importance of determining the
size of the addressable market, what share bitcoin will take from that market, what bitcoin’s velocity will
be, and what the appropriate discount rate is. 15
Using bitcoin as an example, and assuming that bitcoin services the entire remittances market of
$500 billion and had a velocity of 5. Dividing $500 billion (PQ) by a velocity of 5 (V) would yield a total
value of bitcoin of $100 billion (M). If we assumed 21 million coins outstanding, then the value per each
11
NOTE: A Granger test is a statistical hypothesis test for determining whether one time series is useful in
forecasting another.
12
SOURCE: "Investigating Causal Relations by Econometric Models and Cross-spectral Methods", Granger, C. W.
J.,1969, pp. 424–438.
13
SOURCE: “Bitcoin price and its marginal cost of production: supporting evidence,” Adam S. Hayes, September
2017, pp. 6-9.
14
SOURCE: 5 SOURCE: “David Hume and Irving Fisher on the Quantity Theory of Money in the Long Run and the
Short Run” Dimand, Robert W, (2013) European Journal Of The History Of Economic Thought 20, no. 2: 284-304.
15
SOURCE: ibid, p. 178.
9DRAFT -- Valuing Crypto Assets, Luigi D’Onorio DeMeo, and Christopher Young
bitcoin would be $4,762. Burniske also argues that bitcoins value is additive depending on the number of
use cases it serves. For example, the global gold market is worth $2.4 trillion and bitcoin were to take
10% market share, then it would need to store $240 billion of value. Holding bitcoin as digital gold has a
velocity of 1 because there is minimal turnover, thus $240 billion/1=$240 billion. Once again assuming
21 million coins, then each bitcoin would need to store $11,430 of value to meet the demand of 10% of
the investable gold market. Considering this, if bitcoin were to act as a digital goal and represent the
remittances market, then the values would need to be added, $4,762 + $11,430 = $16,192 per each
bitcoin. 16 Burniske provides a valuation model for bitcoin in his book that was not built by him, but
follows the same premise of his valuations. 17
Valuing a Crypto Asset as Network
The third method for valuing Crypto Assets uses a theorem proposed by the founder of Ethernet,
Robert Metcalfe. Metcalfe proposed that the value of a network is proportional to the square of the nodes,
or users on the network multiplied by . Research conducted suggests that the relationship when applied to
large social networks may be accurate. Metcalfe attempted to validate his findings in a 2013 paper using
Facebook as a proxy. The theory is that a network has little or no value with just one or two users,
however with each new user, the utility value of the network more than doubles.
In his paper Digital Blockchain Networks Appear to be Following Metcalfe’s Law, Ken Alabi
Ph.D. suggests that the value of bitcoin can be measured by relying on Metcalfe’s Law. Alabi uses three
(3) different Crypto Assets as examples, Bitcoin, Ethereum, and Dash. 18 Alabi suggested using the
number of unique addresses participating daily in the network as a proxy for the relative number of active
users on the network. Alabi proposed a variation of Metcalfe’s Law, based on the exponent of the root of
the number of active users. Using past Crypto Asset data, Alabi shows that historical market prices do in
fact follow the model. 19
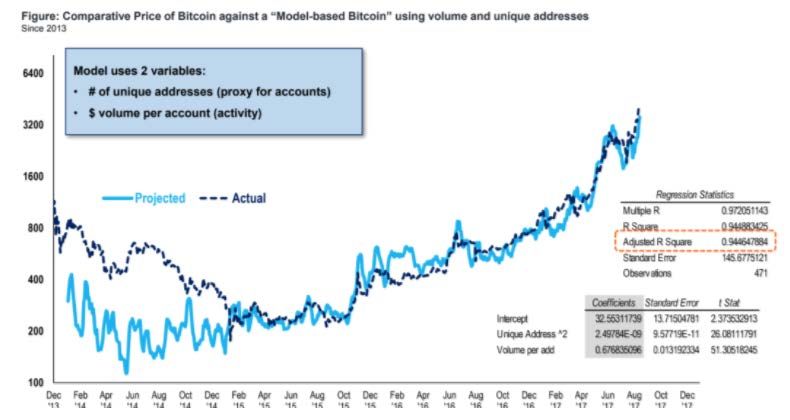
In addition to Alabi’s research, FundStrat’s co-founder Tom Lee (Lee), a former strategist at J.P.
Morgan uses a similar method. Lee stated in a recent interview with Business Insider that, “If you build a
very simple model valuing bitcoin as the square function of the number of users multiplied by the average
16
SOURCE: “CryptoAssets: The Innovative Investor’s Guide to Bitcoin and Beyond,” Chris Burniske & Jack Tatar,
-McGraw-Hill, 2018, pp. 174-179.
17
SOURCE: ibid, p. 181.
18
SOURCE: “Digital Blockchain Networks Appear to be following Metcalfe’s Law” Alabi, Ken, 2017, pp.23-29.
19
SOURCE: ibid, pp.23-29.
10DRAFT -- Valuing Crypto Assets, Luigi D’Onorio DeMeo, and Christopher Young
transaction value, 94% of the bitcoin movement over the past four years can be explained by that
equation.” 20 The following is a formula for calculating the value of bitcoin.
Value of bitcoin = Unique Addresses2 * $ volume per account
Where,
Unique Addresses represent the number of unique bitcoin addresses participating on the network per day
$ volume per account represents bitcoin transaction volume per day
We present a graph created by Lee below which displays the relationship between his model’s outcome
and that of the market price of bitcoin.
Figure 1: Fundstrat Comparative Bitcoin vs Model-based Bitcoin Price 21
4.0 PUSHING THE MODEL FORWARD
20
SOURCE: “Bigger than Bitcoin,” Business Insider, http://www.businessinsider.com/bitcoin-price-movement-
explained-by-one-equation-fundstrat-tom-lee-metcalf-law-network-effect-2017-10.
21
SOURCE: “Bigger than Bitcoin,” Business Insider, http://www.businessinsider.com/bitcoin-price-movement-
explained-by-one-equation-fundstrat-tom-lee-metcalf-law-network-effect-2017-10.
11DRAFT -- Valuing Crypto Assets, Luigi D’Onorio DeMeo, and Christopher Young
As explained above, bitcoin can be valued similar to a commodity, currency or network.
However we believe that bitcoin, in its current form, is not an effective medium of exchange since fees
for small transactions can at times be larger than the value of the transaction itself. Because of this,
bitcoin is not an effective currency today in the traditional sense and so valuing it as a currency does not
seem appropriate. Valuing a network using Metcalfe’s law is an intriguing approach that in our opinion
solves for price rather than value since the model only applies two variables, average transaction value
and number of unique addresses and it does not consider the impact that costs have on value.
We suggest that Hayes’ approach to valuing bitcoin is the most appropriate model based on the
above commentary but his model can be enhanced with forecasting future variables. We have attached
our model with preliminary assumptions and we provide a multi-year view into the value of bitcoin based
on growth and risk. Our model begins on January 1, 2018 and ends on December 31, 2029.
We present this model in Exhibit A. Our approach is to create a forward looking Marginal Cost of
Production model by forecasting key assumptions such as energy efficiency, cost of electricity, difficulty
and then discounting the value to the present. In forecasting the assumptions, we looked to historical
trends while recognizing that more research is needed. In Exhibit B, Cell E4 through P4, the bitcoin
miner reward is displayed. Every four years, the bitcoin block reward halves (halving) as per the Bitcoin
Protocol 22. This is an input in calculating the expected BTC per day. Next we make assumptions to
forecast energy efficiency, cost of electricity, and aggregate hash rate growth.
With respect to the cost of electricity, we looked at U.S. CPI data dating back to 1978 which can
be viewed in Exhibit B. We found that the electricity price per kWh in the U.S. has grown at a 2.9%
compound annual growth rate (CAGR) from 1978 to 2017. We assume this growth rate into the future, as
shown in Exhibit A, cell B6.
We next forecast energy efficiency, also referred to as energy consumption per unit of mining
effort, as measured in watts per GH/s (gigahashes per second). In Figure 1 of Hayes’ 2016 paper, a graph
of Bitcoin Mining Efficiency is shown from 2009-2016. In 2010, bitcoin mining was conducted primarily
using GPU (Graphics Processing Unit) which had efficiency of 455 watts per GH/s. Presently ASICs
22
SOURCE: “Understanding Bitcoin: Cryptography, Engineering and Economics” Franco, Pedro, October, 2014.
Wiley.
12DRAFT -- Valuing Crypto Assets, Luigi D’Onorio DeMeo, and Christopher Young
(Applied-specific integrated circuit) have been designed specifically for bitcoin mining, and operate at an
efficiency of .20 watts per GH/s. Considering this, we can calculate that efficiency has improved by
66.9% yearly from 2011-2017, [((.20 / 455) (1 / 7) – 1) =66.9% 23] This efficiency improvement is faster
than what would be suggested by Moore’s Law, which is the observation that the number of transistors in
a dense circuit board double every two years. In our model, we assume a 50% increase in efficiency per
year (Exhibit B, cell B6), consistent with Moore’s Law as the advent of ASICs will likely slow the pace
of efficiency increase.
Bitcoin’s difficulty algorithm is one of the more challenging assumptions to forecast. The
difficulty algorithm is a function of the aggregate hash rate sent to the network, or computational power.
As previously mentioned, the higher the hash rate, the more acceptance of the coin, and thus a higher
value can be inferred. We look to historical annual growth rates of bitcoin’s aggregate hash rate, which
can be viewed in the graph below. The yearly growth rate of approximately 275% for the past two years
demonstrates the maturing of bitcoin. Yearly growth rates typically decline for new market entrants as
they mature, whether it would be revenue growth for a startup or the growth in an economy. Hash rate
annual growth rates for 2013 and 2014 were 9,339% and 9,428% respectively. Since then, the annual
growth rate has declined to 187% in 2015 and is presently 280%. Given the technical innovation in ASIC
mining hardware, it is probable that the annual growth rate of aggregate hash rate will decrease after
2018. In Exhibit B, Cell F9 we assume a 300% starting growth rate in 2018 and cut that rate by 10% (Cell
B8) yearly.
23
SOURCE: “Cryptocurrency Value Formation: An empirical analysis leading to a cost of production mode for
valuing Bitcoin,” Adam S. Hayes, May 2016, Figure 1, p. 19.
13DRAFT -- Valuing Crypto Assets, Luigi D’Onorio DeMeo, and Christopher Young
Graph 1: Annual Hash Rate Growth (bitcoin)
7,000,000,000 300%
6,000,000,000 250%
5,000,000,000
200%
4,000,000,000
150%
3,000,000,000
100%
2,000,000,000
1,000,000,000 50%
- 0%
2015 2016 2017
Hashrate Annual Growth
After applying these assumptions, we calculate the two main components of the formula, cost of
mining per day and expected BTC per day, consistent with Hayes’ method. Cost of mining per day is
calculated as [watts per GH * $/kWh] which we show in cell E10 in Exhibit B for 2017. After calculating
cost of mining per day, the expected BTC/day is calculated using the formula, [((Sec/day) / (difficulty*
232 / 1,000,000,000,000))*block reward], where,
Sec/day = is a constant representing seconds in a day (86,400),
Difficulty = the forecasted Bitcoin difficulty (Cell E9)
232 represents the normalized probability of a single hash 24 solving a block as an attribute to the
mining algorithm
1,000,000,000,000 is a constant for converting difficulty into Tera hash/second
Block reward is the reward miners receive per block (Cell E4)
We can condense the formula to the average cost of mining per day divided by the average
expected bitcoins received per day which equals the value of bitcoin (cell E12 for 2017). As shown in
Exhibit B, Cell G12, the value of bitcoin in 2019 is [.1714/.000021033 = $8,149].
After applying these assumptions, we also apply a discount rate. A 40.0% compounded discount
rate was applied to the future value of bitcoin prices. We use a 40.0% discount rates mainly because this
is a discount rate typically associated with venture capital projects. In Exhibit B, Cell B11, we input the
40.0% discount rate and the annualized discount rates are on row 16. In Cells E16 to P16, we display the
discounted value per year. According to our model, the price of one bitcoin per U.S. dollar would be
24
NOTE: A hash function is a mathematical process that takes input data of any size, performs an operation on it,
and returns output data of a fixed size. Hash functions are used as the inputs to solving a block.
14DRAFT -- Valuing Crypto Assets, Luigi D’Onorio DeMeo, and Christopher Young
worth $472,608 in 2029, yet discounted to the present would be $13,809 on January 1, 2018 (hypothetical
day), indicating that bitcoin is over valued at the time of writing this paper with bitcoin currently trading
at approximately $17,000. The value of bitcoin in 2029 is based on substantial changes in the market
over the next eleven (11) years.
In this paper, we have proposed and calculated the present value of bitcoin using a forecasted cost
of production model. We believe this model can be used to value any Crypto Asset based on a
hypothetical exit period. Our work largely follows the efforts of Adam Hayes, and attempts to further his
research. Our proposed formula for valuing any Crypto Asset is as follows,
$PV = (Xday / ECday) / (1 +r) n
where,
$PV = Present value of a Crypto Asset ,
Xday = Cost of mining per day,
ECday = Expected coins received per day,
r = discount rate
n = number of periods
5.0 CONCLUSION
While this model is useful in starting the conversation pertaining to bitcoin’s value, it is only as
good as the assumptions used within. Given the nascent nature of this asset class, we believe much work
is needed, and that economists and financial professionals have only begun to understand the complexities
in valuing Crypto Assets. Future research is necessary to develop further a comprehensive model to value
Crytpo Assets. Research with respect to forecasting input variables are paramount, especially
understanding and forecasting hash rate growth. Along with understanding growth, additional research is
required to quantify risk of Crypto Assets. In order for the Crypto Asset market to gain broad adoption it
is important that research continue to expand with as much or even more vigor than research in the
traditional markets.
15A B D E F G H I J K L M N O P 1 Exhibit A 2 3 2018 2019 2020 2021 2022 2023 2024 2025 2026 2027 2028 2029 4 Block Reward (BTC) 12.5 12.5 12.5 12.5 6.25 6.25 6.25 6.25 3.125 3.125 3.125 3.125 5 Energy Efficiency W/GH (Annual Growth) -50.0% Energy Efficiency 0.2 0.100000 0.050000 0.025000 0.012500 0.006250 0.003125 0.001563 0.000781 0.000391 0.000195 0.000098 6 Cost of Electricity $/kwh (Annual Growth) 2.9% Cost of Electricity $/kwh $ 0.135 $ 0.139 $ 0.143 $ 0.147 $ 0.151 $ 0.155 $ 0.160 $ 0.164 $ 0.169 $ 0.174 $ 0.179 $ 0.184 7 Hashrate (GH/s) 5,770,057,182 23,080,228,729 85,396,846,297 292,911,182,799 933,507,939,579 2,770,931,617,053 7,679,553,848,715 19,923,243,179,459 48,510,919,531,504 111,158,000,087,287 240,352,660,337,522 491,770,032,378,640 8 Rate of Change of Hashrate Growth 10.0% Growth 300% 270.0% 243.0% 218.7% 196.8% 177.1% 159.4% 143.5% 129.1% 116.2% 104.6% 9 Difficulty 807,808,005,512 3,231,232,022,048 11,955,558,481,578 41,007,565,591,812 130,691,111,541,106 387,930,426,387,465 1,075,137,538,820,070 2,789,254,045,124,300 6,791,528,734,410,530 ################### 33,649,372,447,253,100 68,847,804,533,009,600 10 Discount Rate Marginal cost of mining $ 0.648 $ 0.333 $ 0.171 $ 0.088 $ 0.045 $ 0.023 $ 0.012 $ 0.006 $ 0.003 $ 0.002 $ 0.001 $ 0.000 11 40.0% BTC received/ day 0.000311283 0.000077821 0.000021033 0.000006132 0.000000962 0.000000324 0.000000117 0.000000045 0.000000009 0.000000004 0.000000002 0.000000001 12 Value $ 2,082 $ 4,283 $ 8,149 $ 14,376 $ 47,127 $ 71,946 $ 102,550 $ 136,830 $ 342,699 $ 403,865 $ 449,124 $ 472,608 13 14 Time 0.5 1.5 2.5 3.5 4.5 5.5 6.5 7.5 8.5 9.5 10.5 15 Discount Rate 118% 166% 232% 325% 455% 636% 891% 1247% 1746% 2445% 3423% 16 Discounted Value $ 2,082 $ 3,619 $ 4,920 $ 6,199 $ 14,515 $ 15,828 $ 16,115 $ 15,359 $ 27,476 $ 23,129 $ 18,372 $ 13,809
CPI-Average Price Data

Series Id: APU000072610

Series   Electricity per KWH in U.S. city average, average price,
Title:   not seasonally adjusted
Area:    U.S. city average
Item:    Electricity per KWH
Years:   1978 to 2017

  Year      Jan          Feb       Mar         Apr        May       Jun      Jul      Aug      Sep      Oct      Nov      Dec      Average
1978                                                                                                              0.046    0.046      0.046
1979          0.046       0.047      0.047      0.048       0.049    0.052    0.053    0.053    0.053    0.053    0.051    0.052      0.050
1980          0.053       0.055      0.056      0.056       0.058    0.063    0.064    0.064    0.065    0.063    0.061    0.062      0.060
1981          0.063       0.064      0.065      0.066       0.067    0.071    0.073    0.075    0.074    0.072    0.071    0.071      0.069
1982          0.073       0.073      0.075      0.075       0.075    0.079    0.079    0.079    0.079    0.077    0.074    0.075      0.076
1983          0.075       0.075      0.076      0.075       0.077    0.081    0.082    0.082    0.082    0.080    0.077    0.077      0.078
1984          0.078       0.079      0.079      0.080       0.081    0.086    0.087    0.089    0.084    0.081    0.079    0.078      0.082
1985          0.079       0.079      0.079      0.080       0.080    0.085    0.085    0.085             0.082    0.080    0.080      0.081
1986          0.081       0.075      0.075      0.074       0.074    0.080    0.080    0.080    0.080    0.074    0.073    0.073      0.077
1987          0.075       0.076      0.076      0.076       0.076    0.084    0.084    0.085    0.084    0.078    0.077    0.077      0.079
1988          0.078       0.078      0.078      0.077       0.077    0.084    0.084    0.084    0.084    0.080    0.078    0.078      0.080
1989          0.079       0.079      0.079      0.079       0.080    0.086    0.086    0.086    0.086    0.081    0.080    0.081      0.082
1990          0.081       0.081      0.081      0.082       0.082    0.088    0.087    0.087    0.088    0.083    0.082    0.082      0.084
1991          0.084       0.084      0.085      0.084       0.085    0.090    0.091    0.090    0.091    0.087    0.084    0.085      0.087
1992          0.085       0.084      0.086      0.086       0.087    0.092    0.092    0.091    0.092    0.088    0.086    0.088      0.088
1993          0.089       0.087      0.088      0.088       0.090    0.094    0.095    0.097    0.097    0.093    0.091    0.090      0.092
1994          0.090       0.090      0.089      0.088       0.090    0.095    0.095    0.096    0.096    0.093    0.091    0.091      0.092
1995          0.091       0.091      0.091      0.090       0.092    0.098    0.098    0.098    0.097    0.094    0.092    0.091      0.094
1996          0.091       0.091      0.092      0.092       0.092    0.096    0.099    0.099    0.099    0.095    0.092    0.092      0.094
1997          0.092       0.092      0.093      0.092       0.093    0.099    0.099    0.098    0.099    0.093    0.092    0.090      0.094
1998          0.086       0.085      0.085      0.085       0.086    0.091    0.091    0.090    0.089    0.086    0.084    0.084      0.087
1999          0.084       0.084      0.084      0.084       0.085    0.089    0.090    0.089    0.090    0.087    0.085    0.085      0.086
2000          0.084       0.085      0.085      0.085       0.085    0.090    0.091    0.091    0.091    0.088    0.086    0.086      0.087
2001          0.088       0.088      0.089      0.089       0.090    0.097    0.099    0.098    0.097    0.093    0.090    0.090      0.092
2002          0.089       0.089      0.089      0.088       0.089    0.095    0.095    0.095    0.095    0.091    0.089    0.089      0.091
2003          0.089       0.089      0.089      0.091       0.092    0.097    0.098    0.098    0.098    0.093    0.090    0.090      0.093
2004          0.091       0.091      0.091      0.091       0.093    0.099    0.099    0.100    0.099    0.094    0.092    0.092      0.094
2005          0.094       0.094      0.094      0.095       0.097    0.104    0.105    0.105    0.106    0.102    0.102    0.102      0.100
2006          0.108       0.108      0.109      0.109       0.110    0.118    0.118    0.118    0.118    0.112    0.110    0.110      0.112
2007          0.113       0.113      0.113      0.113       0.115    0.122    0.122    0.121    0.121    0.117    0.115    0.115      0.117
2008          0.116       0.116      0.116      0.118       0.120    0.128    0.131    0.132    0.130    0.126    0.123    0.124      0.123
2009          0.126       0.126      0.126      0.125       0.126    0.132    0.131    0.130    0.130    0.126    0.124    0.124      0.127
2010          0.124       0.123      0.125      0.126       0.127    0.132    0.133    0.133    0.132    0.127    0.125    0.125      0.128
2011          0.125       0.125      0.127      0.127       0.129    0.134    0.135    0.135    0.135    0.130    0.128    0.127      0.130
2012          0.128       0.128      0.127      0.127       0.129    0.135    0.133    0.133    0.133    0.128    0.127    0.127      0.130
2013          0.129       0.129      0.128      0.128       0.131    0.137    0.137    0.137    0.137    0.132    0.130    0.131      0.132
2014          0.134       0.134      0.135      0.131       0.136    0.143    0.143    0.143    0.141    0.136    0.134    0.135      0.137
2015          0.138       0.138      0.136      0.137       0.137    0.143    0.142    0.142    0.141    0.136    0.134    0.133      0.138
2016          0.134       0.134      0.134      0.134       0.133    0.138    0.139    0.139    0.139    0.134    0.131    0.133      0.135
2017          0.134       0.135      0.134      0.135       0.137    0.142    0.143    0.142    0.142                                 0.138
                                                                                                                                      2.9%
You can also read