Dust over West Africa - Dr. Vincent O. Ajayi Federal University of Technology, Akure, Nigeria - GCRF African SWIFT
←
→
Page content transcription
If your browser does not render page correctly, please read the page content below
Dust over West Africa

              Dr. Vincent O. Ajayi
Federal University of Technology, Akure, Nigeria.
             voajayi@futa.edu.ng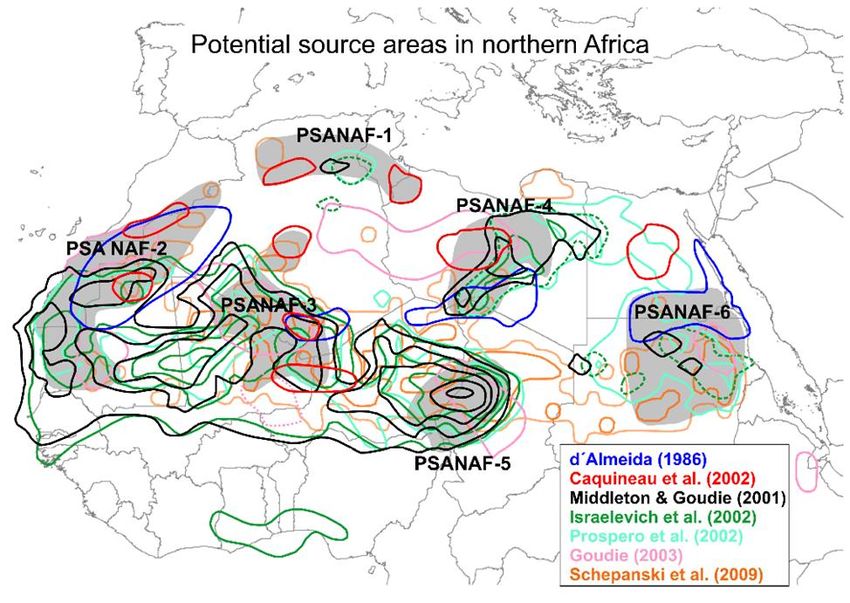
Lecture outline
•   Introduction
•   Source region
•   Transport and trajectory
•   Characteristics of Bodele depression
•   Meteorological conditions
•   Mechanism of raising dust
•   Dust climatology
•   Impact of dust in West Africa
•   Forecasting of dust
West Africa Weather zone revisited

Figure 1: Weather zones relative to the surface location of ITD in August(Source: Weischet, 2000)
Introduction

Figure 2: Seasonal variation in latitudinal position of the ITCZ and its consequences
for atmospheric conditions over northwestern Africa. Arrows indicate direction of
trade winds; dust plumes are indicated by grey shadings. December, January, and
February (winter) and June, July, and August (summer) are shown. (From Stuut et al.,
2005.)
Winter
Summer
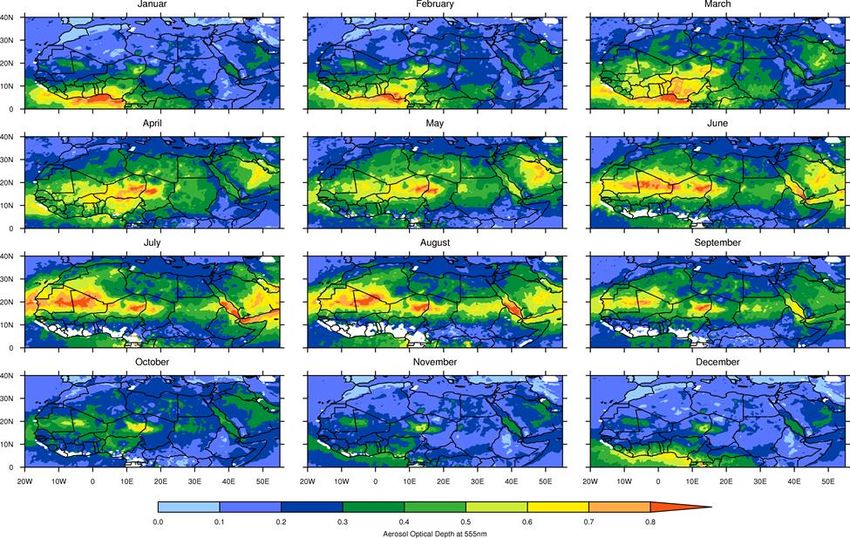
Figure 3: Animation of AOT in
sumer and winter, It can be noted
that harmattan dust is transported
to West African in Winter and
towards North and South America
in Summer seasons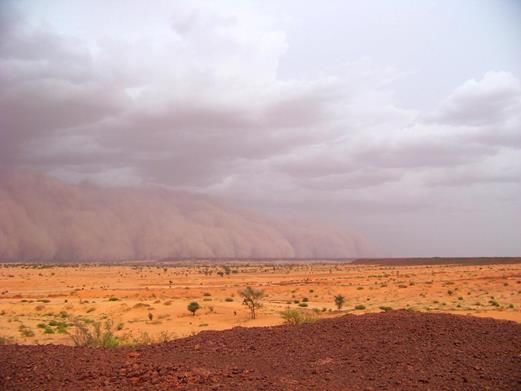
Source region
Kalu (1979) identified the
source region to be
around
Bilma
Faya Largeau
Western Sahara
Southern Sudan
Figure 4: Major dust region in West Africa as
observed by Kalu (1979)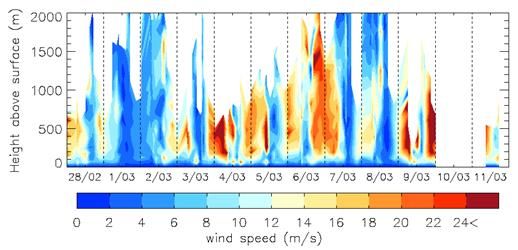
Figure :
The most important regions are grey
shaded:
PSANAF-1: Zone of chotts in
Tunisia and northern Algeria;
PSANAF-2: Foothills of Atlas
Mountains (PSANAF-2a) and
western coastal region (PSANAF-2b;
western Sahara, western
Mauritania);
PSANAF-3: Mali-Algerian border
region;
PSANAF-4: Central Libya;
PSANAF-5: Bodélé Depression
Figure 5: Overview of potential dust source (western Chad)
areas in northern hemispheric Africa (PSANAF) PSANAF-6: Southern Egypt,
based on a synergy analysis by Formenti et al. northern Sudan. Other source
(2011). The different lines and colours regions worth noting are the
represent analyses by different authors based southern parts of the Azawagh, a dry
on different data and techniques (see legend), basin in northwestern Niger /
illustrating the challenge of identifying dust northeastern Mali (pink stippled
sources with great accuracy. line), and the Kaouar region in
northern Niger (not specifically
marked on the Figure).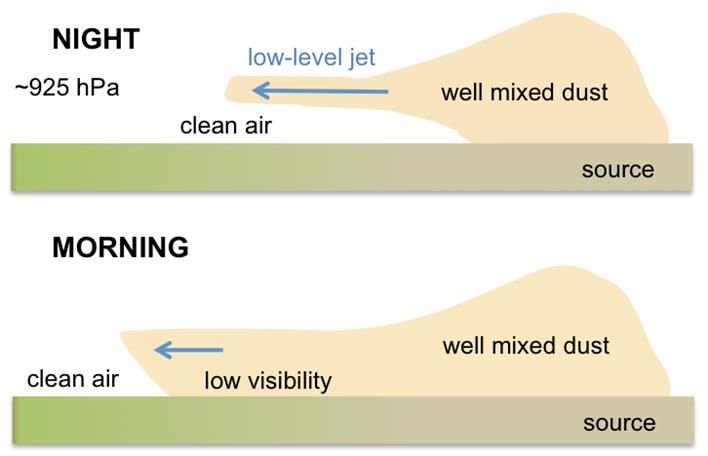
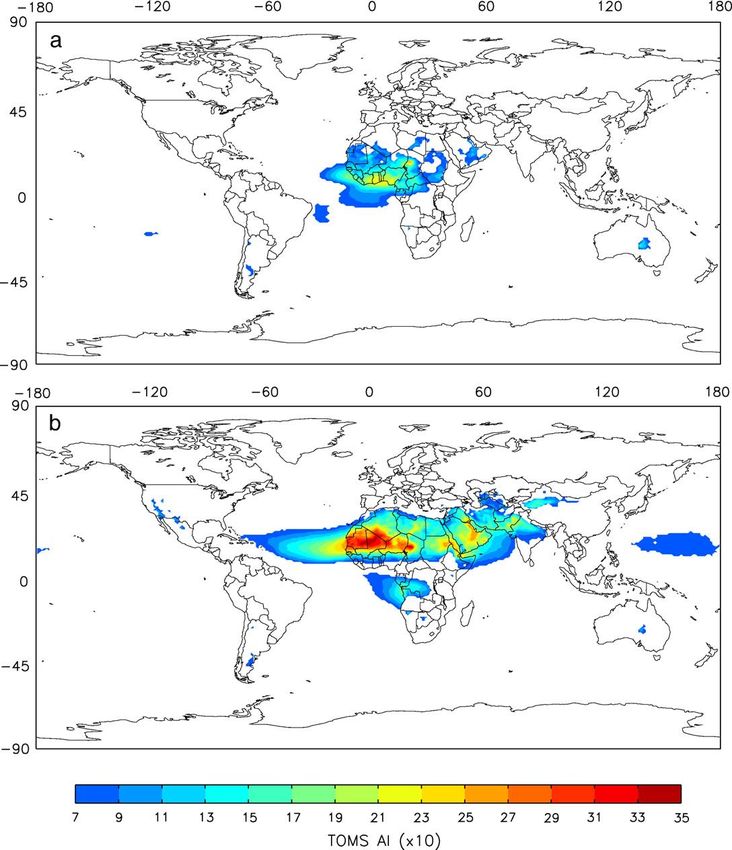
Transport and Trajectory
• The dust from Sahara region affects other areas of the
  world apart from West Africa.
• Prospero et al. (2001) reported that dust is transported
  from these Saharan sources over land and sea to
  regions like Europe, the Middle East and across the
  Atlantic to areas as far away as Mexico City.
• This dust transport occurs in spectacular storm-like
  event, when clouds of the desert aerosol particles take
  the shape of giant plumes that span the over large
  regions west of Africa and extend more than one
  thousand kilometers from the source
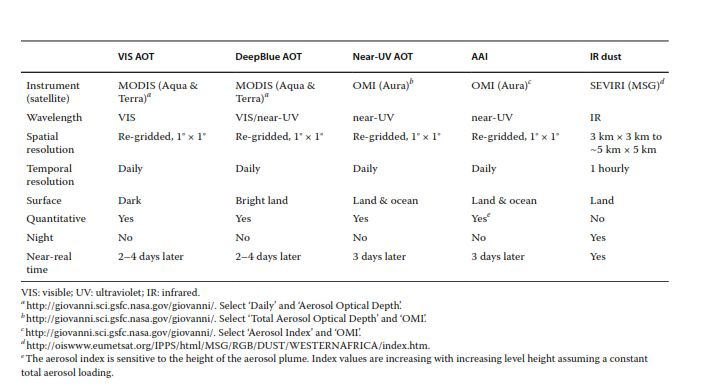
Figure (6) Seasonal mean TOMS AI (×10)
(1980–1992) for (a) November–January and (b)
May–July. Engelstaedter et al., 2006.

Dust plumes are more intense during the
summer, however the direction of travel is
toward north Atlantic, exceptions are rare eg,
Oluleye (2017)
Characteristics of the PSANAF-5: Bodélé
           Depression (western Chad)
• Major characteristics of the Bilma - Faya Lageau area which
  fall within the PSANAF-5, is the convergence of katabatic
  induced wind downstream from the Western slope of Tibesti
  Mountain, which leads to large-scale deposition of sand in the
  plain (Wilson 1971).
• The depletion of dust in the source is exceeded by the supply
  of dust into the region. This ensures continuous raising of dust
  every year without leading to depletion process.
• Dust particles are constantly fed into the wind at the western
  slope of Tibesti and deposition occurs under favourable
  meteorological condition, such as convergence or
  deceleration of wind stream.
• The dusty atmosphere observed in West Africa in winter
  results from a discharge of dust particle into the atmosphere,
  though it does not occur every time except when certain
  synoptic conditions must have been established over the
  source region
Meteorological conditions Synoptic The wind plays the greatest role in the life cycle of Sahara dust right from the emission stage to the propagation stage. In the Sahel and southern Sahara, intense dust storms frequently occur during the West African dry season (December to April) in connection with low‐level pressure surges associated with an intensification of anticyclonic conditions over northern Africa (Kalu, 1979; Klose et al.,2010). The increased south–north pressure gradient across northern Africa associated with a strengthened subtropical anticyclone leads to an intensification of the Harmattan winds.
Dust raising is due to the
intensification of the Libyan
High
This is often preceded by
the eastward passage of a
mid‐latitude depression
across northern Africa.
The high pressure often
builds rapidly behind the cold
front, which may penetrate far
into the African continent.
Figure 7: Typical situations for the raising of dust
during the winter periods. (a) Intensified Libyan High,
The dashed lines show typical isobars spaced every 5
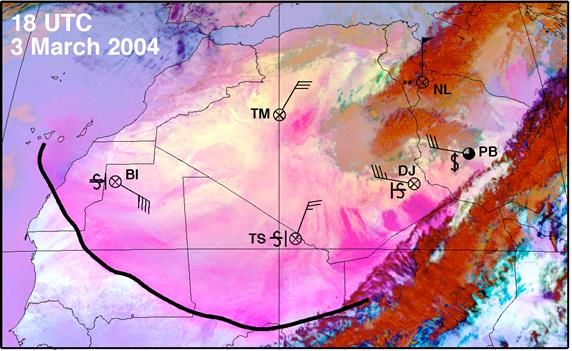
hPa with the 1015 hPa highlighted in bold.Figure 8: Example of an intense large-scale dust outbreak caused by rapid anticyclogenesis over north-western Africa at 1800 UTC 03 March 2004. The underlying satellite image and station reports. During the following days the dust front continued to spread until it formed a long arc from the Gulf of Guinea to the Canary Islands
Low-level Jet (Bodele Low-Level jet at 925hpa)
 • An important phenomenon that occurs over cloud-free, dry
   regions with strong background pressure gradients during all
   seasons is the formation of nocturnal low-level jets (LLJs)
   Stensrud, 1996; Fiedler et al., 2013)

Figure 9: Measurements of the effect of nocturnal LLJ formation on surface winds at Chicha (16°53’N, 18°33’E, Chad)
during the BoDEx campaign. Left panel: Time-height profile of wind speed from Pilot Balloon data for 28 February to
11 March 2005. Right panel: One-minute averages of 2-m wind speed for 5–8 March 2005. The data show the
formation of nocturnal jets and corresponding peaks in surface winds during the morning for some days during the
campaign
Transport of dust by Bodele LLJ

                       Figure     10:      Schematic
                       depiction of transport and
                       mixing of dust associated
                       with a nocturnal LLJ.
Mesoscale • Dust storms along the leading edge of a rapidly spreading cold pool are often called haboobs (Sutton, 1925; Freeman,1952). • Haboobs are formed from the density currents driven by the cooling associated with the evaporation of convective precipitation in the hot and dry desert. • It is a squall-line-type convection in northern Africa at the margins of the Sahara where enough moisture is available to sustain the parent deep moist convection.
Figure 11: Examples of haboob dust storms generated by gust fronts ahead of
vigorous squall lines over the Sahel. (courtesy of Laurent Labbé): Photograph of a
haboob arriving over Niamey on 26 June 2012.
Microscale Local scale dust can be mobilised in connection with dry convective mixing in the Planetary Boundary Layer (PBL) This is evident in rotating dust devils and in part through non‐rotating convective plumes Dust devils typically have diameters of 3–100m, lifetimes of a few minutes and tangential wind of 3–15m/s (Sinclair, 1969). Dust plumes, in contrast, are characterised by larger diameters and lifetimes up to an hour, and also by weaker winds and smaller dust fluxes. Typical conditions for the formation of dust devils/plumes include moderate,near‐surface wind shear and a large temperature contrast between the surface and the lowest few metres of the atmosphere.
Mechanism of raising the harmattan dust The occasional slight shifts in the position of anticyclone result in the periodic incursion of cold polar air into Sahara region. This causes the strong tightening of the pressure gradient in the lower layer. Consequently, large amount of dust produced by weathering of rock and soil at-the surface are emitted into the air by strong surface wind resulting from convergence of air aloft and divergence below, thereby building up dust reservoir of several kilometers thick in the Sahara atmosphere. After the dust has been raised, turbulent mixing through the downward transfer of large momentum at the gradient level (925hpa) transport the dust to 925 hpa where horizontal transport is initiated. The strong horizontal wind at this level is a necessary agent for transport of dust haze across West Africa sub region in form of plume (Kalu 1977).
Kalu (1977) partitioned the life cycle of Sahara dust into three major phases: Instantaneous rising stage: The first stage is the raising of the dust in the source region. This is when the dust particles are violently raised from the ground, usually in form of dust storm as a result of strong surface wind. The dust plume is diffused upward by turbulence and there is pronounced buoyancy but no horizontal spread in this phase.
• The spreading phase: Having been raised from the ground by turbulence to the level where horizontal wind is strong, transportation starts in horizontal direction, at about 900 hpa. t is observed that, at this stage, the wind that raised the dust plume weakens and this suggest that the plume also gradually losses its vertical momentum
• The equilibrium phase: The equilibrium stage is the most stable of the three phases of the motion of the dust haze plume. It sets in as soon as the spreading stage has been completed. It is assumed that at this stage, the plume has lost independence and is therefore moving under the influence of prevailing winds. It is at this stage that West Africa experience reduced visibility. This equilibrium stage usually takes place some hundreds of kilometers downwind.
Dust Climatology
Dust source activity and resulting
dust storms change with space and
time.
Their variability is described by the
use of the time series from weather
station observations, such as visibility
records, weather reports and satellite
Images
There is a pronounced diurnal cycle
in visibility reduction in the Sahel.
Typically, minimum horizontal
visibility occurs during late morning to
mid afternoon due to the
development of the convective
boundary layer.
Seasonal variation in the occurrence
of reduced visibilities changes with
Figure 12: Mean monthly number of hours the rainfall regime, and thus with
with visibility reduced less than 5 km (shaded distance from the equator
bars) and less than 10 km (unshaded bars)
during the period 1983–87. AOTs represent the total
atmospheric column, high aerosol
loadings do not necessarily
correspond to high surface
concentrations and thus low
horizontal visibilities.
In addition to dust, aerosols such
as soot from burning biomass
contribute to the AOT,
particularly over the Gulf of
Guinea region during November
to March
In Winter, the atmospheric dust
loading over North Africa is at its
minimum, but increased dust
loading Bodélé Depression–
Ténéré region (Chad and
Niger),and northwest Mali.
In March to May the
atmospheric dust loading
generally increases, forming a
band of enhanced dustiness
extending from the Red Sea
to the Atlantic, centered at
around 15–20°N, that persists
Figure 13: MISR AOT monthly means for 2001–2011. until August and retreats in
Note that Nov to Mar soot contributes significantly to September.
the AOT over the Gulf of Guinea region.Impact of dust in West Africa Aviation: Many flight cancellation due to poor visibility Health: Adefolalu (1984) reported that dust loading in the atmosphere may lead to outbreak of acute respiratory infections, pneumonia and bronchitis especially in the northern part of W/A. Direct impact on weather and climate.
Interactions with Weather and Climate

 Figure 14: Linkages between mineral dust aerosol and climate, indicating direct
 and indirect aerosol effects, and the role of oceanic dust deposition ecosystems.
Direct Radiative Effect
• Dust impacts considerably on the energy balance of solar and
  thermal IR radiation (Solomon et al., 2007).
• Incoming solar radiation is partly reflected and absorbed by
  atmospheric particles.
• At size distribution of 2 µm or larger, dust particles can also absorb
  and emit outgoing terrestrial radiation.
• Dust particle size and complex refractive indices determine their
  optical properties, and thus the magnitude and sign of their
  radiative effects.
• These can be determined by measurements in the laboratory or
  field, or by remote sensing.
• Case studies of some dust events is estimated negative
  between −6 W m−2 and −400 W m−2 (Christopher and Jones,
  2007)
• A negative dust forcing suggests that an enhancement of
  atmospheric dust aerosol would lead to a cooling of the climate.
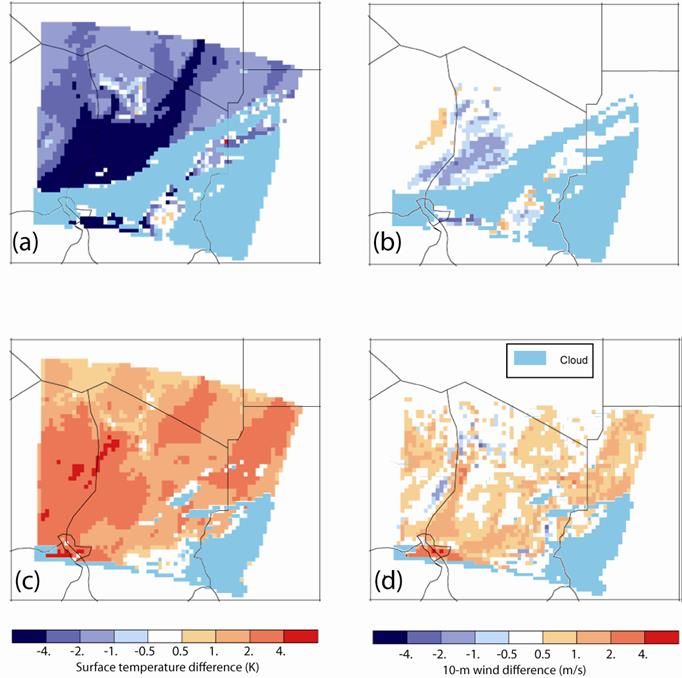
Impact on Atmospheric Stability
                                      • Radiative forcing by dust influences
                                        the energy distribution within the
                                        atmosphere.
                                      • These      changes      in     energy
                                        distribution can alter temperature
                                        and     wind     distribution     and
                                        ultimately affect the stability of the
                                        atmosphere.
                                      • Figures 15a and 15c shows that
                                        The maximum surface cooling by
                                        dust exceeds 20K, corresponding to
                                        a decrease in net radiation flux by
                                        about 500Wm2
                                      • The maximum reduction in surface
                                        wind speeds at this time due to the
                                        dust radiative forcing is 3 ms-1
                                      • Generally, results from regional
Figure 15: Regional model results of    models show that dust affects the
changes in 2-m temperatures (a,c) and   atmospheric stability.
10-m wind speeds (b,d) for the Bodélé
region in Chad.
Impact on Cloud Microphysics • Dust may influence the formation and lifetimes of clouds via the so-called indirect aerosol effect. • A coating of dust particles by soluble material enhances the ability of those particles to form cloud condensation nuclei (Wurzler et al., 2000). • There are considerable uncertainties in the estimates of the impact of mineral dust on the ice phase of clouds and precipitation. • While mineral dust particles can be efficient ice nuclei, the extent of the influence of dust particles on the formation and development of ice clouds remains largely unquantified.
Fertilisations of Ecosystems
• Soil dust particles add essential nutrients into
  terrestrial and marine ecosystems when they are deposited
  to the ground.
• Saharan dust is very rich in iron (Adedokun et al., 1989).
  Fertilization experiments in which dissolved iron (Fe(II)) is
  added to the ocean show an enhanced productivity of
  oceanic microorganisms (e.g. plankton) and increase in CO2
  drawdown in regions rich in macronutrients (Coale et al.,
  1996).
• Transported desert dust deposited onto nutrient-poor soils
  is suspected to contribute micronutrients to terrestrial
  ecosystems.
• Koren et al.,(2006) has reported that the transport of
  Saharan dust into the Amazon rainforest is suspected to
  support its vegetation growth .
Forecasting of Harmattan
• Generally, three phases are involved in dust
  forecasting: dust raising, transport and clearance.
  Forecasters should concentrate on four aspects in
  their assessment of a given situation:
1. Watch out for significant amounts of dust being
   raised over the Sahara/northern Sahel.
2. Estimate the likelihood of the dust being
   transported to your region and the arrival time.
3. Monitor the situation to estimate duration and
   severity of the HDH event.
4. Watch out for indications of a clearing due to a
   change of air masses or ceasing dust emission.
In particular,
• Burns (1961) has demonstrated the close relationship
  between strong surface pressure gradient and the
  occurrence of dust haze over West Africa.
• The method relied on tracking cold fronts traversing
  the Sahara in winter and "watching" dust haze report
  at some upwind desert stations such as Faya Largeau
  and Bilma.
• Burns (1961) proposed that dust haze should be
  forecast over Nigeria following 24-48 hours if a
  persistent pressure gradient of 10hpa or more is
  observed on the surface isobaric chart over between
  two desert stations Abecha (14° N, 21.5 E) and Sebha
  (27° N, 140E).
This finding became a very useful forecasting tool for more than a decade. Only isobaric analysis of the surface chart and a report of dust at Faya Largeau (18 N, 19 E), on the line joining Abecha and Sehba, are needed. The dust persists as long as the critical gradient is maintained but visibility improves significantly if the gradient falls below the critical value. The method failed frequently because there was not always a guarantee of dust even when the pressure gradient was l0hpa or stronger. Also the very scanty surface data coverage in the desert are often not readily obtained.
Aina (1972) using both upper air and surface data. The scheme consisted of the following: Analysis of the surface isobaric chart is carried out for the determination of the pressure gradient as given by Burns (1961) The 900hpa chart, where the winds are usually strongest at this time, is also analysed using streamline and isotach analysis. If there is a "jet" (enclosed by the 30 knots isotach), then dust should be forecasted for the next day over the northern parts of Nigeria. The dust front, the leading edge of the 5km visibility isopleth, advances westwards with a mean speed of about 15knots to affect other parts of Nigeria and West Africa. The weakening or disappearance of the jet marks the beginning of the dust clearance and improved visibility. **The scheme led to increased reliability in dust haze forecasting in Nigeria. However it failed operationally due to inadequate upper air data in the region.
• Omotosho (1989) proposed another method less dependent on
  both the observation from the upwind "informant" stations and
  communications.
• The scheme employed the use of a conservative parameter - the
  equivalent potential temperature and its departure relative to the
  entire larger- scale environment of the northern area of the West
  Africa
• The method requires only the time-series of the near-surface
  departures of the equivalent potential temperature (θe′), at
  particular station, from its long-term value over the entire northern
  half of West Africa.
• Dust should be forecast tentatively two to three days ahead after
  the day of a maximum positive anomaly of θe′ at the surface.
• Dust haze occurence is certain if the maximum is accompanied or
  followed within 24 by negative anomalies between 950 and 850
  hPa.
• Clearance will not occur (that is, visibility will remain poor) as long
  as the negative anomalies below the 850-hPa level persist. Finally,
  the parameter is also found to be a good cold-spell predictor.
Forecasting of haboob Assess the state of the soil. If it has been dry for at least the last 2 days, the soil is typically dry enough to produce dust, provided sufficiently high wind speeds occur. Assess the potential for the development of deep convection In particular, downdraft convective available potential energy can be a useful indicator for the strength of associated downdrafts, and thus the potential intensity of the surface haboob. Forecasting Convective Dust Storms Assess the potential for convective organization and downdraft formation. This typically includes an analysis of vertical wind shear and mid‐level dryness The intensity of the dust storm will be closely related to the intensity of the downdraft, and therefore the amount of evaporative cooling at mid and low levels. These factors will also allow an assessment of the likelihood of significant precipitation at the surface that could wash out dust after the initial storm.
• Owing to the difficulties in forecasting a storm
  before it has formed, nowcasting techniques
  are of great importance.
• Once a storm has formed and has been
  reported at SYNOP stations upstream (i.e.
  typically to the east), a forecast can be made
  based on simple extrapolation of the storm
  track.
• To achieve this, communications between
  stations are very crucial.
Satellite and Remote Sensing
• Recent improvement in satellite technology has greatly
  improved           forecasting          ability       over
  data-sparse West Africa.
• The infra red and visible sensors aboard most
  meteorological satellite provide continuous imageries of
  cloud movement and aerosol concentration in the
  atmosphere.
• MSG IR composite imagery should be used to identify
  significant dust plumes. The high temporal resolution
  allows an extrapolation of the movement of an identified
  plume.
• Forecasters should be aware of the limitations of
  this product, including concealing of dust by clouds.
• Table 1 presents freely available satellite dust products
  for West Africa
Table 1: Freely available satellite dust products for West Africa.
Numerical Modelling
• Modelling involves using solutions of a set of
  hydrodynamics and thermodynamics equations
  starting from an observed atmospheric state, to
  calculate future weather conditions.
• This is because such methods allow a deeper and
  clearer understanding of the physical and other process
  involved in reproducing the phenomenon.
• Dust module is coupled to many NWP and Climate
  models notably CAMS‐ECMWF, METEO FRANCE,
  MetUM,       NAAPS,     NASA‐GEOS‐5,       NCEP‐NGAC,
  NMMB/BSC‐Dust
Bibliography
• Meteorology of Tropical West Africa: The
  Forecasters’ Handbook, First Edition. Edited
  by Douglas J. Parker and Mariane Diop-Kane.
  © 2017 John Wiley & Sons Ltd. Published
  2017 by John Wiley & Sons Ltd.
• Other published works cited in the
  presentation.
Thank you
You can also read