Dynamic Norms and Food Choice: Reflections on a Failure of Minority Norm Information to Influence Motivation to Reduce Meat Consumption - MDPI
←
→
Page content transcription
If your browser does not render page correctly, please read the page content below
sustainability

Article
Dynamic Norms and Food Choice: Reflections on a Failure of
Minority Norm Information to Influence Motivation to Reduce
Meat Consumption
Alaa Aldoh * , Paul Sparks                   and Peter R. Harris

                                          School of Psychology, University of Sussex, East Sussex BN1 9QH, UK; p.sparks@sussex.ac.uk (P.S.);
                                          p.r.harris@sussex.ac.uk (P.R.H.)
                                          * Correspondence: a.aldoh@sussex.ac.uk

                                          Abstract: Recent research in the US shows the potential of providing information about minority
                                          norms that are increasing on positively influencing interest and engagement in desired behaviours.
                                          Although these are promising findings, there is little published research replicating or testing this
                                          effect outside the US. The study reported here is a direct replication of Sparkman and Walton’s (2017)
                                          research. We explored the effects of different kinds of normative information, particularly information
                                          about increasing (referred to as ‘dynamic’ or ‘trending’) minority norms, on interest in reducing meat
                                          consumption, attitudes toward reducing meat consumption, intentions to reduce meat consumption,
                                          and expectations to do so. Following pilot work (n = 197), we used a double-blind online study
                                          with three conditions: dynamic norm (n = 276), static norm (n = 284), and no norm (n = 286). The

                                   sample consisted of British people, with ages ranging from 18 to 79 (Mage = 37.21, SDage = 13.58;
                                          56.38% female). There was no effect of dynamic norm information on any outcomes, including
Citation: Aldoh, A.; Sparks, P.;
Harris, P.R. Dynamic Norms and
                                          predictions about future meat consumption norms. Exploratory analyses suggest that political
Food Choice: Reflections on a Failure     position and gender were associated with meat consumption outcomes. The findings are discussed in
of Minority Norm Information to           relation to conditions under which dynamic normative information may be successful in influencing
Influence Motivation to Reduce Meat       motivation to engage in desired behaviours, and to possible improvements in research design.
Consumption. Sustainability 2021, 13,
8315. https://doi.org/                    Keywords: dynamic norm; climate change; environment; norms; behaviour change
10.3390/su13158315

Academic Editors: Cameron Brick,
Florian Lange and Hyo Sun Jung            1. Dynamic Norms and Meat Consumption Outcomes
                                               Climate change is a pressing global issue with potentially devastating effects on
Received: 13 May 2021
                                          the environment and the lives of humans and other animals. Greenhouse gas emissions
Accepted: 8 July 2021
Published: 26 July 2021
                                          significantly contribute to anthropogenic climate change (i.e., change arising from hu-
                                          man activity), with people’s eating choices being a significant influential factor. One of
Publisher’s Note: MDPI stays neutral
                                          the largest sources of greenhouse gas emissions is people’s eating choices: it has been
with regard to jurisdictional claims in
                                          estimated that livestock alone contribute 14.5% of total human-caused greenhouse gas
published maps and institutional affil-
                                          emissions, which is equivalent to emissions caused by transportation including all cars,
iations.                                  trucks, planes, and ships on the planet combined [1]. Research has shown that switching
                                          to more environmentally sustainable eating decisions, such as opting for chicken, fish, or
                                          vegetables rather than red meat, could reduce the costs of climate change mitigation by as
                                          much as 50% by 2050 [2]. Furthermore, eating a plant-based diet has significantly higher
                                          potential to reduce emissions than many commonly promoted and researched strategies
Copyright: © 2021 by the authors.
Licensee MDPI, Basel, Switzerland.
                                          such as recycling and switching to hybrid cars [3].
This article is an open access article
                                          1.1. Social Norms
distributed under the terms and
conditions of the Creative Commons             A fundamental challenge lies in persuading or otherwise influencing individuals
Attribution (CC BY) license (https://     to make more environmentally sustainable eating choices. There are many decisions an
creativecommons.org/licenses/by/          individual may make to effect more environmentally sustainable choices. In this paper, we
4.0/).                                    specifically focus on decisions to limit meat consumption. A common way of influencing

Sustainability 2021, 13, 8315. https://doi.org/10.3390/su13158315                                      https://www.mdpi.com/journal/sustainability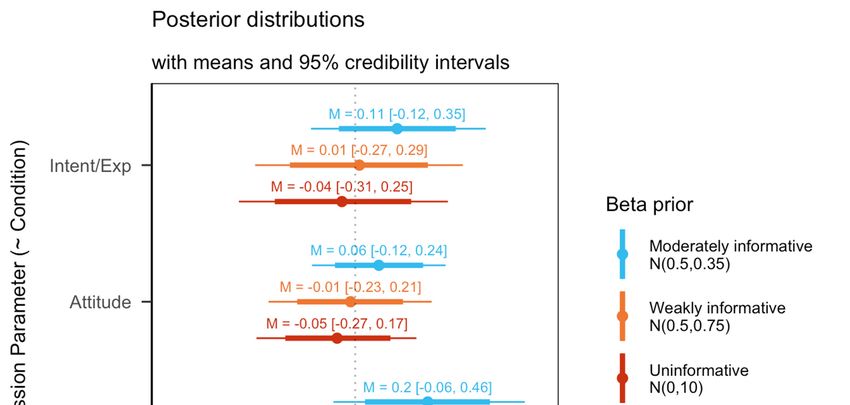
Sustainability 2021, 13, 8315                                                                                            2 of 17

                                behaviour is by providing people with information about social norms. Social norms are
                                “the predominant behaviours, attitudes, beliefs, and codes of conduct of a group” [4] (p. 1).
                                Cialdini et al. [5] define injunctive norms as “rules or beliefs as to what constitutes morally
                                approved and disapproved conduct”. They typically guide individuals’ behaviours to
                                comply with societal standards and to avoid social sanctions. Descriptive norms refer to
                                “what is typical or normal” (p. 1015), and what is done by most people. The two types of
                                norms are related and often interact with one another. People are likely to conform to the
                                aspect of the norm that is most salient (i.e., focused on temporarily or dispositionally) [5].
                                      Researchers have recently differentiated between descriptive norms that are static and
                                descriptive norms that are changing or trending [6–9]. Static norms refer to levels of current
                                engagement in a behaviour and imply the unchanging character of that level of engagement,
                                whereas dynamic norms refer to a collective change in others, or trends in norms over
                                time [10]. For instance, a static norm would refer to the current unchanging prevalence of
                                people who cycle to work, and dynamic norm would refer to an increasing (or decreasing)
                                trend of people cycling to work. Information about static norms has been found to be
                                particularly influential when it emphasizes a behaviour performed by the majority [11–13],
                                but it can backfire when it provides information about behaviours performed by a minority
                                of the individual’s ingroup (e.g., supermarket customers learning that a minority of 9%
                                of other shoppers buy at least one eco product becoming less likely to buy eco products
                                themselves, see [14]). One possible way to counteract this is through the use of information
                                about dynamic norms to increase engagement in behaviours that are only performed by
                                the minority. Sparkman and Walton [8] found that people responded more positively
                                to salient information about change in collective behaviour or attitudes when the change
                                aspect was made salient, even if the behaviour was currently only performed by a minority
                                of the group’s members. Dynamic norm research has shown particular promise in online,
                                laboratory, and field studies in targeting sustainable behaviours such as reduced interest in
                                eating meat and using less water [6–8,15]. Sparkman and Walton [16] also found evidence
                                for the efficacy of dynamic norms in a range of other domains. The authors conducted
                                a series of studies where they found dynamic norm information increased participants’
                                intentions to attempt to quit smoking, interest in avoiding screen use before sleep, interest
                                in avoiding sugary beverages, and male participants’ identification as feminists. Moreover,
                                female high school students who read a passage on the uptake of female high school
                                graduates entering into STEM degrees subsequently reported a greater intention to pursue
                                a similar path, relative to those reading static norm messages [17]. Dynamic norms have
                                even been found to encourage intergroup contact with immigrants in the UK [18]. However,
                                research in this area has been sparse and inconsistent; for example, Chalasani et al. [19]
                                found no effect of dynamic norm messaging on purchase of energy-efficient products in
                                the federal sector. Another recent randomized controlled trial of norm-based feedback on
                                household waste in Sweden found no evidence that dynamic-norm feedback was more
                                effective than static norm feedback using a standard ‘Home Energy Report’ [20].
                                      Norms are a particularly interesting tool to tackle unsustainable behaviours, as nor-
                                mative social influence is both often powerful [21] and under-detected (e.g., [22]). Among
                                different motivators, Nolan et al. [22] found that the descriptive norm about neighbours’
                                energy conservation influenced participants’ own energy conservation behaviours the
                                most, despite participants perceiving it as the least influential motivator. Some research
                                has indicated that people tend to believe they are less susceptible to normative influence
                                and their behaviour is less conforming, while also believing that others are more likely to
                                conform [23].

                                1.2. Current Study
                                     Although recent research has emerged which explores the effects of dynamic norms
                                on sustainable behaviour norms, published research has so far been largely limited to
                                participant samples in the US. It is important to investigate the effectiveness of dynamic
                                norms in different settings in varying socio-political contexts and cultures. Moreover, most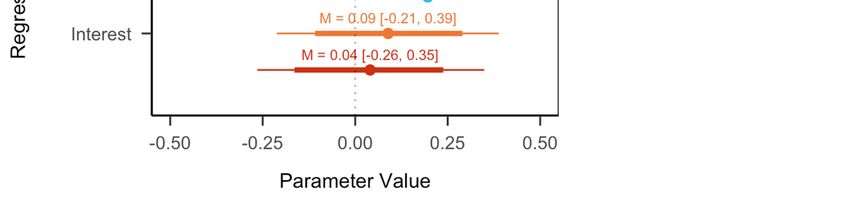
Sustainability 2021, 13, 8315                                                                                              3 of 17

                                published research on dynamic norms and sustainable eating behaviours has been tested in
                                relation to interest in reducing meat consumption, but there has been no research directly
                                testing the relationship between dynamic normative information and other, more familiar,
                                cognitive predictors of action, such as attitudes, expectations, and intentions to reduce
                                meat consumption (see [24–26]). Within the theory of planned behaviour (e.g., [27]), there
                                is a clear causal relationship between attitudes and intentions and behaviour, and a similar
                                predictive effect of expectations on behaviour has been acknowledged [25].
                                      This study sought to replicate the effect of dynamic norm information on interest in
                                reducing meat consumption found in Sparkman and Walton [8], as well as other meat
                                consumption-related variables. For the purpose of the study, we defined meat consumption
                                as consumption of any animal flesh (pork, chicken, beef, fish, etc.).
                                      Sparkman and Walton’s [8] research found evidence for the effect of dynamic norm
                                information on predicted meat consumption in the future, where participants who read
                                dynamic norm information about reduced meat consumption were more likely to predict a
                                decline in consumption, compared to participants in the static norm control condition. The
                                authors’ results suggest a mediating effect of “preconformity”—conforming to a predicted
                                future norm—on interest in reducing own consumption. We were interested in replicating
                                the effect of condition on expectations about future norm in our own study and sought
                                to test this effect using the existing measure of preconformity from the original study,
                                as well as via an additional measure estimating participants’ perception of future meat
                                consumption in the UK.
                                      The original study also found consistent associations of political orientation and gen-
                                der with interest in reducing meat consumption, such that liberals and women were more
                                likely to be interested in eating less meat, than were conservatives and men, respectively.
                                We were interested in exploring the effects of demographic information on outcomes of
                                interest, but we did not have predictions about any possible effects. Additionally, in tests
                                of seven highly-cited social psychological phenomena (including opinion change resulting
                                from conformity or persuasion) using randomly sampled, representative groups of Ameri-
                                can adults, Yeager et al. [28] found that age significantly moderated the average effect size
                                across all studies. Specifically, they found that middle-aged adults (25–45 years) manifested
                                the weakest effects. Thus, we were interested in exploring whether age would influence
                                the effects of condition on the outcomes.
                                      In the light of these research gaps, the current investigation aims to answer the
                                following questions:
                                      Confirmatory questions:
                                (1)   Does making dynamic norms about reduced meat consumption in the UK salient lead
                                      to higher interest in reducing meat consumption (compared to static norm salience)?

                                Hypothesis 1 (H1). Participants exposed to dynamic minority norm information about reduced
                                meat consumption will report higher interest in reducing their meat consumption than will partici-
                                pants exposed to static minority norm information.

                                (2)   Will participants in the dynamic norm condition be more likely (than those in the
                                      static norm control) to predict a future decrease in meat consumption in the UK?

                                Hypothesis 2 (H2). Participants exposed to dynamic minority norm information about reduced
                                meat consumption will predict a larger decline in future meat consumption than will participants
                                exposed to static minority norm information.

                                      Exploratory questions:
                                (3)   Does dynamic norm (versus static norm) information lead to more positive attitudes,
                                      intentions, and expectations to reduce meat consumption?
                                (4)   Does age interact with norm condition to influence dependent variables?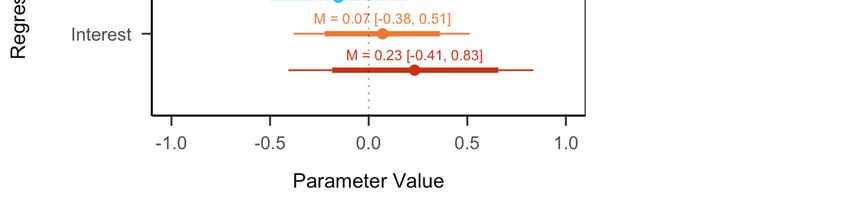
Sustainability 2021, 13, 8315                                                                                           4 of 17

                                (5)   Do demographic factors such as age, gender, and political position predict the primary
                                      dependent variables?

                                2. Method
                                2.1. Pilot Study
                                      We conducted a pilot study using a sample (N = 197) of the study population exploring
                                current perceived meat consumption norms in the UK in order to minimize the discrepancy
                                between the normative information used in the main study and people’s actual perception
                                of the norm.
                                      In line with Sparkman and Walton’s [8] approach to examining perceived norms,
                                participants were split into two groups where they were either asked to: (a) estimate the
                                percentage of people in the UK who make an effort to reduce their meat consumption, or
                                (b) the percentage of people who have started to make this effort. Each estimate corresponds
                                to the percentage used in either the static or dynamic norm condition, respectively. The
                                average estimates provided by both groups were in the region of 30% (see Table 1). All
                                participants were also asked if they had heard about a decrease in meat consumption in
                                the UK (Yes/No), and their expectations about future meat consumption (1 = Decrease,
                                2 = Stay the same, 3 = Increase). There was no difference between groups in estimation
                                of meat consumption norms, t(186.14) = 0.06, p = 0.950. There were also no significant
                                differences between conditions in the percentage aware of a decrease in meat consumption,
                                χ2 (1, N = 197) = 0.12, p = 0.727, or the percentage of participants expecting a decrease in
                                meat consumption, χ2 (2, N = 197) = 0.17, p = 0.919. The key findings are shown in Table 1.

                                Table 1. Pilot study results.

                                                                Perceived % of People
                                                                                          % Expecting        % Aware of
                                      Group              n          Making Effort
                                                                                           Decrease           Decrease
                                                                       M ± SD
                                       A               98          29.54% ± 14.43%           76.53%            61.22%
                                       B               99          29.39% ± 18.20%           74.75%            64.65%
                                      Total          N = 197       29.47% ± 16.39%           75.64%            62.94%

                                2.2. Main Study
                                2.2.1. Design and Procedure
                                     A double-blind, between-participants, experimental design was employed in the main
                                study. The study was presented as a survey on attitudes toward meat consumption. All
                                participants were directed from their recruitment platform to a Qualtrics survey and read
                                an introductory statement where we defined meat as any animal flesh, including pork,
                                chicken, beef, fish, etc. There were 3 conditions: in the experimental conditions, each
                                participant read a norm statement depicting either a static norm or a dynamic norm; in
                                the ‘no task’ control condition, participants did not read any text and so proceeded to the
                                dependent measures without an intervening task. All materials and preregistration are
                                publicly available online (https://osf.io/6bdfz/, accessed on 15 July 2021).
                                     To create the norm statements, we examined various sources to estimate the change
                                in meat consumption in the UK. National data estimates ranged between 26% and 33%
                                reduction in meat consumption (relative to 12 months prior to data collection) across the
                                UK [29–31]. Based on the results of the pilot study, we chose 30% as an estimate for the
                                created normative statements in order to enhance the believability of the normative infor-
                                mation; it transpires, fortuitously, that this is the same as the estimate used in Sparkman
                                and Walton’s [8] research.
                                     After participants read the statements and answered a free response question (“why
                                do you think this is?”), they completed dependent measures relating to meat consumption,
                                followed by demographic questions. Similar to the original study design, we included the
                                free response question “why do you think this is?” to increase participants’ engagement
                                with the text.
Sustainability 2021, 13, 8315 5 of 17
2.2.2. Participants
Prior to data collection, we planned to use a Bayesian stopping rule to stop data
collection once B > 6 or 5 or < 1/5 (https://osf.io/
6bdfz/, accessed on 15 July 2021).
We report a supplementary power analysis using standardized effect sizes in the
supplementary materials; however, this was not used in the study design or inferencing
(see S5.1).
A total of 1146 participants were recruited through a survey posted on Prolific, an
online participant recruitment platform. Of these, 300 were excluded from the reported
analyses: 184 because they did not complete the survey, 98 because they indicated being
vegan/vegetarians, five because they indicated that their results should not be included
in the analysis, and 13 who failed to select the correct response in an attention check.
The final sample (N = 846) ranged in age from 18 to 79 years (Mage = 37.21, SDage =
13.58; 56.38% female). Each participant received GBP 0.35 (approximately USD 0.45) for
completing the task.
2.3. Materials
2.3.1. Normative Statements
Norm statements were based very closely on those used by Sparkman and Walton [8].
Static norm. In the static norm condition, the text read: ‘Recent research has shown
that 30% of people in the UK make an effort to limit their meat consumption. That means
that 3 in 10 people in the UK eat less meat than they otherwise would. Why do you think
this is?’
Dynamic norm. In the dynamic norm condition, the text read: ‘Recent research has
shown that, in the last 5 years, 30% of people in the UK have now started to make an effort
to limit their meat consumption. That means that, in recent years, 3 in 10 people in the UK
have begun to eat less meat than they otherwise would. Why do you think this is?’
2.3.2. Dependent Measures
We measured interest in reducing meat consumption, attitudes toward meat consump-
tion, intentions and expectations regarding reducing own meat consumption. Additionally,
we measured expectations about future meat consumption in the UK. The items are listed
below (response scales options are indicated in parenthesis). These items are standard
items widely used in the literature (see [25,26]).
Interest. To measure interest in reducing meat consumption, participants responded
to a single item measure “How interested are you in eating less meat?” (not at all (1) to
extremely (7); [8]).
Items measuring attitudes towards reducing meat consumption and intentions to
reduce meat consumption were adapted from Fishbein and Ajzen [25].
Attitudes. To measure attitudes, participants responded to the statement: “My atti-
tude towards reducing my meat consumption is...” (extremely unfavourable (1) to extremely
favourable (7), and extremely negative (1) to extremely positive (7)). Participants also responded
to the statement “reducing my meat consumption would be . . . ” (extremely bad (1) to
extremely good (2)).Sustainability 2021, 13, 8315 6 of 17
Intentions. To measure intentions, participants responded to three statements: “I
intend to reduce my meat consumption within the next year”, “I plan to reduce my meat
consumption within the next year”, and “I will try to reduce my meat consumption within
the next year” (very strongly disagree (1) to very strongly agree (7)).
Expectations. To measure expectations to reduce meat consumption, participants
responded to a total of three statements. We adapted two items from Warshaw and
Davis [26]: “I am going to reduce my meat consumption from now on” and “I will reduce
my meat consumption from now on”, with responses on a 1–7 Likert scale from ‘extremely
unlikely’ to ‘extremely likely’. Participants also responded to “I expect to reduce my meat
consumption from now on” (very strongly disagree (1) to very strongly agree (7)).
Estimates of future meat consumption (‘Future Norm’). To assess whether the effect
of normative statements rests on the participant’s assumption that the norm will increase
in the future, participants responded to the statement, “In the next 5 years, I expect meat
consumption in the UK to . . . ” (decrease significantly (1) to increase significantly (7)).
Preconformity. We also used Sparkman and Walton’s [8] measure of preconformity
“In the foreseeable future, to what extent do you think that many people will make an effort
to eat less meat?” (not at all (1) to extremely (7)).
Estimate of current norm. Participants completed a series of questions to assess per-
ceptions of the static norm, and construal of limiting meat consumption across conditions
(adapted from [8]). The questions were presented in order to rule out alternative expla-
nations for the effect of the norm statements, specifically a shift in the perceived static
norm (please refer to the supplementary materials for the relevant secondary analyses). To
assess perceptions of the static norm, two items were added: “What percentage of people
do you think make an effort to limit their meat consumption?” (0 to 100%), and a Likert
scale measure “Roughly, how many people in the UK make an effort to limit their meat
consumption?” (none (1) to a lot (5)). To examine the construal of limiting meat consumption
by condition, participants estimated the number of meatless meals of 21 total meals eaten
each week by people who limited their meat consumption.
2.3.3. Demographic Variables
To control for participants’ background, participants reported their political position
(very left wing (1) to very right wing (7)), age, gender, and nationality.
3. Results
3.1. Data Analyses
3.1.1. Data Inspection
We transferred the data into RStudio and examined it to check randomization to
conditions: (a) ANOVA tests to compare participants’ age and political position, (b) Pear-
son chi-square tests to compare participants’ gender, and nationality. There were no
missing data.
We proceeded to analyse the data to answer each research question using the steps
outlined in the study’s pre-registration (https://osf.io/6bdfz/, accessed on 15 July 2021).
We deviated from the preregistered analyses in two aspects: (a) rather than creating a
structural path model with latent variables for the exploratory analyses, we used composite
scores for each construct in the path models due to the large correlation between the
items measuring each construct, and (b) measures of expectations and intentions to reduce
meat consumption were very highly correlated (r > 0.90) and were averaged to create
a composite score. We combined intentions and expectations because these constructs
are conceptually very close, and because the items commonly used to measure them are
closer still. In a discussion of intentions and expectations (and ‘willingness’), Fishbein
and Ajzen [25] suggest “available evidence to date suggests that there is little to be gained
by the proposed distinctions” (p. 41). We did not combine other items because of—what
we see to be—their conceptual distinctiveness (e.g., the conceptual distinction between
attitudes and intentions).Sustainability 2021, 13, 8315 7 of 17
3.1.2. Confirmatory Analysis
We used a Bayesian inferencing approach to answer the confirmatory research ques-
tions. A Bayesian approach made it possible to distinguish between the null hypothesis,
the alternative hypothesis, and lack of evidence for either. This is particularly important
in the wake of the replicability crisis, and mathematical modelling has shown that “most
published research findings are false” (see [33]).
To test our confirmatory hypotheses, we conducted direct contrasts to examine differ-
ences between conditions, rather than an omnibus test comparing the three conditions. We
used Bayes factors (B) to determine strength of evidence, with B < 1/5 taken as “moderate”
evidence for no effect—that is, null (H0 ) over the alternative (H1 ) hypothesis, B > 5 showing
moderate evidence for the null over H1 , and 1/5 < B < 5 indicating insensitivity to either
hypothesis [32]. Each model of H1 is a probability distribution of effects given a hypothesis.
To specify a model of H1 for each hypothesis test, we use a normal distribution centred on
zero for the prior distribution. We set the mode of the distribution at zero, and the standard
deviation (SD) is set to the approximate size of the predicted effect—the distribution’s scale
factor. The scale factors used in testing each confirmatory hypothesis are based on the
effects found in Sparkman and Walton [8]. Since our theory makes a directional positive
prediction for both confirmatory questions, we removed half of the distribution below zero
(see [34]).
Sensitivity analysis. To check how robust our conclusions are to changes in the
predicted effect, we used robustness regions. Robustness regions contain the range of scale
factors that would lead to the same conclusion reached by the Bayes factor [34].
Reporting. Reporting BHN(0,x) indicates that predictions of H1 were modelled as a
half-normal distribution with an SD of x where x is a scale factor for the expected effect
size [35]. We reported Robustness Regions (RR) for each B by giving the range of scale
factors that supported the same range of evidence as described above: RR [x1, x2] indicates
where the same conclusion is arrived at by the smallest (x1) and largest (x2) SD [36]. We
also reported p-values associated with all statistical tests conducted.
3.1.3. Exploratory Analysis
Due to the exploratory nature of our latter research questions, we rely on Bayesian
estimation methods rather than inferential statistical tools such as the Bayes factor or the
null-hypothesis significance test (for full discussion on advantages of Bayesian estimation,
see [37]). Bayesian estimation methods incorporate: (a) prior knowledge/assumptions
about a given parameter before data are collected, and (b) observed data. This results in
a posterior probability distribution for a given parameter capturing certainty about the
parameter value. Specifically, we obtain an interval with a probability that this interval
contains the regression coefficient [38].
All exploratory research questions were addressed using path models, estimated in R
using blavaan [39]. First, we fit a model exploring the effect of condition on the outcome
variables, following which we explored the potential interaction between condition and age
using multi-sample analysis. Finally, we fitted a full model with condition and demographic
variables as predictors of measured outcomes. For each regression parameter, we specified
the hyperparameters of their normal distribution: the mean and the standard deviation. The
mean refers to the parameter value we deem most likely, and the standard deviation reflects
our certainty about this value. The smaller the standard deviation, the higher our certainty
about a parameter value. Increased certainty about a parameter value reflected in the
prior increases the influence of the prior specification on posterior results. Uninformative
priors have little influence on estimated posterior distributions of a given parameter. We
implemented uninformative default priors for all parameters which do not take into
account any informed prior distributions (M = 0, SD = 10).
We determined how well the hypothesized model fitted the sample data using fit
indices. We used Markov chain Monte-Carlo sampling to make simulated draws from a
distribution and form a Markov chain that represents the posterior distribution. ThreeSustainability 2021, 13, 8315 8 of 17
Markov chains with 1500 iterations each were implemented for each parameter to estimate
posterior probability distributions. To assess chain convergence, the Gelman and Rubin
convergence diagnostic was implemented, in which values close to one indicate model
convergence. This diagnostic is referred to as the potential scale reduction factor (PSRF).
We also visually inspected the trace plots for each model parameter to ensure consistency
with the convergence diagnostic. To assess the model’s absolute fit, we used a posterior
predictive p (ppp) in which values closer to 0.5 indicate a model that fits the observed data,
and values closer to 0 indicate the opposite.
Sensitivity analysis. Incorporating information in the prior distribution of the model
parameters provides some direction for their estimation [40]. We implemented two addi-
tional models with varying priors for the regression parameters predicted by condition:
(a) model 2 using weakly informative priors (M = 0.50, SD = 0.75), and (b) model 3 us-
ing moderately informative priors (M = 0.50, SD = 0.35). We relied on the default prior
settings of blavaan for all other parameters across all models. To examine how parameter
estimates differ across models, we used the percentage of relative deviation of models
using informative priors compared to uninformative priors. The computation for percent
of relative deviation for a given model parameter is as follows: ((estimate from initial
model) − (estimate from expanded model)/(estimate from initial model)) × 100. We refer
to these as percentage of relative bias.
Reporting. We reported the estimated mean of the posterior distribution for each
regression parameter and the corresponding 95% posterior probability interval (PPI). The
PPI indicates a 95% probability that the population value lies between the lower and upper
limits of the PPI, allowing us to explore the range of plausible effect sizes for estimated
parameters [41]. We reported the percentage of relative bias for regression parameters from
the additional models to the default model estimated in blavaan. We used the WAMBS-
checklist for guidance on transparent reporting of Bayesian statistics [42].
3.2. Randomization Check
A preliminary randomization check was conducted. The check revealed no systematic
differences between the three conditions in terms of gender, age, political position, and
nationality (all p’s > 0.05; see Table 2 for the distribution).
Table 2. Means and Standard Deviations for Demographic Variables by Condition Including Statistical Tests for the
Randomization Check.
Item Dynamic Norm Static Norm No Task Significance Test
F(2, 843) = 0.89, MSE = 184.49,
Age (years) 37.34 ± 14.22 37.90 ± 12.97 36.40 ± 13.55
p = 0.409
Gender (%) Female (60.14%) Female (58.1%) Female (51.05%) χ2 (4, N = 846) = 6.92, p = 0.140
F(2, 843) = 0.39, MSE = 1.55,
Political position 3.47 ± 1.22 3.54 ± 1.26 3.45 ± 1.26
p = 0.679
England (84.06%) England (80.99%) England (80.77%)
Scotland (3.62%) Scotland (5.28%) Scotland (5.94%)
Nationality (%) Wales (9.78%) Wales (8.45%) Wales (8.74%) χ2 (6, N = 846) = 3.23, p = 0.779
Northern Ireland (0.72%) Northern Ireland (1.41%) Northern Ireland (1.75%)
Other (1.81%) Other (3.87%) Other (2.8%)
3.3. Preliminary Analysis
Means, SDs, Cronbach’s alpha coefficients, and correlations for all measures are
displayed in Table 3.Sustainability 2021, 13, 8315 9 of 17
Table 3. Means, Standard Deviations, Reliabilities, and Inter-Correlations Among Study Measures.
Correlations
Measure α M SD
1 2 3 4 5 6
1. Interest - 3.58 1.82
2. Attitude 0.90 4.64 1.29 0.80 **
3. Intention 0.98 4.22 1.80 0.83 ** 0.82 **
4. Expectation 0.99 3.93 1.75 0.80 ** 0.80 ** 0.92 **
5. Intention/expectation composite - 4.08 1.74 0.83 ** 0.83 ** 0.98 ** 0.98 **
6. Perception of change - 5.14 0.90 0.27 ** 0.26 ** 0.27 ** 0.25 ** 0.27 **
7. Preconformity - 4.18 1.20 0.44 ** 0.40 ** 0.39 ** 0.37 ** 0.39 ** 0.37 **
Note. α = Cronbach’s alpha. N = 846. ** p < 0.01. Measure of future norm was reverse coded in order to be positively scaled.
3.4. Research Question 1: Does Making Dynamic Norms about Reduced Meat Consumption in the
UK Salient Lead to Higher Interest in Reducing Meat Consumption (Compared to Static Norm)?
To answer this question, we replicated the analyses conducted in Sparkman and
Walton [8] to examine the differences between conditions. Sparkman and Walton [8]
found effects of dynamic norms on interest in reducing meat consumption ranging from
Mdiff = 0.60 to 0.78. We modelled H1 using a half-normal distribution with a mean of 0, and
SD of Mdiff = 0.69. Thus, the rough size of effect expected if there was an effect of dynamic
norm compared to static norm is Mdiff = 0.69. We will interpret all effects with respect to
the Bayes factors.
There was no difference in interest in reducing meat consumption between the dy-
namic norm (M = 3.64, SD = 1.83) and static norm (M = 3.68, SD = 1.84) conditions,
∆M = −0.03, 95% CI (−0.34 , 0.27), t(843) = −0.23, p = 0.821, d = −0.02, BHN(0,0.69) = 0.18,
RR (0.65, 2). Although, descriptively, participants in the no-task control condition showed
the least interest in reducing meat consumption (M = 3.41, SD = 1.77), they did not differ
significantly from those in the dynamic-norm condition, ∆M = 0.23, 95% CI (−0.07 , 0.53),
t(843) = 1.52, p = 0.130, d = 0.13, or the static-norm condition, ∆M = 0.27, 95% CI (−0.03 ,
0.57), t(843) = 1.76, p = 0.08, d = 0.15.
3.5. Research Question 2: Will Participants in the Dynamic norm Condition Be More Likely (Than
Static Norm Control) to Predict a Future Decrease in Meat Consumption in the UK?
We modelled H2 using a half-normal distribution with a mean of 0 and SD of Mdiff = 0.40.
The plausible maximum effect was set at twice the predicted effect of Mdiff = 0.80. A Bayes
factor was calculated for each test (see Tables S2.4 and S2.5).
There was no evidence for or against the presence of a difference between the dynamic
norm condition (M = 5.26, SD = 0.93) and static norm conditions (M = 5.20, SD = 0.85)
in expectations about future meat consumption, ∆M = 0.06, 95% CI (−0.08 , 0.21),
t(843) = 0.85 p = 0.397, d = 0.07, BHN(0,0.40) = 0.42, RR (0.05, 0.8).
There was no evidence for or against the presence of a difference between the dynamic
norm (M = 4.35, SD = 1.18) and static norm (M = 4.24, SD = 1.19) conditions in the
expectation that many people would make an effort to reduce their meat consumption
in the future, ∆M = 0.11, 95% CI (−0.09 , 0.31), t(843) = 1.08, p = 0.279, d = 0.09,
BHN(0,0.40) = 0.72, RR (0.05, 1.5).
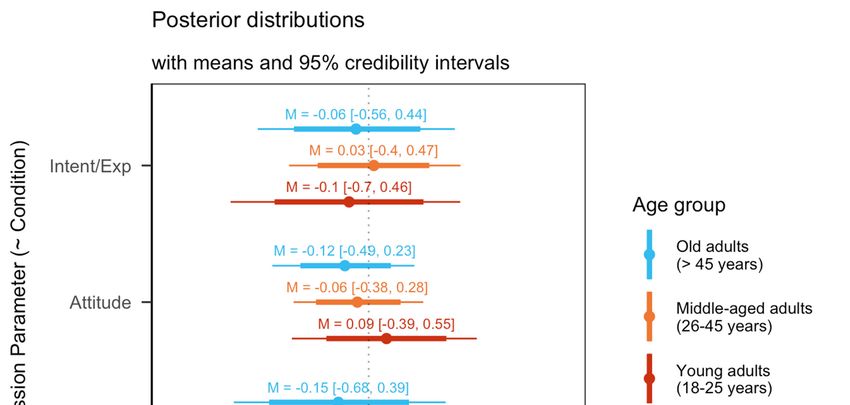
3.6. Research Question 3: Does Dynamic Norm (Versus Static) Information Lead to More Positive
Attitudes, Intentions, and Expectations to Reduce Meat Consumption?
We conducted an exploratory path analysis to explore the effect of condition on meat
consumption outcomes. We estimated the path model using non-informative priors in
blavaan, followed by two models with increasing degrees of information as a method
for detecting how much influence our informative priors had on the posterior results.
A visual inspection of each model’s trace plots suggest that sampling chains converged
(see Figures S4.1–S4.3). The mean estimates of the posterior distributions were relatively
low for interest (M = 0.04, SD = 0.16), attitudes (M = −0.05, SD = 0.11) and the compositeSustainability 2021, 13, 8315 10 of 17
index of intentions and expectations (M = −0.04, SD = 0.14). With increasing degrees of
information, mean regression parameter coefficients increased. Figure 1 shows the posterior
Sustainability 2021, 13, x FOR PEERdistributions
REVIEW of the regression parameters across the three models. Thin horizontal 11 of 18
lines
indicate the 95% PPI for a given parameter, and thick horizontal lines indicate the 80% PPI.
Figure
Figure Simple
1. 1. path
Simple model.
path model.Note. TheThe
Note. x-axis shows
x-axis estimated
shows regression
estimated parameters
regression predicted
parameters by condition
predicted (dynamic
by condition vs.
(dynamic
static norm).
vs. static The point
norm). estimates
The point indicate
estimates the mean
indicate of each
the mean posterior
of each probability
posterior distribution.
probability The 95%
distribution. The PPI
95%are
PPIindicated by
are indicated
thebythin
thehorizontal
thin horizontal
lines.lines.
ThickThick
lines lines indicate
indicate thePPI.
the 80% 80% PPI.
3.7.To understand
Research the4:exact
Question Does influence of with
Age Interact priors, weCondition
Norm estimatedtothe relative
Influence bias of both
Dependent
informative
Variables? models (models 2 and 3) compared to the uninformative model (model 1).
The informative priors had a large influence on the posterior results of the regression
We conducted a multi-sample path analysis exploring the differences in relationships
coefficients (model 1 vs. model 2 = −130.56% to 122.5%; model 1 vs. model 3 = −413.89%
between condition and meat consumption outcomes. We explored the differences in esti-
to 390%). Due to the relative bias in posterior results, we conclude that there is a difference
mates based on age groups: (a) young adults (18–25 years), (b) middle-aged adults (26–45
based on prior settings, and that different models result in different conclusions. The model
years), and (c) old adults (>45 years). We estimated the path model using non-informative
that fits the observed data best was model 1, ppp = 0.499 (see Table S4.1). In summary, the
priors in blavaan, followed by two models with increasing degrees of information as a
estimates and credibility intervals do not suggest an effect of condition on the measured
method for detecting how much influence our informative priors had on the posterior
meat consumption outcomes.
results. A visual inspection of each model’s trace plots suggest that sampling chains con-
verged
3.7. (seeQuestion
Research Figures 4:S4.6–S4.8).
Does Age Interact with Norm Condition to Influence
The Variables?
Dependent 95% PPI suggest that younger adults (aged 18 to 25) had increased interest and
positive attitudes towards
We conducted reducingpath
a multi-sample meatanalysis
consumption. Figure
exploring the2differences
shows the posterior dis-
in relation-
tributions
ships between of the regression
condition andparameters in the model
meat consumption with uninformative
outcomes. We explored the priors. Thin hor-
differences
inizontal lines
estimates indicate
based the groups:
on age 95% PPI (a)
for young
a givenadults
parameter,
(18–25and thick(b)
years), horizontal lines adults
middle-aged indicate
the 80% PPI.
(26–45 years), and (c) old adults (>45 years). We estimated the path model using non-
We estimated
informative priors inthe relative
blavaan, bias of both
followed informative
by two models
models with (models degrees
increasing 2 and 3) compared
of infor-
to the uninformative model (model 1). The informative priors
mation as a method for detecting how much influence our informative priors had a large influence
had onon the
the
posteriorresults.
posterior results A
of visual
the regression
inspectioncoefficients (model 1trace
of each model’s vs. model
plots 2suggest
= −201.56 % sampling
that to 296.15%;
modelconverged
chains 1 vs. model(see3 Figures
= −542.19% to 942.31%). Due to the relative bias in posterior results,
S4.6–S4.8).
we conclude that there is a difference based on prior settings, and that different models
result in different conclusions. The model that fits the observed data best was model 1,
ppp = 0.486 (see Table S4.2). In summary, although young adults appeared to show more
positive attitudes and interest in reducing their meat consumption, the estimates and
credibility intervals do not suggest the presence of a difference in the effect of conditionSustainability 2021, 13, 8315 11 of 17
Sustainability 2021, 13, x FOR PEER REVIEW 12 of 18
The 95% PPI suggest that younger adults (aged 18 to 25) had increased interest and
positive attitudes towards reducing meat consumption. Figure 2 shows the posterior
distributions of the regression parameters in the model with uninformative priors. Thin
possible moderating
horizontal effect
lines indicate theof95%
agePPI
using
forage as a continuous
a given parameter, variable,
and thickrather than alines
horizontal cate-
gorical the
indicate one80%
(see PPI.
Table S4.3).
Figure2.2.Multi-sample
Figure Multi-sampleofofsimple
simplepath
pathmodel
modelestimated
estimatedusing
usinguninformative
uninformativeregression
regression priors.Note.
priors. Note.Beta
Betaprior
prior= =normal
normal
(0,10),
(0,10),model
modelfit
fit(ppp
(pppvalue)
value) == 0.486.
0.486. Posterior
Posteriorprobability
probabilitydistributions
distributionsofof meat
meat consumption
consumption outcomes
outcomes predicted
predicted by
by con-
dition and
condition measured
and measured demographic
demographic variables are shown.
variables The point
are shown. estimates
The point indicate
estimates the mean
indicate theofmean
each of
posterior probabil-
each posterior
ity distribution.
probability The 95%
distribution. ThePPI
95%arePPI
indicated by the by
are indicated thinthe
horizontal lines. Thick
thin horizontal lines. lines
Thickindicate the 80%
lines indicate PPI.
the 80% PPI.
3.8. We estimated
Research the relative
Question 5: How Do biasDemographic
of both informative models
Factors (Age, (models
Gender, and 2Political
and 3) Position)
compared
toPredict
the uninformative modelVariables
Primary Dependent (model 1). The informative
Relating priors had a large influence on the
to Meat Consumption?
posterior
Weresults of thefurther
conducted regression
pathcoefficients (model 1 vs. model
analyses incorporating 2 = −201.56
demographic % to
factors 296.15%;
such as age,
model 1 vs. model 3 = − 542.19% to 942.31%). Due to the relative bias
gender, and political position as predictors of meat consumption outcomes. We used in posterior results,
un-
we conclude that there is a difference based on prior settings, and that
informed beta priors for all regression parameters predicted by demographic variables. A different models
result
visualininspection
different conclusions.
of each model’s Thetrace
model that
plots fits the
suggest observed
that sampling data bestconverged
chains was model(see1,
ppp = 0.486 (see Table S4.2). In summary, although young adults appeared to show more
Figures S4.10–S4.12).
positive attitudes and interest in reducing their meat consumption, the estimates and
The 95% PPI suggest that gender and political position consistently predict all meat
credibility intervals do not suggest the presence of a difference in the effect of condition
consumption-related outcomes across all models. Specifically, women and left-leaning
based on age groups. Similarly, the conclusions remained the same when we explored
participants were more likely to report positive outcomes. Figure 3 shows the posterior
the possible moderating effect of age using age as a continuous variable, rather than a
distributions of the regression parameters in the model with uninformative priors. Thin
categorical one (see Table S4.3).
horizontal lines indicate the 95% PPI for a given parameter, and thick horizontal lines
indicate
3.8. theQuestion
Research 80% PPI.5: How Do Demographic Factors (Age, Gender, and Political Position)
We estimated
Predict Primary Dependentthe relative biasRelating
Variables of bothto
informative models (models 2 and 3) compared
Meat Consumption?
to the
Weuninformative
conducted furthermodel (model
path 1). The
analyses informative demographic
incorporating priors had a large influence
factors such ason the
age,
posterior results of the regression coefficients (model 1 vs. model
gender, and political position as predictors of meat consumption outcomes. We used 2 = −177.78 % to 58.73%;
model 1 vs.beta
uninformed model 3 = for
priors −783.33% to 230.16%).
all regression Due topredicted
parameters the relative bias in posterior
by demographic results,
variables.
we conclude that there is a difference based on prior settings, and that different models
result in different conclusions. The model that fits the observed data best was model 1,
ppp = 0.501 (see Table S4.4).Sustainability 2021, 13, 8315 12 of 17
A visual inspection of each model’s trace plots suggest that sampling chains converged
(see Figures S4.10–S4.12).
The 95% PPI suggest that gender and political position consistently predict all meat
consumption-related outcomes across all models. Specifically, women and left-leaning
participants were more likely to report positive outcomes. Figure 3 shows the posterior
distributions of the regression parameters in the model with uninformative priors.
Sustainability 2021, 13, x FOR PEER REVIEW 13 Thin
of 18
horizontal lines indicate the 95% PPI for a given parameter, and thick horizontal lines
indicate the 80% PPI.
Figure Fullpath
3. Full
Figure 3. pathmodel
modelestimated
estimatedusing
usinguninformative
uninformative regression
regression priors.
priors. Note.
Note. BetaBeta prior
prior = normal
= normal (0,10),
(0,10), modelmodel fit
fit (ppp
(ppp
value)value) = 0.501.
= 0.501. Posterior
Posterior probability
probability distributions
distributions of meat
of meat consumption
consumption outcomes
outcomes predictedby
predicted bycondition
conditionand
and measured
measured
demographic variables are shown. The point estimates indicate the mean mean ofof each
each posterior
posterior probability
probability distribution.
distribution. The
indicated by
95% PPI are indicated by the
the thin
thin horizontal
horizontal lines.
lines. Thick
Thick lines
lines indicate
indicate the
the 80%
80% PPI.
PPI.
We estimated
3.9. Unregistered the relative
Exploratory bias of both informative models (models 2 and 3) compared
Analyses
to theWe
uninformative model (model
conducted additional analyses1). The informative
to examine priorsdemographic
whether had a large influence onmay
variables the
posterior results of the regression coefficients (model 1 vs. model 2 = −177.78 % to 58.73%;
moderate the effect of the manipulation used on measured outcomes. We found no evi-
model 1 vs. model 3 = −783.33% to 230.16%). Due to the relative bias in posterior results,
dence for a moderating effect of any demographic variable on interest, attitudes, or inten-
we conclude that there is a difference based on prior settings, and that different models
tions (see Tables S5.1–S5.3). To explore whether attitudes may be a mediator of the effect
result in different conclusions. The model that fits the observed data best was model 1,
of condition on intentions and expectations to reduce meat consumption, we conducted a
ppp = 0.501 (see Table S4.4).
path analysis, but we did not find evidence for a partial or total mediation (see Table S5.4).
3.9. Unregistered Exploratory Analyses
4. Discussion
We conducted additional analyses to examine whether demographic variables may
This study
moderate examined
the effect the effect of used
of the manipulation dynamic norms on
on measured various meat
outcomes. consumption-re-
We found no evidence
lated outcomes. Although
for a moderating previous
effect of any research found
demographic that
variable onproviding information
interest, attitudes, about dy-
or intentions
namic (changing) minority norms increased interest in engaging in minority
(see Tables S5.1–S5.3). To explore whether attitudes may be a mediator of the effect ofbehaviour,
the currenton
condition study did not
intentions andfind evidence for
expectations tothis effect.
reduce meatThere was no difference
consumption, between
we conducted a
any condition or combination of conditions on meat consumption-related outcomes (viz.,
path analysis, but we did not find evidence for a partial or total mediation (see Table S5.4).
interest, attitudes, intentions, expectations). There was no evidence for or against the pres-
ence of a difference in predicted future meat consumption in the UK. Gender and political
orientation were associated with all meat consumption-related outcomes: participants
who identified as female, and participants who were politically left-leaning, were more
likely to report positive interest, positive attitudes, positive intentions, and positive ex-Sustainability 2021, 13, 8315 13 of 17
4. Discussion
This study examined the effect of dynamic norms on various meat consumption-
related outcomes. Although previous research found that providing information about
dynamic (changing) minority norms increased interest in engaging in minority behaviour,
the current study did not find evidence for this effect. There was no difference between
any condition or combination of conditions on meat consumption-related outcomes (viz.,
interest, attitudes, intentions, expectations). There was no evidence for or against the
presence of a difference in predicted future meat consumption in the UK. Gender and
political orientation were associated with all meat consumption-related outcomes: partici-
pants who identified as female, and participants who were politically left-leaning, were
more likely to report positive interest, positive attitudes, positive intentions, and positive
expectations vis-a-vis reducing their own meat consumption. Additionally, age did not
appear to moderate the effect of condition on any of the primary dependent variables.
4.1. Strengths
This study replicated the design of the original research [8] very closely using a UK
sample. Randomization checks suggested no differences in any demographic distribution
that could have influenced the results. Much social psychological research uses samples of
primarily university undergraduates; although true random sampling was not possible,
conducting our study online using a relatively diverse sample allows us to increase the
generalizability of our findings [28]. We examined additional outcomes of interest, such
as attitudes toward reducing meat consumption, intentions to reduce own consumption,
and expectations to do so. We also included a ‘no norm’ control to compare the effects
of presenting different normative information to presenting none at all. The analyses
used Bayesian inferencing, allowing us to discriminate between the null hypothesis and
insensitive results. It also made it possible to examine the influence of our Bayesian priors
on the results and estimate the bias between results from models with uninformative priors,
and models with varied prior distributions. We also conducted a sensitivity analysis for all
Bayesian effect sizes and reported robust estimates for all statistical tests conducted.
4.2. Limitations
We did not include a manipulation check to ascertain whether the dynamic norm was
salient in that experimental condition, so it is difficult to infer whether we the failure to
replicate the effect of dynamic norm information on interest in reducing meat consumption
is due to the particular manipulation used or to dynamic norm information, in itself. In
addition, there is increasing media coverage and awareness of increasing availability of
plant-based foods, as well as a rise in veganism/vegetarianism [43]. The amount of plant-
based supermarket ready-meals offered in the UK increased from 3% in 2018 to 16% in 2020,
and most retailers expanded their plant-based options [44]. It is possible that participants
in the control and static norm conditions were aware of the changing norms without us
highlighting it experimentally. Another noteworthy point was the wording of the normative
information: it is difficult to discern how participants construed the meat consumption
norm in each condition and whether “are making an effort” in the static norm condition
was construed differently from “starting to make an effort” in the dynamic norm condition,
for example. We also did not include a measure of in-group identification to test whether
the study sample actually identified with the UK population (which was used as a reference
group). Evidence shows that normative social influence is strengthened when participants
identify with the reference group, and ingroup identification may be a potential moderator
for the effect of perceived social norms (e.g., [45,46]). Another limitation is that we only
used one item to measure interest in reducing meat consumption. Moreover, despite
adapting Fishbein and Ajzen’s [25] widely-used items to measure attitudes, intentions, and
expectations, we did not conduct independent psychometric assessment to support the
appropriateness of treating these measured variables as conceptually distinct. Furthermore,
our approach does not take a position on the ontological status of, for example, attitudesSustainability 2021, 13, 8315 14 of 17
(e.g., the extent to which measured attitudes represent a latent construct of some sort
or represent an expressive act of communication). We have relied on (the face validity
of) popular questionnaire items. We do not have psychometric evidence concerning the
conceptual distinctions that we have made. Future studies may benefit from alternative
approaches to measuring these constructs. Additionally, we found the three-item scales
used to measure attitudes, intentions, and expectations all to be highly correlated, with
Cronbach’s alpha values above 0.90. This may be an indication of the redundancy of
items used, or a narrow coverage of the constructs [47]. Although we measured intentions
as a possible proxy for behaviour, correlations between intentions and behaviours are
modest, and people’s past behaviour may be a better predictor of behaviour in certain
situations [48]. Including past consumption of meat as a potential moderator of normative
social influence, and predictor of intentions to limit meat consumption.
4.3. Summary and Recommendations for Further Research
There could be multiple reasons why we could not replicate the effect of dynamic norm
information reported by Sparkman and Walton [8]. Previous research on dynamic norms
has been mostly conducted on US-based samples, so it is possible that such interventions
are more effective in particular populations. Furthermore, given the rise in availability
of meat alternatives and vegetarian options in stores and restaurants, it is possible that
participants are already aware of the dynamic nature of meat-eating norms in the UK.
Indeed, in our pilot study, 62.94% of participants reported being aware of a decrease in
meat consumption in the UK. Moreover, 84.16% of participants in our study estimated that
meat consumption would decrease in the next five years. Considering that Sparkman and
Walton [8] found that expectations about future meat consumption mediate the effect of
dynamic norms on interest in reducing meat consumption, participants may already have
been influenced by their perception of a changing norm, regardless of the manipulation.
Perhaps in addition to increasing the salience of the dynamic nature of current norms (in
one condition), the static feature of the static norm manipulation could likewise be made
more explicit, and thereby more salient.
Another challenge lies in manipulating salience of dynamic norms in order to increase
their distinctiveness from static norms. Visual cues depicting the dynamic or static aspect of
the norms may be used to examine if people respond positively to such information (cf. [49]).
Moreover, the phrasing of the normative information could perhaps be improved by
removing the ambiguity of whether the reference population is actually succeeding or not in
making an effort to limit their meat consumption. A possible reason that the manipulation
did not work is that participants did not sufficiently engage with the text. Visual cues may
be a promising alternative method of communicating normative information.
It would be beneficial for future research to explore possibilities for manipulation
checks, and alternative phrasing of the normative information. It is possible that explicitly
stating the prevalence/amount of meat consumption in the past as well as in the present
could make the change more salient, thereby inducing different effects. Furthermore, there
is potential for changing the format of the normative information to depict an increas-
ing norm. For example, rather than using percentage engagement in desired minority
behaviour, using the number of people engaged (cf. [50]) could result in different effects
(e.g., 20 million UK people, as opposed to 30% of the UK population). It would also be
interesting to assess the effect of potential moderator variables such as personality, identity,
in-group identification, and cultural orientation in order to explore how these interact
with normative information to affect key outcomes. With few exceptions (e.g., [17]), most
published research on dynamic norms uses samples from Western, educated, industrialized,
rich and democratic (WEIRD) societies. In fact, a recent systematic review of social psycho-
logical research on climate change shows that 109 out of 118 reviewed studies involved
samples or data from WEIRD countries [51]. Future research should explore the effects
of dynamic norm research in varied contexts to broaden demographic representation. In
Wynes et al.’s [52] review of behavioural interventions to reduce greenhouse gas emissions,You can also read