Dynamic prokaryotic communities in the dark western Mediterranean Sea - Nature
←
→
Page content transcription
If your browser does not render page correctly, please read the page content below
www.nature.com/scientificreports
OPEN Dynamic prokaryotic communities
in the dark western Mediterranean
Sea
1,2*
Catalina Mena , Rosa Balbín1, Patricia Reglero1, Melissa Martín1, Rocío Santiago1 &
Eva Sintes1
Dark ocean microbial dynamics are fundamental to understand ecosystem metabolism and ocean
biogeochemical processes. Yet, the ecological response of deep ocean communities to environmental
perturbations remains largely unknown. Temporal and spatial dynamics of the meso- and bathypelagic
prokaryotic communities were assessed throughout a 2-year seasonal sampling across the western
Mediterranean Sea. A common pattern of prokaryotic communities’ depth stratification was observed
across the different regions and throughout the seasons. However, sporadic and drastic alterations
of the community composition and diversity occurred either at specific water masses or throughout
the aphotic zone and at a basin scale. Environmental changes resulted in a major increase in the
abundance of rare or low abundant phylotypes and a profound change of the community composition.
Our study evidences the temporal dynamism of dark ocean prokaryotic communities, exhibiting long
periods of stability but also drastic changes, with implications in community metabolism and carbon
fluxes. Taken together, the results highlight the importance of monitoring the temporal patterns of
dark ocean prokaryotic communities.
Marine prokaryotes are crucial for the global ocean biogeochemical cycles1. The relation between the prokaryotic
community composition, metabolic activity and biogeochemical fluxes is critical in ecosystem function and thus
to understand ecosystem response to natural or anthropogenic c hanges2. The dark ocean constitutes 90% of the
ocean’s volume and harbours more than 75% of the ocean’s prokaryotic biomass3.One-third of the ocean’s carbon
dioxide production occurs in the dark o cean4,5, whereas inorganic carbon fixation substantially contributes to
the organic carbon demand of heterotrophic organisms in the deep ocean6. Evidence based on growth efficiency
measurements suggests prokaryotic organic carbon processing in the deep waters can be as important as in the
sunlit ocean w aters7. Additionally, high levels of extracellular enzymatic activity have been revealed in the dark
ocean related to particulate organic matter degradation8.
The decreasing quantity and quality of energy and carbon sources available with depth is a major factor
shaping prokaryotic community s tructure9,10 and activity11. The water masses act as drivers of the geographical
patterns of deep ocean prokaryotes, through water mass circulation and a ging12. The connectivity of microbial
communities throughout the water column can take place through sinking of organic p articles13,14. Thus, sea-
sonality and dynamics of surface waters, which determine the formation and quality of organic particles, is the
foremost factor shaping the dynamics and temporal patterns of deep prokaryotic communities composition and
activity14–18. Several studies have unveiled a stronger influence of surface conditions in bathypelagic than in the
intermediate mesopelagic c ommunities14,19, related to fast sinking particles. Other recurrent or sporadic physical
events, such as deep water column mixing or a dvection20–22, likely modulate the composition of deep microbial
communities through transport of microbes and nutrients. However, despite the growing evidence of intense
prokaryotic activity and diversity of metabolic pathways in the dark ocean, their temporal dynamics and the
response of these communities to environmental disturbances remains poorly c haracterized23,24.
The Mediterranean Sea is an oligotrophic semi-enclosed concentration basin characterized by its high salinity
and temperature25,26. The Mediterranean bathypelagic waters (~ 13ºC) are warmer than other oceans at similar
depths (3-5ºC), and uphold higher rates of prokaryotic activity and organic matter r emineralization27,28. Deep
Western Mediterranean Sea microbial communities are characterized by higher richness and evenness than
surface communities29,30, whereas surface and bottom communities show similar assimilation rates of complex
extracellular compounds31. The Levantine intermediate water (LIW) and the western Mediterranean deep water
1
Instituto Español de Oceanografía, Centre Oceanogràfic de Les Balears, Ecosystem Oceanography Group
(GRECO), Moll de Ponent s/n 07015, Palma, Spain. 2Present address: IFREMER – Centre Bretagne Z.I., Technopôle
Brest‑Iroise Pointe du Diable BP70, 29280Plouzané, France. *email: Catalina.Mena.Oliver@ifremer.fr
Scientific Reports | (2021) 11:17859 | https://doi.org/10.1038/s41598-021-96992-3 1
Vol.:(0123456789)www.nature.com/scientificreports/
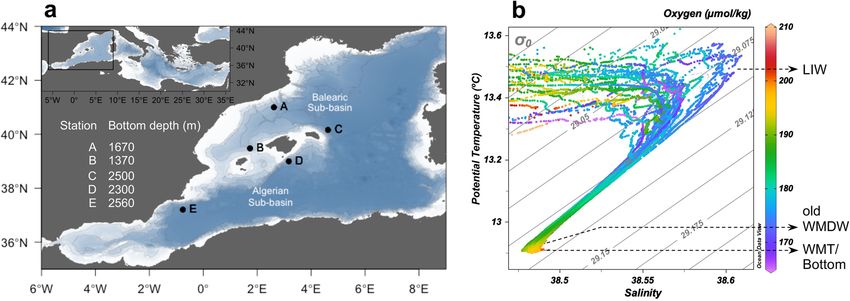
Figure 1. Sampling locations and depths across the western basin of the Mediterranean Sea. (a) Map of
sampling stations (labelled black dots). The bottom depth is indicated for each station. Coastline and bathymetry
from NOAA database (https://www.noaa.gov), using the ‘marmap’ package of R. (b) Potential temperature—
salinity diagram (T–S) of all stations and cruises, colour scale corresponds to oxygen concentration (µmol k g−1).
The water masses sampled are indicated: Levantine intermediate water (LIW), old western Mediterranean deep
water (old WMDW) and Western Mediterranean Transition or bottom (WMT/bottom).
(WMDW) are the main meso- and bathypelagic water masses in the western Mediterranean Sea, respectively. The
LIW, characterized by a salinity maximum and oxygen minimum, is formed in the eastern basin and flows into
the western basin at 300–500 m depth. The WMDW is formed in the Gulf of Lions, at the north of the western
basin, and spreads along the western basin below the LIW having limited water exchange with the eastern Medi-
terranean basin. A mixture of LIW and WMDW spills into the Atlantic Ocean through the Strait of Gibraltar32.
A bottom-reaching convective event in 2005, termed the Western Mediterranean Transition (WMT), produced
a large amount of dense water and resulted in the formation of a new deep-water mass, increasing the general
warming and salting of the deep w aters33,34.
Diverse physical phenomena have been described in the Mediterranean Sea, such as open-sea intense con-
vective mixing, cascading of dense shelf waters and other mesoscale d ynamics35,36, that can have an effect on
deep-sea community composition and activity20,21. These hydrographic dynamics can transport surface com-
munities to deeper layers, increase ventilation and sediment resuspension and hence, change the quality and
quantity of organic matter pools37–40. Consequently, recurrent or occasional environmental disturbances likely
affect the metabolic dynamics of prokaryotic communities and the biogeochemical processes. The sensitivity
and response of the prokaryotic community after an environmental disturbance has substantial consequences
on the subsequent ecosystem function. Low abundant and rare microbial taxa are able to persist in a low activ-
ity state throughout long periods of scarcity of energy s ources41 and become abundant following changes in
environmental conditions42. Hence, these rare taxa provide metabolic flexibility to the community42. However,
the response of dark ocean communities to temporal disturbances and the identification of the members leading
the ecosystem response remain largely unknown.
In this study we aim to assess the temporal and spatial dynamics of the dark prokaryotic communities,
identifying shifts in community structure related to environmental changes. We have characterized the com-
munity composition and diversity of the meso- and bathypelagic water masses in different regions of the western
Mediterranean basin over a 22-month period. Our results show that the dark prokaryotic communities are
depth-stratified and temporally dynamic throughout the basin, occasionally exhibiting pronounced changes in
community composition, cell abundance and contribution of high nucleic acid (HNA) cells to the prokaryotic
community at several spatial scales. The compositional dynamics of dark prokaryotic communities and their
ecological implications are discussed.
Results
Environmental characteristics. Temperature, salinity and oxygen concentration characterized the
three water masses studied: the Levantine intermediate water (LIW), old western Mediterranean deep water
(oWMDW) and bottom (Fig. 1b). LIW was characterized by a salinity maximum (38.52–38.61) and the water
column oxygen minimum (164.23–185.48 μmol kg−1) (Fig. 1b). The core depth of the LIW was located between
300–550 m throughout the study. LIW depth deepened at stations A and C (north and south of the Balearic sub-
region, respectively) over the study period, concurrently with an increase in salinity concentration at station C
(up to 38.61) (Supplementary Fig. S1). The oWMDW showed intermediate salinity (38.48–38.53) and tempera-
ture (θ < 13 °C) values between LIW and bottom. The bottom depth ranged between 1370 and 2560 m (Fig. 1a).
The water close to the sea bottom at stations C, D and E (> 2000 m bottom depth) corresponded to the Western
Mediterranean Transition as determined by its hook shaped signature in the T–S diagram.
In April 2016 a bottom water ventilation event, i.e., an increase of oxygen concentration at bottom waters, was
observed at the three deepest stations (C, D and E). This ventilation, observed both with the oxygen sensor and
Scientific Reports | (2021) 11:17859 | https://doi.org/10.1038/s41598-021-96992-3 2
Vol:.(1234567890)www.nature.com/scientificreports/
Figure 2. Composition of the meso- and bathypelagic prokaryotic communities. (a) Contribution of
prokaryotic families to the community in the different water masses. Families that contribute ≥ 0.8% in at least
one water mass are shown. Phylotypes are ordered according to the hierarchical clustering based on Bray–Curtis
dissimilarity index using the ‘heatmap’ function in the ‘gplot’ package of R. (b) Phylotypes at family level that
change their contribution ≥ 0.5% among the different water masses. Change between LIW and oWMDW in light
grey and change between oWMDW and bottom in dark grey. Legends indicate Order_Family. NA: not assigned;
LIW: Levantine intermediate water; oWMDW: old western Mediterranean deep water.
Winkler methodology, was remarkable from approximately 1800 m to the bottom, with an increase of > 200 μmol
O2 kg−1 as compared to < 197 μmol O 2 kg−1 in other months (Supplementary Fig. S1). At stations A and B
(< 1700 m bottom depth) no substantial increase in bottom oxygen concentration was observed (Supplementary
Fig. S1).
Nitrate reached maximum concentrations at LIW (9.21 ± 0.06 µM, mean ± s.e.m) and decreased slightly
with depth (8.80 ± 0.07 µM at the bottom). Phosphate reached 0.37 ± 0.008 µM at LIW and oWMDW, decreas-
ing to 0.35 ± 0.01 µM at the bottom. Silicate concentration increased with depth, from 7.17 ± 0.12 µM at LIW
to 9.10 ± 0.09 µM at the bottom. Nitrite concentration exhibited a mean concentration of 0.006 ± 0.001 µM
throughout the meso- and bathypelagic zone (Supplementary Table S1). Noticeably, phosphate concentrations
experienced a decrease in June and October 2016 at all stations through the water column, ranging 0.16–0.41 µM
(Supplementary Table S1).
Prokaryotic community composition
The prokaryotic community structure and composition was depth-stratified throughout the study area and
sampling period. Prokaryotic abundance decreased with depth, ranging from 1.25 ± 0.06 × 10⁵ cells mL−1
(mean ± S.E.M) at LIW to 0.65 ± 0.03 and 0.53 ± 0.03 × 10⁵ cells mL−1 at oWMDW and bottom, respectively,
and varied seasonally, reaching minimum values during autumn and maximum values during summer (Sup-
plementary Fig. S2 and Table S1). The contribution of HNA population was maximum at the bottom waters
(55.64 ± 1.17%, mean ± S.E.M), followed by the LIW (52.17 ± 1.31%) and the oWMDW (50.33 ± 1.11%) (Sup-
plementary Fig. S2 and Table S1). Phylogenetic diversity of bottom water communities was significantly higher
compared to the other water masses (ANOVA, P < 0.001, Supplementary Fig. S3). Shannon index and evenness
decreased significantly with depth (ANOVA, P < 0.001, Supplementary Fig. S3).
A total of 6570 ASVs (amplicon sequence variants) were identified in the whole dataset before rarefaction.
29, 20 and 24% of the ASVs were found only in the LIW, oWMDW and bottom water, respectively, and 9.5%
of ASVs were shared between the three water masses (Supplementary Fig. S4). These shared ASVs contributed
73, 82 and 74% in abundance at LIW, oWMDW and bottom water, respectively (Supplementary Fig. S4). The
variation in the contribution of the most abundant prokaryotes at family level between water masses is shown
in Fig. 2. Nitrosopumilaceae was the most abundant phylotype at the family level in the meso- and bathypelagic
western Mediterranean Sea waters, decreasing its contribution to the community with depth from 40.6% in the
LIW to 39.2% in the oWMDW and 35.3% at the bottom water (Fig. 2a). Therefore, Nitrosopumilaceae abundance
decreased with depth from 5 ± 0.3 × 10⁴ cells mL−1 (mean ± S.E.M) at LIW to 2.5 ± 0.1 and 1.9 ± 0.1 × 10⁴ cells
mL−1 at the oWMDW and bottom, respectively. SAR11 clade I contributed similarly (5.5–8.8%) than clade II
(7–8.7%) to the prokaryotic communities, decreasing their abundance with depth. SAR11 clade I abundance
Scientific Reports | (2021) 11:17859 | https://doi.org/10.1038/s41598-021-96992-3 3
Vol.:(0123456789)www.nature.com/scientificreports/
Figure 3. Principal coordinates analysis (PCoA) of aphotic Mediterranean Sea prokaryotic communities.
Principal coordinates analysis (PCoA) of prokaryotic communities based on (a) Bray Curtis and (b) weighted
UniFrac distance matrices. The percentage of variance explained by each principal coordinate is indicated in the
corresponding axis. Water masses are shape coded and cruises are colour coded. LIW: Levantine intermediate
water; oWMDW: old western Mediterranean deep water.
was 11 ± 1, 5 ± 0.3 and 3 ± 0.2 × 10³ cells m
L−1 at LIW, oWMDW and bottom, respectively, whereas SAR11 clade
II abundance was 8.6 ± 0.5, 5.7 ± 0.4 and 3.7 ± 0.3 × 10³ cells mL−1 at LIW, oWMDW and bottom, respectively. The
relative abundance of SAR324 families (Deltaproteobacteria) decreased from 6% in the LIW and oWMDW to
3.8% in the bottom water (Fig. 2a). Members of Nitrospinaceae accounted for 2% of the community in the LIW
and decreased to < 1% in the bottom water. Members of families SAR202 (Dehalococcoidia), Flavobacteriaceae,
SAR324 (Deltaproteobacteria), Moraxellaceae, Thioglobaceae and members of Marine Group II (Thermoplas-
mata) comprised 0–6% of the community and exhibited changes in relative abundance > 1% between water
masses (Fig. 2b). Families of Subgroup 6 (Acidobacteria), of Rhodospirillales and SAR86 (Gammaproteobacteria)
contributed > 1% to the community, however, they did not significantly differ between water masses. Low abun-
dance family phylotypes (i.e., contributing < 1% relative abundance to the community) showed less pronounced
changes in relative abundance with depth than the abundant phylotypes (> 1% relative abundance) (Fig. 2).
Principal coordinate analysis based on Bray Curtis (considering ASVs abundance) showed clustering of
communities according to water masses and cruise (Fig. 3a). These variables explained 36 and 8.3% of com-
munity variability (PERMANOVA), respectively. Weighted UniFrac distance metric (considering phylogenetic
distance and ASVs abundance) explained a larger fraction of the prokaryotic community variability (58%) than
Bray Curtis distance metric (45%). Weighted UniFrac analysis did not show a clear clustering of communities
according to water masses, and discrete samples of the three water masses deviated from the general pattern,
strongly differing from the rest (Fig. 3b). Cruise, water mass and station explained 14, 8.6 and 7.5% of variance
in community composition (PERMANOVA), respectively.
Temporal dynamics of meso‑ and bathypelagic ocean prokaryotes. The weighted UniFrac dis-
tance between the communities present in different dates and the initial community (Feb16) was computed for
each station and water mass in order to quantify the community structure variation along the studied period.
The results show different variation patterns across water masses and basins (Fig. 4). Communities that exhibited
larger distance throughout the study period (i.e., oWMDW in station B at the Mallorca channel, LIW commu-
nity in station C at the south Balearic sub-basin and the communities from the three water masses in station
E at the south Algerian sub-basin, Fig. 4) resulted from strikingly different community composition in Feb16
compared to other months (Fig. 5 and Supplementary Fig. S5). The community composition showed periods of
change, depicted by increasing distance to the initial community, followed by the return to the initial community
composition, represented by decreasing distances (Fig. 4). Notably, changes were observed at all water masses,
including the bottom waters (Fig. 4).
Community composition from station C oWMDW and bottom water was similar between Feb16 (winter)
and Apr16 (spring) and significantly diverged towards Jul16 (summer) (Fig. 4 and Supplementary Table S2),
subsequently returning to a composition similar to Feb16 in Oct16 (autumn) for the oWMDW community and in
Feb17 (winter) for the bottom community, and remained similar during Jun17 and Nov17 (Fig. 4c). Similarly, the
communities of station D exhibited a pronounced change in Oct16 (autumn) at the three water masses, followed
by the return to the initial community composition in Feb17 (winter) for LIW and oWMDW communities and
in Jun17 (summer) for the bottom community (Fig. 4d and Supplementary Table S2). The three water masses
in station E experienced a similar temporal patterns, with the more pronounced changes occurring in Apr16
(spring) and Jul16 (summer) as compared to Feb16 (winter), and communities stabilizing afterwards (Fig. 4).
In order to explore whether the observed changes in communities were due to the abundance variation of
ASVs always present in a specific community or due to the transport of ASVs from a different community and
subsequent replacement in the studied community, the ASVs were categorized as ‘core’ (i.e., present in ≥ 80%
of samples), ‘frequent’ (i.e., present in ≥ 50% and < 80% of samples) and ‘transient’ (i.e., present in < 50% of
samples). Core ASVs were assigned to few taxa, mainly Nitrosopumilaceae and SAR11 (Supplementary Fig. S6
and Table S3). One ASV was always abundant (contributing ≥ 1% to all samples), putatively assigned to Nitros-
opumilaceae. Seven additional core ASVs were classified as frequently abundant, i.e., contributing ≥ 1% in ≥ 50%
of samples. From these, five were assigned to Nitrosopumilaceae, one to SAR11 Clade II and one to order SAR324
Scientific Reports | (2021) 11:17859 | https://doi.org/10.1038/s41598-021-96992-3 4
Vol:.(1234567890)www.nature.com/scientificreports/
Station A
a
0.4
Distance
0.3
0.2
0.1
Apr16 Jul16 Oct16 Feb17 Jun17 Nov17
Station B
b
0.5
Distance 0.4
0.3
0.2
0.1
Apr16 Jul16 Oct16 Feb17 Jun17 Nov17
Station C
c
0.6
Distance
0.4
0.2
Apr16 Jul16 Oct16 Feb17 Jun17 Nov17
Station D
d
0.6
Distance
0.4
0.2
Apr16 Jul16 Oct16 Feb17 Jun17 Nov17
Station E
e
0.6
Distance
0.5
0.4
Apr16 Jul16 Oct16 Feb17 Jun17 Nov17
Depth LIW oWMDW Bottom
Figure 4. Temporal dynamics of the meso- and bathypelagic prokaryotic communities. Changes in community
composition versus time based on pairwise weighted UniFrac distances between the different communities
(from Apr16 to Nov17) and the initial community (first sampling, in Feb16) for stations (a) A, (b) B, (c) C, (d)
D and (e) E. Shapes and line types indicate water masses: LIW: Levantine intermediate water; oWMDW: old
western Mediterranean deep water. Significance (P value) of changes is shown in Supplementary Table S2.
(Supplementary Fig. S6 and Table S3). Among frequent ASVs, three ASVs were abundant in more than 15% of
samples: one assigned to Thioglobaceae (Gammaproteobacteria) and two to SAR406. Four transient ASVs were
abundant in more than 5% of samples, all assigned to Alteromonadales (Supplementary Fig. S6). Low abundant
or rare ASVs (contributing < 1% to the communities) contributed 34, 82 and 98.7% to the core, frequent and
transient ASVs, respectively.
The major changes observed in community structure (Fig. 4) mostly coincided with the increase of transient
ASVs contribution (Supplementary Fig. S6), e.g., at stations C, D and E in Jul16, Oct16 and Feb16, respectively
(Fig. 5 and Supplementary Figs. S5 and S5). The family Moraxellaceae (Pseudomonadales), specifically genus
Psychrobacter, steeply increased throughout the three water masses in Jul16 (summer) at station C (south Balearic
sub-basin), contributing up to 60.4%, 30.5% and 15% at the bottom, oWMDW and LIW communities, respec-
tively (Fig. 5a-c). Concurrently, diversity indexes of bottom water communities decreased pronouncedly in
Jul16 (Supplementary Fig. S7) and the contribution of HNA cells increased throughout the water column, more
pronouncedly at bottom waters (Supplementary Fig. S2). During the other cruises, this family was not detected
at the bottom and was considered rare for the overall water column (contributing ≤ 0.1% in abundance), only
it was detected contributing more than 0.1% and less than 1% (i.e., categorized as ‘low abundant’) to the com-
munity of LIW in Oct16 and of oWMDW in Apr16. In terms of absolute abundance, this family was present
at abundances of 0–4, 0–5 and 0–9 × 10² cells mL−1 in LIW, oWMDW and bottom communities during other
Scientific Reports | (2021) 11:17859 | https://doi.org/10.1038/s41598-021-96992-3 5
Vol.:(0123456789)www.nature.com/scientificreports/
Figure 5. Prokaryotic community composition at (a-c) Station C and (d-f) Station D between February
2016 and November 2017. Stacked bar plots represent the relative abundance of phylotypes at the family
level or maximum assigned level at (a, d) LIW: Levantine intermediate water, (b, e) oWMDW: old western
Mediterranean deep water and (c, f) bottom water. Families or higher taxonomic groups that contribute ≤ 0.5%
are combined in ‘Others’ group.
Scientific Reports | (2021) 11:17859 | https://doi.org/10.1038/s41598-021-96992-3 6
Vol:.(1234567890)www.nature.com/scientificreports/
cruises, respectively, and increased to 2.2, 2 and 3.3 × 10⁴ cells mL−1 in July16, respectively. The community change
in Jul16 coincided with an increase in nitrite concentration at the bottom waters and with an increase in bottom
turbidity values (Supplementary Figs. S8 and S9).
The pronounced change in Station D (north Algerian sub-basin) in Oct16 (autumn) at the three water
masses (Fig. 4 and Supplementary Table S2), was principally caused by a marked increase of Flavobacteriaceae
(16.6–46.9%) with respect to the other cruises (0–0.9%) (Fig. 5d-f). This family amounted to 20–85, 1.5–17 and
0–7.6 × 101 cells m
L−1 in LIW, oWMDW and bottom communities in other cruises, respectively, and reached up
to 2.8, 3.2 and 0.9 × 10⁴ cells mL−1 in Oct16, respectively. Besides, Sphingomonadaceae and some low abundant
Gammaproteobacteria families increased to 11% and 13% in bottom waters, respectively, with respect to 0–10%
and 2–3% in other cruises (Fig. 5f). The large increase in contribution of these ASVs resulted in decreased
diversity indexes at all depths (Supplementary Fig. S7).
Communities of station E (south Algerian sub-basin) in Feb16 (winter) were characterized by a substantial
contribution of Gammaproteobacteria families to the three water masses communities (33.2–77.7%). In particu-
lar, Alteromonadales contributed 28.4% at oWMDW communities, and pronouncedly decreased its contribution
in the following cruises to < 5% (Supplementary Fig. S5). A large Gammaproteobacteria families contribution
in station E was still observed in Apr16 (spring) at oWMDW (36.2%), as compared to the following cruises
(6.7–15.9%) (Supplementary Fig. S5).
Occasional changes in prokaryotic communities were also observed at specific depths, such as the LIW
community in Feb16 (winter) at station C that significantly differed from the other water layers and seasons
(Fig. 5a) and was related to an increase of transient ASVs (Supplementary Fig. S6). Flavobacteriaceae, SAR11
Clade I and SAR86 were significantly more abundant, contributing respectively 12%, 27% and 3% in relative
abundance, as compared to 0.6 ± 0.1% (mean ± S.E.M), 8 ± 0.8% and 1 ± 0.1% during other cruises, respectively.
Besides, Alphaproteobacteria families and groups contributing ≤ 0.5% (i.e., combined in ‘Others’ group) contrib-
uted significantly more to LIW community in Feb16 than in other months or depths (Fig. 5). In particular, the
low abundant phylotypes that increased considerably its contribution were Chloroplast families, Cyanobiaceae
(Synechococcales) and SAR116 (Puniceispirillales). In contrast, Nitrosopumilaceae, Nitrospinaceae and SAR324
phylotypes contributed significantly less to the LIW community in Feb16 (7, 0.1 and 0.2%, respectively) as com-
pared to the other cruises, ranging between 37–46, 0.4–3 and 4–8%, respectively (Fig. 5a).
Although the most pronounced community changes observed mainly corresponded to an increase in the
contribution of transient taxa, sometimes the increase in contribution of core taxa also caused community shifts.
The bottom community changes at station A in Oct16 (autumn) and station D in Feb17 (winter) (Supplementary
Fig. S6), located at the north of the Balearic and Algerian sub-basins, respectively, were related to changes in
core ASVs from the family Nitrosopumilaceae. Members of this family contributed up to 63% at the bottom com-
munity of station A in Oct16 as compared to 28–41% in other cruises (Fig. 5). However, no significant change in
its absolute abundance was observed in this station. This family also increased its contribution to bottom water
communities in station D to 54% in Feb17 as compared to 24–38% in other cruises (Supplementary Fig. S5).
Concurrently, an increase in absolute abundance of Nitrosopumilaceae occurred in this station, reaching 3.6 × 10⁴
cells mL−1 in Feb17 as compared to 1–2 × 10⁴ cells mL−1 in other cruises.
Prokaryotic community variation following a ventilation event. We aimed at exploring whether
the ventilation event in Apr16 inferred from the oxygen profiles in stations C, D and E caused significant vari-
ations in particular taxa differential abundance. In order to do that, we used the LEfSe pipeline43. This pipe-
line allows to associate taxonomic groups with particular environmental conditions, such as oxygen concen-
tration levels, at multiple taxonomic levels. The range of oxygen values reported in this study (between 164.2
and 201 μmol O2 kg−1) are characteristic of oxygenated ocean waters. Therefore, we used oxygen concentration
as a proxy of water mass variabilities (such as the bottom ventilation event or dissolved oxygen concentra-
tion decrease at LIW) and not as a driving parameter of prokaryotic community changes. Consequently, three
categories of oxygen concentration were defined to encompass the variabilities in water mass properties: ‘low
oxygen’, which includes the lowest oxygen concentration values (164–176 μmol O 2 kg−1) at LIW to characterize
variations in this water mass; ‘high oxygen’, which includes the highest oxygen concentration values at the bot-
tom (> 197 μmol O 2 kg−1), corresponding to the bottom ventilation observed in three of the stations, and ‘mid
oxygen’, corresponding to the values between ‘low’ and ‘high’ oxygen concentrations.
The differential abundance of taxonomic groups was related to phylotypes from diverse taxonomic levels
and phylogenies: 4 phylum, 11 classes, 20 orders and 26 families were significantly related to low or high oxy-
gen categories (Fig. 6 and Supplementary Fig. S10). Phylotypes associated to high oxygen concentration, i.e.,
increased their contribution to the community when the bottom ventilation event occurred, at phylum level
were Crenarchaeota, Nanoarchaeota, Acidobacteria and Thermus. Classes associated to high oxygen were one
unidentified Crenarchaeota class, Thermococci, Subgroups 5, 11 and 21 (Acidobacteria), Anaerolineae, TK10
(Chloroflexi) and Deinococci (Fig. 6). Other related taxa at order and family levels were the orders Aigarchaeales,
Methanofastidiosales, Deinococcales and 10 uncultured orders and families of Acidobacteria.
Low oxygen category used in the analysis was defined as the lower oxygen concentration values recorded at
LIW throughout the study. Low oxygen associated taxa were the uncultured family FIN625 of Marine Group II,
one class, order and family of SAR406 (Marinimicrobia), and the uncultured family Arctic97B of Verrucomi-
crobia (Fig. 6). No taxon was related to mid oxygen category.
Scientific Reports | (2021) 11:17859 | https://doi.org/10.1038/s41598-021-96992-3 7
Vol.:(0123456789)www.nature.com/scientificreports/
Figure 6. Differential prokaryotic taxa associated to changes in water mass properties. Cladogram showing the
phylogenetic distribution of prokaryotic taxa with significantly differential abundance at low or high oxygen
concentration computed for the different taxonomic levels. Rings indicate taxonomic levels from domain
(inner circle) to family (outer circle). Circle and shaded area colours indicate taxa associated to low (green) or
high (red) oxygen concentration for a linear discriminant analysis (LDA) score > 2. Taxa with no significant
differences between different oxygen categories are represented by yellow circles. Legend shows the taxonomic
level of taxa (p: phylum, c: class, o: order, f: family).
Discussion
Despite the interest in exploring the microbial communities of the deep ocean and their role in global biogeo-
chemical cycles, knowledge on their temporal variability remains scarce. Here, by performing a spatio-temporal
survey of meso- and bathypelagic prokaryotic communities, we show that dark ocean prokaryotic communities
were temporally dynamic, changing severely their structure. Our results revealed that low abundant (< 1% rela-
tive abundance) and rare (< 0.1% relative abundance) phylotypes can increase drastically after a disturbance,
suggesting a rapid response of active prokaryotes to changing environmental conditions.
Three groups dominate the aphotic water column in the Mediterranean: members of SAR11 clades I and
II and the archaeal family Nitrosopumilaceae (Fig. 2), in agreement with their widespread distribution in the
dark ocean44,45. These three families together comprise ~ 50% of the total dark Mediterranean Sea prokaryotic
community, thus, their metabolic activity may profoundly influence the deep ocean biogeochemical processes.
The dominant family in the meso- and bathypelagic Mediterranean Sea, the Nitrosopumilaceae (Fig. 2), are
ammonia-oxidizing chemoautotrophs46. Deep ocean environments are characterized by very low ammonium
concentrations, often below detection limit of current t echniques47. The archaeal ammonia oxidizers that inhabit
this environment are suggested to be adapted to different ammonium concentration and supply r ates48–50, and to
have the potential to use additional energy sources49,51. The significant contribution of SAR11 members in the
aphotic water masses (Fig. 2) fits with their heterotrophic oligotroph lifestyle harbouring a plethora of metabolic
capabilities52, such as preferential use of organic sulphur c ompounds53,54, which requires a lower energy cost
than producing reduced sulphur from sulphate55. SAR11 is the most abundant bacterial group in the ocean with
depth-specialized phylotypes and e cotypes52,56. Families from SAR324 and SAR406 (Marinimicrobia) clades
Scientific Reports | (2021) 11:17859 | https://doi.org/10.1038/s41598-021-96992-3 8
Vol:.(1234567890)www.nature.com/scientificreports/
also contribute a considerable fraction to the aphotic zone communities (Fig. 2), and are frequently found in
other deep ocean waters12,57. SAR324 members have been also identified as chemoautotrophs based on sulphur
oxidation metabolism56. SAR406 contribution to total prokaryotes increased with depth, in agreement with
previous studies in the Atlantic O cean58,59. This clade is associated with a particle attached l ifestyle60, reported to
contribute significantly to dark dissolved inorganic carbon fi xation61 and to participate in sulphur and nitrogen
biogeochemical cycles62.
The LIW exhibits the minimum oxygen concentration of the Mediterranean Sea water column
(164–185 μmol kg−1 in this study), and is described as the oldest water mass due to the slow spreading and
long renewal time63. The reduced oxygen conditions favour some chemolithoautotrophic processes such as
ammonia oxidation due to a larger availability of reduced chemical compounds compared to more oxygenated
waters64, supporting the larger relative abundance of Nitrosopumilaceae observed at the LIW (Fig. 2). The larger
contribution of Nitrosopumilaceae at this depth coincides with an increase in the contribution of the nitrite oxi-
dizer family Nitrospinaceae to the prokaryotic community (Fig. 2), supporting the suggested reciprocal feeding
between nitrite oxidizers and archaeal ammonia o xidizers65 and indicating an important role of the prokaryotic
community inhabiting this water mass in the nitrogen cycle of the Mediterranean Sea. The oWMDW is the
main bathypelagic Mediterranean water, occupying most of the water column. It is a rather hydrographical
stable water mass as compared to LIW and exhibits transitional environmental and community characteristics
between the mesopelagic and the new bottom water mass. The decrease in the contribution of particular LIW
phylotypes to the community (i.e., Nitrosopumilaceae, Nitrospinaceae, Thioglobaceae and the Marine Group II
family FIN625, among others) coincides with the relative increase of heterotrophic oligotrophs such as specific
uncultured Marine Group II phylotypes and SAR11 clade II (Fig. 2). The higher diversity and variability of near-
bottom communities as compared to the other two water masses studied here probably relates to differences in
physicochemical properties and to the influence of resuspension of sediments of different characteristics in the
different stations66,67. Organic and inorganic compounds leakage from the sediments may support a wider variety
of metabolic processes in the near-bottom waters compared to the water masses a bove68. However, it should also
be noted that the stations depth range is variable and that the stations C, D and E exhibit an additional water mass
(Western Mediterranean Transition) at the bottom. SAR202 larger contribution in deeper waters is supported
by their role in the final stages of organic matter oxidation69 and the reported major contribution of refractory
organic matter to the dissolved organic carbon pool below 1000 m d epth70.
Different major community composition changes occurred in all locations spanning the entire aphotic water
column (Figs. 4, 5 and Supplementary Fig. S5), with different members of the prokaryotic community leading
the changes. Most phylotypes that experienced substantial changes in their abundance and contribution over
the studied period were rare or low abundant in the other communities and associated to the transient ASVs
community (i.e., present in < 50% of samples). Experiments with natural communities have shown the persis-
tence of rare deep ocean prokaryotes during long periods of starvation and their feast response to a pulse of
carbon41,71. However, our findings also suggest that mostly a transport and replacement of the local community
by a different origin’s community rather than a change of the core community occurred, in agreement with
previous observations for surface prokaryotic c ommunities72. However, sequencing constraints regarding the
detection of rare sequences have to be considered, e.g., sequencing depth might hinder the detection of some
rare but frequently present ASVs.
Long-term variations and seasonal patterns have been well studied for surface microbial communities, linked
to seasonal changes of environmental f actors48,73,74. However, temporal variations of deep ocean microbial com-
munities are by far less studied. Seasonality and temporal dynamics of meso- and bathypelagic microbial com-
munities have been linked to surface ocean p rocesses13,14,16. In this study, we identified a local change in the
LIW community potentially linked to particle fluxes from the epipelagic. The change of the LIW community in
winter 2016 (Feb16) at station C was associated to some phototrophic phylotypes (Chloroplast, Cyanobiaceae),
Flavobacteriaceae and SAR116, reported to contribute more to photic zone communities75,76, indicating that
epipelagic prokaryotes reached the intermediate waters. A drastic composition shift was detected in station E in
winter 2016 (Feb16) as compared to other sampling dates, associated to a high contribution of Gammaproteo-
bacteria phylotypes, mainly assigned to Alteromonadales order (Supplementary Fig. S5). This station is located
at the eastern Alboran Sea, a region characterized by intense hydrological dynamics, including upwelling events
and frontal systems, that influence the temporal variability of particle fl uxes77, likely impacting on prokaryotic
communities. The massive contribution of the rare genus Psychrobacter (Moraxellaceae) in summer 2016 (Jul16)
at the bottom of station C and its decreasing contribution towards upper layers suggests a community change
caused by a local environmental disturbance. The increase of HNA cells at the deep-water masses together with
the increase of turbidity and nitrite concentration, particularly at the bottom, supports the environmental and
community disturbance at station C in July 2016 (Supplementary Figs. S7, S8 and S9). The most pronounced
community composition shift in station D was detected in autumn 2016 (Oct16) with several taxa responding
(e.g., Flavobacteriaceae, Sphingomonadaceae or Gammaproteobacteria phylotypes, Fig. 5), suggesting a distur-
bance of different origin and that local factors might influence the community changes.
The variability of surface biotic processes influencing the formation of organic particles could explain the
community changes observed in bathypelagic waters13. The major community changes detected, although
observed throughout the three water masses, are more pronounced in the oWMDW and bottom communities.
This finding would be in agreement with a direct connectivity between the surface and the bathypelagic through
fast sinking particles that elude mesopelagic communities, as has been previously suggested14. The fast sinking
of particles14, together with the physical and hydrochemical particularities of the L IW63, support the decou-
pling of the mesopelagic waters with the above and below waters. Other common processes in the area likely
influencing water masses connectivity and community changes are mesoscale eddies, formation of intermediate
nepheloid layers or downwelling from the shelf-slope38,78, since the stations were located at the end of insular or
Scientific Reports | (2021) 11:17859 | https://doi.org/10.1038/s41598-021-96992-3 9
Vol.:(0123456789)www.nature.com/scientificreports/
continental slopes. Bottom trapped waves38 are occasional phenomena occurring in the area of study that could
alter sediment resuspension or enhance material advection from surrounding areas, influencing near-bottom
or aphotic zone prokaryotic communities locally. Pasqual et al.67 reported differences in sedimentation regimes
and organic matter origin and composition between two locations in the same study area. Unfortunately, surface
biotic processes or specific physical forcing events were not assessed in this study.
In addition, this study shows a prokaryotic community shift related to a bottom ventilation event. To our
knowledge, this is the first evidence of near-bottom community changes at basin scale. Open-ocean convective
processes and dense shelf water cascading events during winter leading to water ventilation in near to bottom
waters are frequently reported in the north-western M editerranean36,79. The newly formed deep water flows
from the north-western Mediterranean towards the Atlantic following a cyclonic path. However, Margirier
et al.80 did not report a bottom-reaching water convection in the north-western Mediterranean in 2016 and we
lack data to comprehensively relate it with a specific basin event. Further support of the event is provided by the
reported association to sediments, benthic communities or particle attachment lifestyle of phylotypes related to
the bottom ventilation57,81, suggesting that the community change could be linked to resuspension of sediments.
Taken together, our results indicate that the meso- and bathypelagic ocean prokaryotic communities exhibit
long periods of stability (e.g., from February to November 2017 in most stations; Figs. 4, 5 and Supplementary
Fig. S5) but also experience drastic and occasional changes. However, it should be mentioned that given our
sampling resolution (every 2–3 months), the exact time when the shifts occurred and its extension cannot be
precisely described. Regardless of the microbial shifts detected, the community structure returned to its original
composition, strengthening the view of an active and dynamic deep ocean community. Although logistically
challenging, further studies should focus on the characterization of temporal variations of deep ocean prokaryotic
communities at smaller temporal scales (e.g., daily or weekly) to better understand the temporal succession of
community changes and to address the ecologically relevant question of resistance, resilience or sensitivity of
these communities. Our results also suggest that the blooming of otherwise rare or absent phylotypes, such as
Moraxellaceae, is originated by transient phylotypes. However, this interpretation has to be taken with care due to
the limitations of sequencing (e.g., sequencing depth), that might prevent the detection of some rare phylotypes
from the core community, frequently labelled as microbial seed bank82,83. The microbial seed bank provides
biodiversity and metabolic flexibility to the community, allowing a relatively rapid response to environmental
changes and contributing to the community resistance or r esilience41,84,85. Further research on the rare and low
abundant phylotypes (e.g., by increasing sequencing depth) and on their metabolic potential and activities will
help to better understand their role under environmental disturbances and in the biogeochemical cycles.
Methods
Sample collection and environmental parameters. Sampling was carried out seasonally from Febru-
ary 2016 to November 2017 during seven cruises as part of the RADMED project86 in order to cover environ-
mental changes associated to the seasonality and depending on the availability of the ship: RD-0216 (February
2016, winter), RD-0416 (April 2016, spring), RD-0716 (July 2016, summer), RD-1016 (October 2016, autumn),
RD-0217 (February 2017, winter), RD-0617 (June 2017, summer), RD-1117 (November 2017, autumn). For
clarity, the campaigns are referred to as Feb16, Apr16, Jul16, Oct16, Feb17, Jun17 and Nov17, respectively. Sam-
pling dates for each station are indicated in Supplementary Table S1. Five stations corresponding to different
hydrographic regions of the western Mediterranean basin were sampled: A, north Balearic sub-basin (41° 0′ N,
2° 37.6′ E); B, Mallorca channel (39° 28.6′ N, 1° 43.9′ E); C, south Balearic sub-basin (40° 9.9′ N, 4° 36.9′ E); D,
north Algerian sub-basin (39° 0′ N, 3° 10.2′ E); and E, west Algerian sub-basin (37° 12.3′ N, 0° 45.4′ W) (Fig. 1a).
Temperature and salinity depth profiles were recorded with a SBE911 Conductivity-Temperature-Depth (CTD)
sensor equipped with oxygen (SBE43) and turbidity (SeaPoint) sensors. Calibration procedures were applied
according to standard p rotocols86.Salinity measurements were calibrated using Portasal Guildline 8410A. Oxy-
gen concentrations obtained with the SBE43 sensor were calibrated for each cruise based on the comparison to
Winkler titration measurements87. Turbidity values were normalized for each cruise by subtracting the lowest
FTU (Formazin Turbidity Unit) value determined during the cruise.
Prokaryotic community analyses were conducted on water samples collected from the meso- and bathype-
lagic water masses identified: the Levantine intermediate water (LIW), old western Mediterranean deep water
(oWMDW, collected at 1000 m) and bottom (collected at 5–10 m above the seafloor). The core depth of the LIW
was identified based on its signature in a T–S diagram (Fig. 1b) during the CTD downcast. Additional samples
for inorganic nutrients and prokaryotic abundance were taken at 700 and 1500 m. A total of 93 samples were
collected for community composition analysis and 168 samples for inorganic nutrients and prokaryotic abun-
dance analysis (Supplementary Fig. S1).
Water samples for dissolved inorganic nutrients were collected in 12 mL vials and kept frozen at -20ºC until
further processing. Nitrate ( NO3−), nitrite ( NO2−), phosphate (PO43) and silicate ( SiO42) concentrations were
determined using a QuAAtro Gas Segmented Continuous Flow Analyser (SEAL Analytical) following colori-
metric methods87–89.
Prokaryotic abundance. Seawater samples (1.5 mL) were fixed 10 min with glutaraldehyde (0.1% final
concentration), frozen in liquid nitrogen and stored at -80ºC until analysis at the home laboratory. Prior to anal-
ysis, samples were thawed and stained with SYBR Green I (Sigma-Aldrich, 1 × final concentration) for 10 min
in the dark. Prokaryotic cells were counted on an ACCURI C6 flow cytometer (BD Biosciences) based on their
signature in a cytogram of side-scatter versus green fluorescence. High nucleic acid (HNA) and low nucleic
acid (LNA) populations were distinguished by gating based on their relative green fluorescence signal. Fluores-
Scientific Reports | (2021) 11:17859 | https://doi.org/10.1038/s41598-021-96992-3 10
Vol:.(1234567890)www.nature.com/scientificreports/
cent calibration beads (Fluospheres polystyrene 1.0 µm, Molecular probes, Eugene, OR) were added as internal
standard.
Prokaryotic community composition. Four litres of seawater from each depth were filtered onto 0.2 μm
polycarbonate filters (47 mm diameter, Whatman, Nucleopore), flash-frozen in liquid nitrogen and stored
at − 80 °C. Briefly, filters were first cut into small pieces with sterile scissors and incubated for 45 min with
lysozyme at 37 °C and 1 h with proteinase K at 55 °C for enzymatic cell lysis. Zirconium beads were added for
mechanic lysis followed by 30 min incubation at 70 °C. DNA was extracted consecutively with phenol (pH
8), phenol:chloroform:isoamyl alcohol (25:24:1) and chloroform. Subsequently, DNA was precipitated with
0.02 volumes of 5 M NaCl and 2 volumes of cold ethanol at −20 °C and recovered by centrifugation (25 min,
21,000 × g). DNA pellet was washed with ice cold 70% ethanol, resuspended in sterile DNAse-RNAse free water
and stored at −80 °C until further analysis.
16S rRNA gene amplification was performed using the primers 515F-Y (5′-GTGY CAG
CMGCCG CGG TAA)
and 926R (5′-CCGYCAATTYMTTTRAGTTT) targeting the hypervariable regions V4 and V5 of both Archaea
and Bacteria90. PCR reaction mixture contained 1 µL of extracted DNA, forward and reverse primers (1 µM final
concentration) and 1 × Kapa HiFi HotStart ReadyMix (Kapa Biosystems, Wilmington, MA). Cycling conditions
were applied as described by Parada et al.90. PCR products were purified using the Qiaquick PCR purification
kit (Qiagen, Hilden), following the manufacturer’s protocol. PCR-purified amplicons were checked on a 2%
agarose gel and sequenced using Illumina MiSeq 2 × 250 bp with V2 chemistry, resulting in 2,860,134 total reads.
Sequence data was analysed using DADA2 pipeline91 implemented in QIIME2 (http://qiime2.org)92. Paired-
end sequence reads were first demultiplexed and quality filtered, applying the following specific parameters:
maximum number of expected errors maxEE = 2, removing all sequences with ambiguities (maxN = 0), truncating
the length (truncLen) of forward and reverse reads to 245 bp and 230 bp, respectively, and trimming the primers
length (trimLeft). Chimeras were removed using the ‘denoise-paired’ script implemented in QIIME2 with default
settings. After quality check, sequences were clustered in amplicon sequence variants (ASVs)93. ASVs alignment
was performed using M AFFT94 and used to infer unrooted and rooted phylogenetic trees with F asttree95. ASVs
taxonomy was assigned using the SILVA database (release 132). Phylotypes contributing ≤ 0.1% in abundance
to the community were considered ‘rare’42, and phylotypes with relative abundance < 1% were considered ‘low
abundant’. The absolute abundance of phylogenetic groups was calculated multiplying the total prokaryotic
abundance, measured by flow cytometry, by the percentage of contribution of each group to the community.
Diversity metrics and statistics. Shannon diversity, Pielou’s evenness and phylogenetic diversity were
calculated with QIIME2 using the ASVs table rarefied to 3007 ASVs. ASVs beta diversity was analysed using
Bray Curtis and weighted UniFrac distance matrices. Principal Coordinates Analysis (PCoA) was used to rep-
resent the variance among communities according to the distance matrices previously mentioned. Statistically
significant environmental variables were assessed by analysis of variance (ANOVA) and permutational multi-
variate analysis of variance (PERMANOVA) using the ‘aov’ and ‘adonis’ function of the ‘vegan’ package of R.
A significance level of P < 0.05 based on 999 permutations was used. The ‘ampvis2’ package of R was used to
determine the presence and frequency of ASVs96 for the whole dataset (93 samples) in the region studied. ASVs
consistently reported in ≥ 80% of samples were considered ‘core’ ASVs, ASVs present in 50–79% of samples were
considered ‘frequent’ and ASVs present in < 50% of samples were considered ‘transient’97. The weighted UniFrac
distance was used to assess the change in community composition throughout the study period and to calculate
the distance between community composition of adjacent sampling dates. Then, one-sample t-tests were used
to statistically determine the significance of a community change as compared to the mean community value
for each water mass and station. Oxygen concentration was used as a proxy of water mass variability to relate
changes in water masses properties with prokaryotic community changes. Temporal variations in the local oxy-
gen minimum layer (i.e., at LIW) and bottom ventilation events are indicated by oxygen fluctuations98. Linear
discriminant analysis (LDA) combined with effect size measurements (LEfSe) was used to associate particular
taxonomic groups with fluctuations in these water masses using changes in oxygen concentration at multiple
taxonomic levels (http://huttenhower.sph.harvard.edu/galaxy)43. Statistical analysis was computed from phylum
to family level to simplify computation and results. A significance level of P < 0.01 was used in Kruskal–Wallis
test. Prokaryotic communities were classified in three categories according to oxygen concentration: ‘Low_O2’
for samples with O2 < 176 μmol kg−1, corresponding to the LIW samples with lowest oxygen concentrations;
‘Mid_O2’ corresponding to samples with oxygen concentration ranging between 176 ≥ O2 ≤ 197 μmol kg−1; and
‘High_O2’ when O2 > 197 μmol kg−1, concentrations determined when a bottom ventilation event was observed.
Data availability
Sequences reported in this paper have been deposited as 16S rRNA raw sequences in NCBI Sequence Read
Archive (SRA) under the accession number PRJNA575848.
Received: 5 May 2021; Accepted: 17 August 2021
References
1. Azam, F. & Malfatti, F. Microbial structuring of marine ecosystems. Nat. Rev. Microbiol. 5, 782–791 (2007).
2. Fuhrman, J. A. Microbial community structure and its functional implications. Nature 459, 193–199 (2009).
3. Aristegui, J., Gasol, J. M., Duarte, C. M. & Herndl, G. J. Microbial oceanography of the dark ocean’s pelagic realm. Limnol. Oceanogr.
54, 1501–1529 (2009).
4. Del Giorgio, P. A. & Duarte, C. M. Respiration in the open ocean. Nature 420, 379–384 (2002).
Scientific Reports | (2021) 11:17859 | https://doi.org/10.1038/s41598-021-96992-3 11
Vol.:(0123456789)www.nature.com/scientificreports/
5. Arístegui, J., Duarte, C. M., Gasol, J. M. & Alonso-Sáez, L. Active mesopelagic prokaryotes support high respiration in the subtropi-
cal northeast Atlantic Ocean. Geophys. Res. Lett. 32, 1–4 (2005).
6. Reinthaler, T., van Aken, H. M. & Herndl, G. J. Major contribution of autotrophy to microbial carbon cycling in the deep North
Atlantic’s interior. Deep. Res. Part II Top. Stud. Oceanogr. 57, 1572–1580 (2010).
7. Baltar, F., Arístegui, J., Gasol, J. M. & Herndl, G. J. Prokaryotic carbon utilization in the dark ocean: Growth efficiency, leucine-to-
carbon conversion factors, and their relation. Aquat. Microb. Ecol. 60, 227–232 (2010).
8. Baltar, F. et al. High dissolved extracellular enzymatic activity in the deep central Atlantic ocean. Aquat. Microb. Ecol. 58, 287–302
(2010).
9. Delong, E. F. et al. Community genomics among stratified microbial assemblages in the ocean’s interior. Science (80-. ) 311, 496–504
(2006).
10. Brown, M. V. et al. Microbial community structure in the North Pacific ocean. ISME J. 3, 1374–1386 (2009).
11. De Corte, D., Sintes, E., Yokokawa, T., Reinthaler, T. & Herndl, G. J. Links between viruses and prokaryotes throughout the water
column along a North Atlantic latitudinal transect. ISME J. 6, 1566–1577 (2012).
12. Salazar, G. et al. Global diversity and biogeography of deep-sea pelagic prokaryotes. ISME J. 10, 596–608 (2015).
13. Mestre, M. et al. Sinking particles promote vertical connectivity in the ocean microbiome. Proc. Natl. Acad. Sci. 115, E6799–E6807
(2018).
14. Ruiz-González, C. et al. Major imprint of surface plankton on deep ocean prokaryotic structure and activity. Mol. Ecol. 29,
1820–1838 (2020).
15. Poff, K. E., Leu, A. O., Eppley, J. M., Karl, D. M. & DeLong, E. F. Microbial dynamics of elevated carbon flux in the open ocean’s
abyss. Proc. Natl. Acad. Sci. U. S. A. 118, 1–11 (2021).
16. Cram, J. A. et al. Cross-depth analysis of marine bacterial networks suggests downward propagation of temporal changes. ISME
J. 9, 2573–2586 (2015).
17. Parada, A. E. & Fuhrman, J. A. Marine archaeal dynamics and interactions with the microbial community over 5 years from surface
to seafloor. ISME J. 11, 2510–2525 (2017).
18. Richert, I. et al. Summer comes to the Southern Ocean: How phytoplankton shape bacterioplankton communities far into the
deep dark sea. Ecosphere 10, e02641 (2019).
19. Cram, J. A. et al. Seasonal and interannual variability of the marine bacterioplankton community throughout the water column
over ten years. ISME J. 9, 563–580 (2015).
20. Severin, T. et al. Impact of an intense water column mixing (0–1500 m) on prokaryotic diversity and activities during an open-
ocean convection event in the NW Mediterranean Sea. Environ. Microbiol. 18, 4378–4390 (2016).
21. Luna, G. M. et al. Dense water plumes modulate richness and productivity of deep sea microbes. Environ. Microbiol. 18, 4537–4548
(2016).
22. Wilkins, D., Van Sebille, E., Rintoul, S. R., Lauro, F. M. & Cavicchioli, R. Advection shapes Southern Ocean microbial assemblages
independent of distance and environment effects. Nat. Commun. 4, 2457 (2013).
23. Azzaro, M. et al. Prokaryotic dynamics and heterotrophic metabolism in a deep convection site of Eastern Mediterranean Sea (the
Southern Adriatic Pit). Cont. Shelf Res. 44, 106–118 (2012).
24. Winter, C., Kerros, M. E. & Weinbauer, M. G. Seasonal changes of bacterial and archaeal communities in the dark ocean: Evidence
from the Mediterranean Sea. Limnol. Oceanogr. 54, 160–170 (2009).
25. D’Ortenzio, F. & Ribera d’Alcalà, M. On the trophic regimes of the Mediterranean Sea: A satellite analysis. Biogeosciences 6, 1–10
(2009).
26. Tanhua, T. et al. The Mediterranean Sea system: A review and an introduction to the special issue. Ocean Sci. 9, 789–803 (2013).
27. Luna, G. M. et al. The dark portion of the Mediterranean Sea is a bioreactor of organic matter cycling. Global Biogeochem. Cycles
26, GB2017 (2012).
28. Santinelli, C., Nannicini, L. & Seritti, A. DOC dynamics in the meso and bathypelagic layers of the Mediterranean Sea. Deep. Res.
Part II(57), 1446–1459 (2010).
29. Crespo, B. G., Wallhead, P. J., Logares, R. & Pedrós-Alió, C. Probing the rare biosphere of the north-west mediterranean sea: An
experiment with high sequencing effort. PLoS ONE 11, 1–16 (2016).
30. Pommier, T. et al. Spatial patterns of bacterial richness and evenness in the NW Mediterranean Sea explored by pyrosequencing
of the 16S rRNA. Aquat. Microb. Ecol. 61, 221–233 (2010).
31. Boutrif, M., Garel, M., Cottrell, M. T. & Tamburini, C. Assimilation of marine extracellular polymeric substances by deep-sea
prokaryotes in the NW Mediterranean Sea. Environ. Microbiol. Rep. 3, 705–709 (2011).
32. Millot, C. Circulation in the Western Mediterranean Sea. J. Mar. Syst. 20, 423–442 (1999).
33. López-Jurado, J. L., González-Pola, C. & Vélez-Velchí, P. Observation of an abrupt disruption of the long-term warming trend at
the Balearic Sea, western Mediterranean Sea, in summer 2005. Geophys. Res. Lett. 32, L24606 (2005).
34. Piñeiro, S., González-Pola, C., Fernández-Díaz, J. M. & Balbín, R. Thermohaline evolution of the Western Mediterranean deep
waters since 2005: Diffusive stages and inter-annual renewal injections. J. Geophys. Res. Ocean. 124, 1–20 (2019).
35. Guillén, J. et al. Coastal oceanographic signatures of heat waves and extreme events of dense water formation during the period
2002–2012 (Barcelona, NW Mediterranean). Sci. Mar. 82(4), 189–206 (2018).
36. Schroeder, K. et al. An extensive Western Mediterranean deep water renewal between 2004 and 2006. Geophys. Res. Lett. 35, L18605
(2008).
37. Palanques, A. & Puig, P. Particle fluxes induced by benthic storms during the 2012 dense shelf water cascading and open sea
convection period in the northwestern Mediterranean basin. Mar. Geol. 406, 119–131 (2018).
38. Pasqual, C., Amores, A., Flexas, M. M., Monserrat, S. & Calafat, A. Environmental factors controlling particulate mass fluxes on
the Mallorca continental slope (Western Mediterranean Sea). J. Mar. Syst. 138, 63–69 (2014).
39. Catalá, T. S. et al. Turnover time of fluorescent dissolved organic matter in the dark global ocean. Nat. Commun. 6, 5986 (2015).
40. Catalá, T. et al. Water mass age and aging driving chromophoric dissolved organic matter in the dark global ocean. Glob. Biogeo-
chem. Cycles 29, 917–934 (2015).
41. Sebastián, M. et al. High growth potential of long-term starved deep ocean opportunistic heterotrophic bacteria. Front. Microbiol.
10, 1–12 (2019).
42. Pedrós-Alió, C. The rare bacterial biosphere. Ann. Rev. Mar. Sci. 4, 15.1-15.18 (2012).
43. Segata, N. et al. Metagenomic biomarker discovery and explanation. Genome Biol. 12, R60 (2011).
44. Morris, R. M. et al. SAR11 clade dominates ocean surface bacterioplankton communities. Nature 420, 806–810 (2002).
45. Muck, S. et al. Niche differentiation of aerobic and anaerobic ammonia oxidizers in a high latitude deep oxygen minimum zone.
Front. Microbiol. 10, 2141 (2019).
46. Könneke, M. et al. Isolation of an autotrophic ammonia-oxidizing marine archaeon. Nature 437, 543–546 (2005).
47. Sintes, E., Bergauer, K., De Corte, D., Yokokawa, T. & Herndl, G. J. Archaeal amoA gene diversity points to distinct biogeography
of ammonia-oxidizing Crenarchaeota in the ocean. Environ. Microbiol. 15, 1647–1658 (2013).
48. Sintes, E., Witte, H., Stodderegger, K., Steiner, P. & Herndl, G. J. Temporal dynamics in the free-living bacterial community com-
position in the coastal North Sea. FEMS Microbiol. Ecol. 83, 413–424 (2013).
49. Smith, J. M., Damashek, J., Chavez, F. P. & Francis, C. A. Factors influencing nitrification rates and the abundance and transcrip-
tional activity of ammonia-oxidizing microorganisms in the dark northeast Pacific Ocean. Limnol. Oceanogr. 61, 596–609 (2016).
Scientific Reports | (2021) 11:17859 | https://doi.org/10.1038/s41598-021-96992-3 12
Vol:.(1234567890)You can also read