Hydrology and Cranes (Grus grus) Attraction Partnership in the Management of the Hula Valley-Lake Kinneret Landscape
←
→
Page content transcription
If your browser does not render page correctly, please read the page content below
hydrology
Review
Hydrology and Cranes (Grus grus) Attraction Partnership in the
Management of the Hula Valley—Lake Kinneret Landscape
Moshe Gophen

                                          MIGAL Scientific Research Institute, P.O. Box 831, Kiryat Shmone 11016, Israel; Gophen@Migal.org.il

                                          Abstract: The Hula Valley in northern Israel was partly covered by swamps and a shallow lake.
                                          The entire valley was drained and converted for agricultural cultivation. Later, an additional soil
                                          reclamation operation was implemented, including eco-tourism. From the early 1990s, winter
                                          migratory cranes have attracted visitors, thus supporting the hydrological management of the entire
                                          valley that protects the downstream Lake Kinneret. It was documented that these birds have a minor
                                          impact on phosphorus pollution, but severely damaged agricultural crops are protected by mild
                                          deportation and daily, short, periodical corn seed feeding.

                                          Keywords: cranes; deportation; crop protection; Hula Valley; phosphorus; pollution

                                          1. Introduction
                                          1.1. The Kinneret Drainage Basin

                                         The region that is geographically defined as the Hula Valley (altitude between
Citation: Gophen, M. Hydrology
                                          100 and 60 mbsl) has a surface area of about 200 km2 and provides about 7% of the
and Cranes (Grus grus) Attraction
                                          watershed basin of Lake Kinneret [1] (Figure 1). The historic Hula wetland area within
Partnership in the Management of the      the valley generally refers to about 60 km2 of the entire valley [1–3]. The regional climate
Hula Valley—Lake Kinneret                 conditions are Mediterranean [1], with an annual winter rainfall of 350–850 mm, followed
Landscape. Hydrology 2021, 8, 114.        by a hot and dry summer. The temperature minima and maxima are, respectively, 18 and
https://doi.org/10.3390/                  35 ◦ C in summer and 3 and 20 ◦ C in winter [3,4]. The Hula Valley and the surrounding
hydrology8030114                          slopes are one of the most ancient human habitats [5], dating back to 73,000 BC.
                                                The Kinneret drainage basin (2730 km2 , altitude range 2284–2260 mbsl) is located
Academic Editor: Tommaso Caloiero         mostly to the north of the lake. Its maximum length from north to south is 110 km,
                                          and the width is 50 km [6]. During the past 80 years, the Lake Kinneret drainage basin
Received: 12 July 2021                    ecosystem has undergone significant anthropogenic and natural modifications. Prior to
Accepted: 29 July 2021                    the 1950s, the Hula Valley was mostly (6500 ha) covered with old Lake Hula (1300 ha) and
Published: 5 August 2021                  swampy wetlands. This area was not cultivated, malaria was common, and water loss
                                          by evapo-transpiration (ET) was high. The Jordan River, which crosses the Hula Valley,
Publisher’s Note: MDPI stays neutral      contributes about 63% of the downstream Lake Kinneret’s water budget and 70% of the
with regard to jurisdictional claims in   total nutrient inputs, of which over 50% originate from the Hula Valley region, including
published maps and institutional affil-
                                          the valley and the slopes on both sides (east and west) of it. The old Lake Hula and
iations.
                                          its swamps were drained and converted for agricultural development. After the Hula
                                          drainage, the dominant N flux from the peat organic soil was modified from ammonium to
                                          nitrate. As a result of raw sewage removal and fishpond restrictions, the organic nitrogen
                                          flux into Lake Kinneret significantly reduced. As a result of inappropriate irrigation and
Copyright: © 2021 by the author.          agricultural methods, the peat soil quality deteriorated due to consolidation, destruction,
Licensee MDPI, Basel, Switzerland.        and surface subsidence. This deterioration was accompanied by heavy dust storms [6]
This article is an open access article    blocking drainage canals, due to peat organic soil dryness, resulting in deep cracks. This
distributed under the terms and
                                          was followed by oxygen penetration, which accompanied exogenic decomposition of
conditions of the Creative Commons
                                          organic matter and heating, creating underground fires. The underground cracks, together
Attribution (CC BY) license (https://
                                          with cultivated plant mater, immediately were populated by severe outbreaks of rodent
creativecommons.org/licenses/by/
                                          populations. These deterioration processes caused severe damage to agricultural crops.
4.0/).

Hydrology 2021, 8, 114. https://doi.org/10.3390/hydrology8030114                                          https://www.mdpi.com/journal/hydrology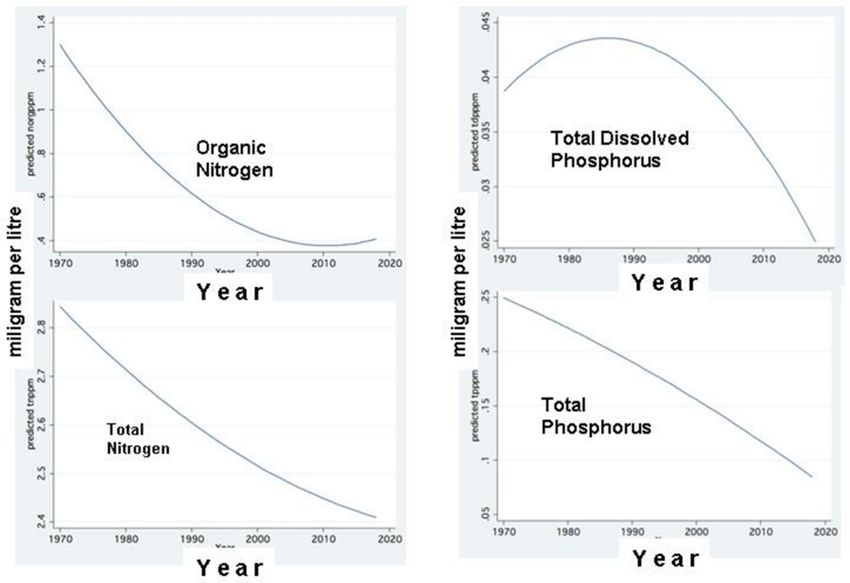
Hydrology 2021, 8, 114                                                                                                          2 of 20

      Figure 1. Geographical maps of the Lake Kinneret watershed with inflow rives (left) and the Hula Valley (right). Bore holes
      drills are indicated (black spots).

                                  1.2. The Hula Reclamation Project
                                       The Hula Reclamation Project (HRP) (Figure 1) was consequently implemented. The
                                  implementation of the HRP resulted in modifications to land use, which affected the regime
                                  of nutrient supply to Lake Kinneret. The HRP included the creation of a new shallow
                                  lake named Agmon (surface area 820 ha, mean depth 0.2 m, volume 0.164 × 10⁶ m3 ) [7];
                                  the renewal of 90 km drainage and water supply canals, placing a vertical plastic barrier
                                  of depth 4.5 m such that it spanned a distance of 2.8 km along the valley from east to
                                  west; maintenance of a higher underground water table; and functional conversion of
                                  500 ha of the Hula Valley land, including Lake Agmon in the center, from agricultural to
                                  eco-tourism usage. The objectives of the HRP were (1) nutrient removal from the Lake
                                  Kinneret external loads through the Lake Agmon hydrological system; (2) production of
                                  an ecological component for eco-tourism, i.e., Lake Agmon; (3) usage of Lake Agmon as
                                  a principle component of hydrological management and agricultural irrigation for the
                                  entire valley; (4) improvement of irrigation water supply through portable computerized
                                  spray water lines; (5) maintenance of a high underground water table to enhance peat soil
                                  moisture and prevent peat soil quality deterioration; and (6) re-establishment of highly
                                  diverse natural flora and fauna, with emphasis on aquatic birds.
Hydrology 2021, 8, 114                                                                                          3 of 20

                         1.3. Cranes in the Hula Valley
                               In the early 1990s, peanut cultivation became attractive due to its high beneficial
                         value and productive success as a result of the suitability of the peat organic soil. The
                         winter migrators, cranes (Grus grus), on their long-term southern traditional migration to
                         Africa, discovered some leftover peanuts after harvest [8,9]. Thus, the flocks massively
                         landed in October–November in the Hula Valley. The population of cranes in the Hula
                         Valley therefore increased. Unfortunately, when the rains came, the wet peanuts started
                         to ferment and became less attractive to the cranes, resulting in their looking for other
                         food sources, thereby causing damage to agricultural crops. At this point, a conflict arose:
                         on the one hand, cranes attracted bird watchers (eco-tourism), but on the other hand,
                         crop damage became common, where significant water supply enhanced agricultural
                         development, which was damaged by the birds [10,11]. The rationale behind the Hula
                         Reclamation Project was the protection of the Lake Kinneret water quality, combined with
                         the production of beneficial (income source) crops for the citizens of northern Israel. The
                         advantages of the Hula Reclamation Project included additional water allocation and
                         improvement of the canal and irrigation systems (portable computerized spray lines) to
                         improve crops, as well as development of eco-tourism where the soil was unsuitable for
                         agriculture [7,12]. The increase in the crane population resulted in damaging these benefits.
                               This paper is a long-term (1994–2018) summary aimed at evaluating the combined
                         effects of the Hula Reclamation Project achievements on Lakes Agmon and Kinneret and
                         attempts at forecasting future beneficial management design for all partners involved:
                         farmers, water managers, and nature protectors. The paper is focused on a controversial
                         issue of the potential impact of cranes on the pollution of Lake Kinneret. The Hula Valley
                         comprised only about 7% of the total watershed of Lake Kinnerer (2730 km2 ). Moreover,
                         the size of the cultivated part, together with the eco-touristic block (including Lake Agmon)
                         (the peat soil land) is just 3% of the total drainage basin area. The significant role of the
                         peat soil in nitrogen contribution was documented. Nevertheless, the involvement of the
                         peat soil phosphorus within the Lake Kinneret input load dynamics was just partly studied.
                         Peat soil dust wind release and deposit onto Lake Kinneret were documented [6]. The
                         phosphorus capacity within the Hula Valley runoffs as well as their inflows into River
                         Jordan were also documented. Nevertheless, partitioning of the phosphorus stock sources,
                         other fertilizers, crane droppings, and geochemical or erosion processes has not yet been
                         studied. This paper is an attempt at estimating the role of cranes within the entire load.
                         Because the peat soil dust contribution, not like other sources, was estimated, the paper
                         is focused on the relative potential crane impact within the comprehensive phosphorus
                         delivery from the Hula Valley into River Jordan. The research about phosphorus dynamics
                         within the Lake Kinneret drainage basin initiates a significant impact of climate change on
                         it. Therefore, re-evaluation of the climate condition was carried out aimed at the search for
                         the domination of environmental parameters: edaphic, hydrological, climate, agriculture,
                         and crane migration. The particular issue that this paper intends to emphasize is that the
                         reason for an increase in the TP concentration in the Lake Agmon waters is submerged
                         macrophytes and not crane droppings.

                         2. Materials and Methods
                              Temporal changes in the Lake Kinneret drainage basin of precipitation and River
                         Jordan discharge (climate change) conditions are given in Figure 1. The experimental
                         methods and sampling program have been documented and published earlier [13–19]. A
                         brief, summarized compilation of previously collected information is re-evaluated here.
                         Data sources and statistical methods are given below.

                         2.1. Data Sources
                              The long-term datasets (1970–2018) of Lake Kinneret and its watershed, including data
                         on the water and precipitation, nutrient dynamics, and river discharge, were statistically
                         evaluated. Data were obtained from the following sources: the Kinneret Limnological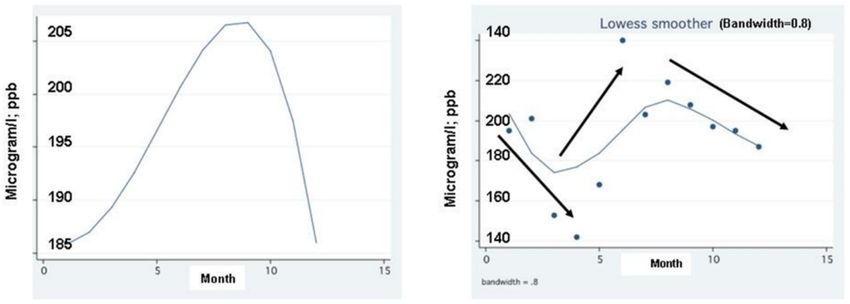
Hydrology 2021, 8, 114                                                                                            4 of 20

                         Laboratory [13–19], annual reports of the Israeli National Meteorological Service, the
                         Israeli National Hydrological Service (National Water Authority), MIGAL, the Hula Project
                         Service, the Mekorot Water Supply Company Ltd., the Monitoring Unit Jordan District,
                         and the Agriculture Ministry Northern Branch—Upper Galilee Office.

                         2.2. Statistical Method
                              Statistical analyses by fractional polynomial regression, linear regression with 95% con-
                         fidence intervals, simple averages, and line scatter plots were carried out using STATA 9.1.
                         These are the abbreviations used (Table 1):
                             TPin—total phosphorus concentration (ppb, ppm) or mass load (ton) in Lake Agmon
                             inflow sources
                             TPout—total phosphorus concentration (ppb, ppm) or mass load (ton) in Lake Agmon
                             outflow
                             TPbalance—mass balance (ton) = outflow minus inflow.

                         3. Results
                               Information about climate change [4,20] in the Hula–Lake Kinneret region is given in
                         Figure 1. There was a significant decline in precipitation and a consequent reduction in the
                         River Jordan mean discharge by 454,106 m3 /year and 13,5106 m3 /year during the periods of
                         1970–2001 and 2001–2018, respectively (Figure 2). The decline in discharge was followed by a
                         significant decrease in nutrient input into Lake Kinneret and a lowered water level (WL) in the
                         Hula Valley. Results presented in Figure 2 indicate that not as documented in many systems,
                         the relationship between discharge and the total phosphorus (TP) concentration is positive:
                         the higher the discharge, the higher the TP concentration [21–23]. Climate conditions in the
                         Hula–Lake Kinneret region is defined as tropical, with a short, cold and wet winter and a long,
                         warm, and dry summer. Consequently, the River Jordan discharge is high in winter and low
                         in summer (Figure 2). The temporal decline in the TP concentration in the River Jordan waters
                         with respect to a decline in discharge is shown in Figure 3 by two statistical methods: linear
                         regression (95% CI) and LOWESS smoothing (bandwidth = 0.8). Similar temporal trends are
                         shown in Figure 4 for changes in the concentrations of organic nitrogen and total nitrogen.
                         Figure 5 gives the inverse relationship between TP annual mean concentrations in the Lake
                         Agmon outflow and in the River Jordan waters. It is presented by two statistical methods:
                         linear regression with 95% confidence intervals and fractional polynomial regression. A
                         prominent indication of TP concentration decline in Lake Agmon waters is correlated with an
                         increase in TP concentration in the River Jordan waters. Nevertheless, data given in Figure 6
                         indicate that an increase in annual means of the TP concentration in Lake Agmon waters
                         accompanied the increase in crane populations during the period of 1993–2005 and 2007–2018,
                         whilst from 2005 through 2011, lower levels of TP concentration were observed in Lake
                         Agmon waters. A particular objective of this paper is to define the reason for an increase in
                         the TP concentration in Lake Agmon waters. An attempt at defining the contribution of crane
                         droppings as a major impact on the increase in the TP content in the Lake Agmon effluent
                         is insufficient, and investigation of the seasonal fluctuation of the TP concentration in Lake
                         Agmon waters denied the role of cranes as major contributors of phosphorus. Results given
                         in Figures 7 and 8 clearly indicate that an increase in the TP concentration in Lake Agmon
                         waters occurs in summer when cranes are not there. The seasonal pattern indicates the lowest
                         concentrations of TP in winter months when cranes are there and increased concentrations
                         in summer after migration of the cranes back to Europe for breeding (Figure 7). Figure 8
                         indicates that few cranes were observed in the Hula Valley [8] prior to 1993 when nutrient
                         concentrations in the Jordan waters were high. The number of wintering cranes in the
                         Hula Valley from 1993 and onward increased significantly (Figure 8; E. Naim and I. Rubin,
                         NJF, personal communication), but nutrient concentrations in the Jordan waters declined
                         (Figure 9). The uninterrupted continuity in the decline in nitrogen and phosphorus was
                         prominent. Moreover, results presented in Figure 7 indicate the lowest TP concentrations in
                         Lake Agmon waters during winter months, when cranes are present, whilst in the summer–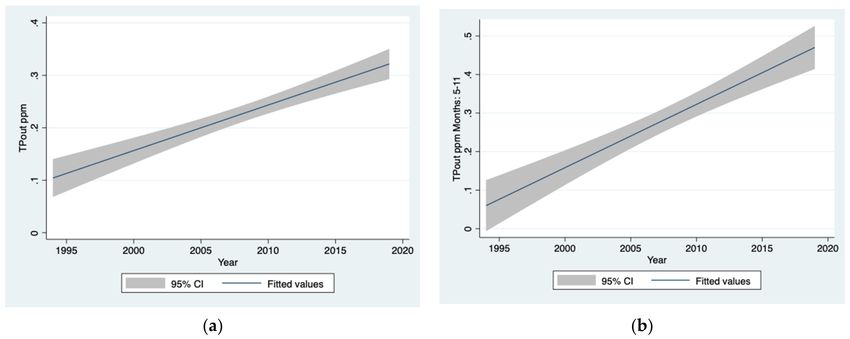
Hydrology 2021, 8, 114                                                                                                            5 of 20

                                  fall season, after the cranes migrate back to Europe and no cranes are observed in the Hula
                                  Valley, the TP concentration is elevated to its maximal level. Taking into account that during
                                  the period of 1970–1994, only single cranes were observed and, afterward, massive migration
                                  was recorded [8], the continuous trend of decline in nutrient concentrations (Figure 10) in the
                                  River Jordan was not interrupted or modified as a contribution that can be attributed to the
                                  impact of the crane population.

      Figure 2. Climate change in the Lake Kinneret drainage basin: decline in the River Jordan annual discharge (106 m3 /year)
      during 1960–2020 (a), decline in annual precipitation (mm/year) (b), and lowering of the GWT depth (annual total Hula
      Valley average during 2003–2020) (c).

      Figure 3. Right: linear regression (95% CI) between the River Jordan discharge (106 m3 /year) and the concentration (ppm)
      of total phosphorus (TP) in Jordan waters. Left: line scatter plot of the monthly discharge of River Jordan, averaged for two
      periods: 1969–2001 and 2001–2018.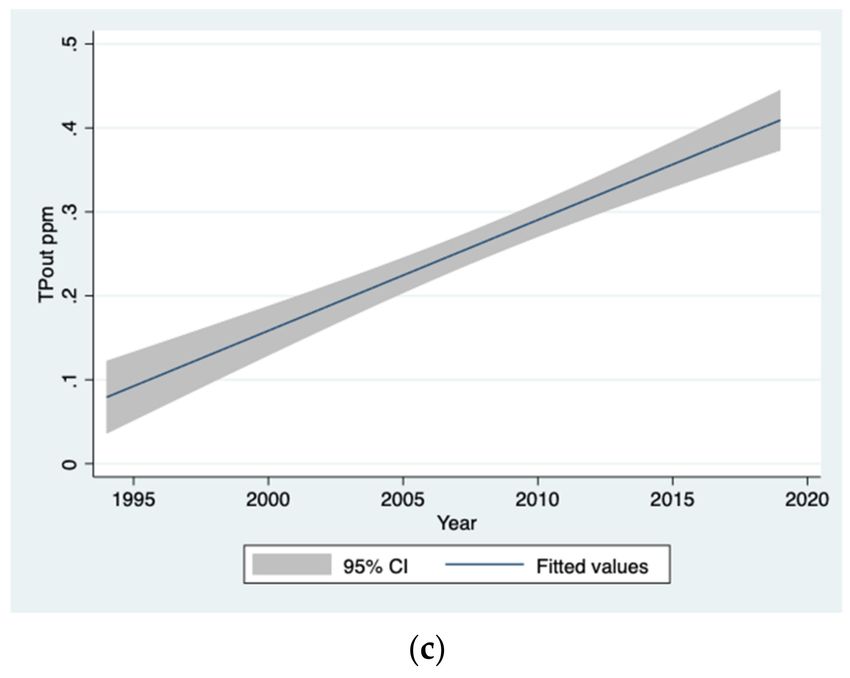
Hydrology 2021, 8, 114 6 of 20
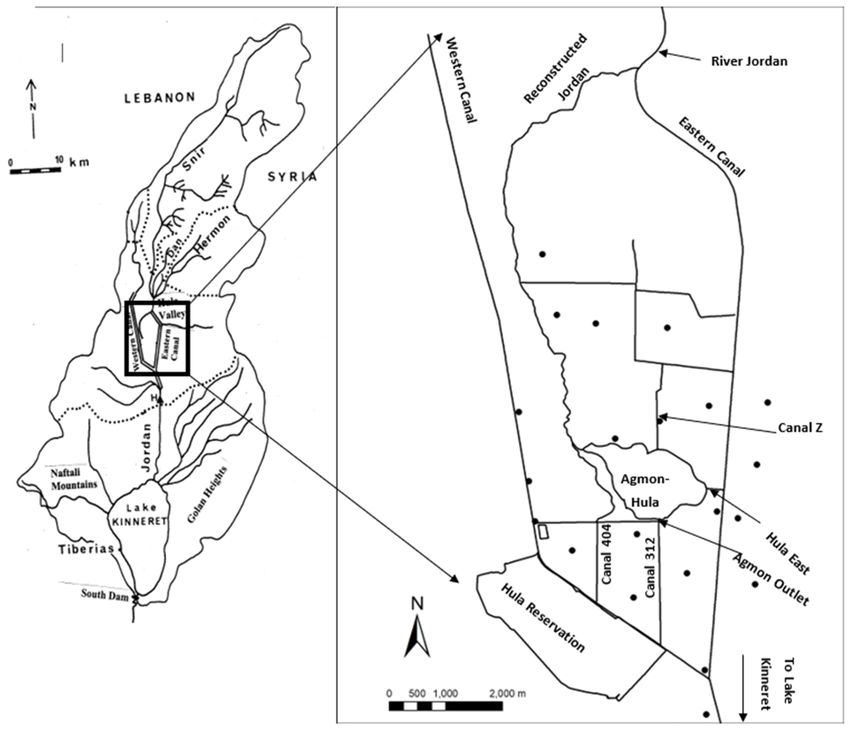
Figure 4. Temporal changes (1970–2018) in annual averages of total phosphorus (TP) concentrations (ppm) in Jordan waters:
Left: linear regression (95% CI). Right: LOWESS smoother plot (bandwidth = 0.8).
Figure 5. Temporal (1970–2018) changes in annual concentrations (ppm) of total nitrogen (left) and organic nitrogen (right)
in Jordan waters, presented as linear regression (95% CI) between the concentrations and years.
Figure 6. Relationship between annual (1993–2018) mean concentrations in the Lake Agmon outflow (ppb) and River Jordan
waters (ppm). Left: linear regression (95% CI). Right: fractional polynomial regression.Hydrology 2021, 8, 114 7 of 20
Figure 7. LOWESS smoother plot (bandwidth = 0.8) plot of the temporal (1994–2018) changes in
annual averages of TP concentrations (ppb) in the Lake Agmon outflow.
Figure 8. Monthly mean (1994–2018) fluctuations of TP concentrations (microgram/L; ppb) in the Lake Agmon outflow:
Left: fractional polynomial regression. Right: LOWESS smoother plot (bandwidth = 0.8). Trends are arrowed.
Figure 9. Temporal (1994–2018) changes in maximal counts of the wintering crane population in the Hula Valley. Left:
LOWESS smoother plot (bandwidth = 0.8). Right: line scatter.Hydrology 2021, 8, 114 8 of 20
Figure 10. Temporal (1970–2018) changes in annual means of nutrient concentrations (mg/L; ppm)
in River Jordan waters: Upper left: organic nitrogen. Upper right: total dissolved phosphorus.
Lower left: total nitrogen. Lower right: total phosphorus. 1970–1993—no-crane period; 1994–2018—
crane period.
The phosphorus mass balance in Lake Agmon as calculated for several years is
presented next.
Input sources: Peat soil drainage area; major Canal Z = 101; Hula East and Recon-
structed Jordan River route.
Effluent: Outflow from Lake Agmon into evacuation canals and direct pumping
for irrigation.
Data on inflow and outflow of TN and TP are not available.
Due to technical difficulties, no sampling was done during 2016.
Two samples were collected on 18.9.2000 and 20.11.2000 when no cranes were present in
the valley. The nutrient (TN, TP) concentrations were only affected by external inputs, and
internal processes of geochemistry and vegetation decomposition were as follows (Table 2).
Table 1. Annual TP and TN mass load balances (tons/year) in Lake Agmon during 2008–2028: TN and TP inputs (inflow),
output (outflow), and balance (output minus input) [14].
Year TN Inflow TN Outflow TN Balance TP Inflow TP Outflow TP Balance
2000 3 0.6
2004 248 19 −230 1.03 0.430 −0.6
2008 46 34 −12 0.7 2.3 1.6
2009 78 47 −31 1.1 2.5 1.4
2010 62 64 2 0.9 2.7 1.8
2011 112 55 −57 0.9 2 1.2
2012 169 155 −14 0.8 2.3 1.5
2013 150 113 −37 0.7 1.8 1.1
2014 15 18 3 0.3 1.2 1
2015 75 43 −33 1.2 2.2 1.1
2016 29 24 −5 1.2 2.6 1.3
2017 121 30 −91 1.1 1.8 0.7
2018 86 58 −28 8.9 2.1 1.3Hydrology 2021, 8, 114 9 of 20
Table 2. TN and TP concentrations (ppm) in the Lake Agmon effluent measured on 18 September
2000 and 20 November 2000.
Date TN (ppm) TP (ppm)
18 September 2000 1.62 0.062
20 November 2000 2.16 0.471
Results in Table 2 indicate that from September, when submerged vegetation die-off
(offset) initiates until November, when aquatic plants (sub- and above water) are intensively
degraded, the TN and TP decomposed products enhance nutrient concentrations in the
Lake Agmon outflow.
During September and November, cranes are absent in the Hula Valley.
Results given in Table 3 indicate a negative TPout mass balance during 2004. The
average TP output for crane months (12, 1, 2, 3, 4) was 20 kg/month, whilst that for
no-crane months (5–11) was 50 kg/month. During no-crane months, the Lake Agmon TP
effluent load was higher than during crane months by 150%.
Table 3. Lake Agmon monthly TP mass (tons/month) balance (output minus input), TPin (tons/month),
and TPout (tons/month) during 2004; yes = crane were present; no = cranes were absent.
TP Input TP Output TP Balance Cranes
1 0.24 0.06 −0.18 Yes
2 0.07 0.01 −0.06 Yes
3 0.02 0.001 −0.02 Yes
4 0.03 0.02 −0.01 Yes
5 0.09 0.06 −0.03 No
6 0.12 0.01 −0.11 No
7 0.08 0.02 0.06 No
8 0.09 0.05 −0.04 No
9 0.11 0.07 0.04 No
10 0.08 0.07 0.01 No
11 0.1 0.07 −0.03 No
12 0.01 0.01 0 No
Total Annual 1.03 0.43 −0.06 Yes
Results in Table 4 indicate higher TPout concentrations (given in ppb in Table 4) in
no-crane months (5–11) than those during crane months (12, 1, 2, 3, 4). The monthly average
for crane months was 228 ppb, while that for no-crane months was higher—292 ppb. An
average periodical (1994–2018) increase in the TPout concentration by 28% in no-crane
months than in crane months was recorded.
Table 4. Monthly averages (1994–2018) of TPout concentration (ppb) in the outflow from Lake Agmon.
Month TP (ppb) Cranes
1 222 Yes
2 258 Yes
3 232 Yes
4 183 Yes
5 222 No
6 222 No
7 204 No
8 317 No
9 473 No
10 279 No
11 325 No
12 245 Yes
Annual AverageHydrology 2021, 8, 114 10 of 20
The TP balance in Lake Agmon was evaluated as follows: The TP concentration and
water discharge were routinely (weekly) monitored in the three major Lake Agmon water
inflow sources: Canal Z, Hula East, and Reconstructed Jordan (see maps in Figures 1 and 2).
The loads were computed as multiplication of the TP concentration by the water discharge.
An example of year 2003’s TP balance is given in Tables 5–7.
Table 5. Monthly averages of TP concentrations (ppb) in the water sources of Lake Agmon: Canal Z,
Hula East, and Reconstructed Jordan (see Figures 1 and 2) during 2003.
Month Canal Z Hula East Reconstructed Jordan Lake Agmon Effluent (TPout)
1 56 0 6 54
2 28 12 11 44
3 0 6 0 70
4 26 9 119 22
5 33 0.3 89 113
6 57 13 40 31
7 24 5 48 28
8 91 8 71 98
9 15 3 12 7
10 15 4 31 19
11 35 17 8 63
12 3 19 10 24.2
Table 6. Monthly discharges (103 m3 ) of water inflows through the sources into Lake Agmon: Canal
Z, Hula East, and Reconstructed Jordan during 2003.
Month Canal Z Hula East Reconstructed Jordan Outflow
1 500 0 70 600
2 400 100 150 300
3 0 30 0 500
4 300 60 420 400
5 400 2 410 700
6 500 120 380 300
7 600 60 410 300
8 800 60 750 500
9 700 100 680 200
10 400 100 600 300
11 400 80 110 500
12 40 80 200 1000
Total Annual 5040 792 4180 5600
Table 7. Monthly inputs of TP loads (kg/month) into Lake Agmon through major sources of water inflows into Lake
Agmon: Canal Z, Hula East, and Reconstructed Jordan during 2003.
Month Canal Z Hula East Reconstructed Jordan Total Input Total Output TP Balance
1 28 0 0.4 28.4 32.4 4
2 11.2 1.2 1.7 13.1 13.2 −0.9
3 0 0.2 0 0.2 35 34.8
4 7.8 0.5 50 59.3 8.8 −49.5
5 13.2 0 36.5 49.7 79.1 29.4
6 28.5 1.6 15.2 45.3 9.3 −36
7 14.4 0.3 19.7 34.4 8.4 −26
8 72.8 0.5 53.3 126.6 49 −77.6
9 10.5 0.3 8.2 19 1.4 −17.6
10 6 0.4 18.6 25 5.7 −19.3
11 14 1.4 0.9 16.3 31.5 15.2
12 1.2 1.5 2 4.7 24.2 19.5
Total Annual 207.6 7.9 206.5 422 298 −124Hydrology 2021, 8, 114 11 of 20
Results given in Table 7 indicate a much higher (TP balance of 132.5 kg) internal TP
input during the no-crane months (5–11), whilst during the crane months (12, 1, 2, 3, 4),
the total balance was positively 50.4 kg. Consequently, during summer months after crane
migration, there was an internal source of TP, most likely aquatic vegetation. The role of
decomposed plant matter in the Lake Agmon outflows during spring–summer–fall months
has been published in earlier studies [24–27]. A distinct elevation in drifted/flushed
phosphorus within the Hula Valley was documented (Figure 6, Table 8) [13–18].
Table 8. Monthly means of TPout concentrations (ppb), as calculated for two periods, 1994–2005 and
2006–2020, when the migrated crane population maximum size varied between 17,000–27,000 and
33,000–56,100, respectively.
Month 1994–2005 2006–2020
1 165 251
2 189 305
3 155 272
4 117 215
5 122 284
6 133 269
7 156 233
8 206 408
9 177 575
10 185 332
11 240 381
12 192 287
Information given in Table 8 indicates a higher concentration of TPout during
2006–2020 than earlier (1994–2005). Moreover, Table 4 indicates an average TPout concen-
tration of 228 ppb during the crane months (12, 1, 2, 3, 4) and 349 ppb during summer–fall
months of August through November. That is a percentage elevation of 53% in a period
when cranes are absent. It is therefore suggested that processes initiating these changes are
not related to the presence of cranes in the valley. Statistical evaluation of the correlation
between the population size of migrating cranes and the TP balance in Lake Agmon was
found to be insignificant. In contrast, a simple regression (r2 and p-value) test between TPin,
TPout, and TPbalance indicated significant relationships: (1) TPout vs. TPin, (2) TPbalance
vs. TPin, and (3) TPbalance vs. TPout; values of r2 were above 0.6507 and p < 0.0001. It
is therefore likely that phosphorus dynamic processes in Lake Agmon, including sources
and effluents, have terrestrial traits and are mostly affected by erosion, geochemistry, and
vegetation but are not significantly affected by cranes.
A full-year cycle (14 months) of monthly sampling of groundwaters followed by
chemical analysis of nutrient contents was carried out. Results of underground water
phosphorus level (GWT) in the subterranean waters indicated a hydrological gradient
directed north to south (northern higher level). Nevertheless, the phosphorus content
indicates a reversible gradient: higher level of southern subterranean phosphorus—in
other words, accumulation of phosphorus in the southern underground capacity. Despite
cumulative migration of phosphorus from north to south, its stock is limited, probably
resulted by deeper continuity of the migration. This assumption has not yet been approved,
but the contribution of phosphorus through underground routes into the Jordan River and
further into Lake Kinneret was not indicated. The flux of phosphorus from the subterranean
sources into Lake Agmon through advective inflows was documented as negligible [28,29].
4. Discussion
There is a difference between nitrogen and phosphorus dynamics in Lake Agmon.
The lake is a nitrogen sink. Nevertheless, previous studies have confirmed partial removal
of nitrogen from the Lake Agmon waters through denitrification and sedimentation. The
continuity of a positive TPbalance indicates supplemental TP resources other than peat soil
drainage, possibly crane droppings and re-suspension and/or submerged macrophytes.Hydrology 2021, 8, 114 12 of 20
Local daily migration of cranes in the Hula Valley indicates terrestrial allocation during the
daytime and in the Lake Agmon shallows at night while excretion of their droppings into
the water. A quantitative monitoring of the seasonality of above and sub-surface aquatic
vegetation was carried out during 1997–2004 [27]. The submerged vegetation onset started
in April and peaked through July–August, followed by offset with dieback disappearance
in December. During winter time (December through April), the aquatic plant biomass
is negligible. Results indicate an average dry weight biomass of 456.4 tons (min.-max.
−140–817) contained 0.9 tons of TP (max.–min. −0.3–1.2) and 7.4 tons of TN (max.-min.
−2.7–10.5). The supplemental TP and TN loads to Lake Agmon through aquatic vegetation
as related to soil drainage input were 10% and 8%, respectively.
Lake Agmon was constructed during 1993 and filled with water in the summer of
1994. The ecological stability during the first years was partly flexible, and the Lake Agmon
ecosystem was not yet stable. Therefore, nutrient mass balances were changed widely.
For example, during the early 2000s, when the crane population was below 20,000, the
TN and TP mass balance differed from the later period of 2008–2018. The TP balance
prior to the crane migration was positive, and four years later, it was negative; therefore a
significant contribution of TP by cranes is not suggested. Long-term records (1995–2018)
indicate average (high range of SD) TN and TP concentrations in the Lake Agmon outflow
of 4.67 and 0.17 ppm, respectively. Although the total mass removal of nutrients through
the Lake Agmon system is not high, how much is affected by crane migration was not
primarily predicted. Nevertheless, the seasonality of vegetation growth and consequent
nutrient loads was also unpredictible. The ecological significance of a newly constructed
system, such as the Hula Reclamation Project, accompanied by crane migration initiated
the present study.
The winter migratory cranes, which are fed supplementally by tons of corn seeds, are
an essential source of phosphorus for the Lake Kinneret ecosystem. The four-month winter
visit of cranes might therefore lead to lake pollution by phosphorus. The dynamics of
water-mediated phosphorus input into Lake Kinneret is driven by the hydrological runoff
and subterranean linkage between the Hula Valley and Lake Kinneret. Until the early 1990s,
cranes were almost absent in the Hula Valley, excluding a few individuals. Since then, the
valley has been populated annually from November through March by increasing numbers
of cranes, up to 50,000 in the winter of 2019–2020 [8]. Leftover harvested peanuts attract
the cranes in October–November. Peanut crops have been found to yield significantly high
revenues and are suitable to be grown on the heavy-organic peat soil in the Hula Valley. In
early to mid-December, the cranes start looking for other sources of food, thereby causing
damage to winter crops. An efficient method aimed at prevention of agricultural damage
has been improvised: Money is allocated as rental for a 40 ha field block in the valley,
which serves as a feeding station for the cranes; here, corn seeds are purchased and fed to
the cranes twice a day. Feeding starts in late December and continues until early March,
when the cranes fly back to Europe for breeding [8].
This has proved to be efficient, but it has a costly disadvantage, since there is the
tendency of phosphorus leakage into Lake Kinneret. This paper aims at suggesting ways
of removal of the pollution parameter but also leaves room for further consideration of the
unresolved issue of the financial cover source for the corn seed purchase.
A brief search of the literature about phosphorus metabolism of birds indicates a
wide range of its excretion [30,31] Although cranes are not typical water fowls due to their
day–night stay discrimination between terrestrial and aquatic habitats, they are not the only
Lake Agmon inhabitants. Among other inhabitants are ducks, herons, pelicans, cormorants,
mallards, and seagulls [32]. Big flocks of migratory birds, such as cormorants, pelicans,
seagulls, and mallards, are distributed among northern water bodies (fishponds, reservoirs,
Lake Kinneret, temporal ponds, regional rivers), whilst the cranes create huge flocks located
in the Hula Valley and presently (>2004) assembled in Lake Agmon during nighttime.
Pelicans create big flocks but stay for a short period (2–3 weeks) partly on terrestrial land
and partly in Lake Agmon. Cormorants are scattered in singles and locally migrate toHydrology 2021, 8, 114 13 of 20
Lake Kinneret. Conclusively, cranes are the major group to be defined as potential TP
contributors to Lake Agmon input loads.
The following data about phosphorus excretion by fowls were considered: Mal-
lard platyrinchos and Larus ridibundum, 1–0.1 gP/bird/day [30]; cultured poultry broilers,
0.2–0.3 gP/bird/day [31]; and different migratory water fowls, 5.24 gP/bird/day (cranes
and pelicans) and 3.5 gP/bird/day (cormorants) [33–37]. For the maximal effective value,
the P excretion of cranes at 5.24 gP/bird/day was considered. Considering the pres-
ence of 50 × 103 cranes for 150 days (November through March) with 100% influx of
their droppings into Lake Agmon waters, the annual P load from the birds would be
(5.24 g) × (50,000 birds) × (150 days), which is equivalent to 39.3 tons. This is doubtless a
significant extra load, which is almost 45% of the total measured annual input into Lake
Kinneret from the River Jordan discharge. Nevertheless, this additional P load is not
confirmed to be an extra loading to Lake Kinneret and likely also not a source of P to Lake
Agmon. However, it was confirmed that this excreted P accumulates in the peat soil within
the Hula Valley [15,38–42]. It is likely that P accumulation in the uppermost peat soil layer
is probably not unlimited, and P migrates into the shallow subterranean groundwater
table and most probably even much deeper. The role of migratory water fowls as nutrient
vectors in managed wetlands was documented by Post et al. [43]. However, cranes as P
vectors of corn seed P mediated into Lake Agmon and further on into Lake Kinneret were
not confirmed.
The conflict between cranes and agriculture is well known and highly documented [8].
Cranes are protected by international laws; shooting them is illegal, and thus deportation
should be done without shooting. A collaborative solution between farmers, nature
authorities, water managers, landowners, and regional municipalities was contracted and
implemented. Cranes that land prior to mid-December are deported without shooting,
with the aim to reduce the number of potential feeders, thereby preventing damage and
reducing the cost of corn seeds. Corn seed feeding starts in mid-December. Cranes are not
nocturnal, and their diurnal behavior includes feeding during the day; then they spend
the full-darkness period (about 12–14 h) in Lake Agmon. The daily schedule of the cranes
comprises 10–12 terrestrial day hours and a 12–14-h night period in Lake Agmon. Their
noisy and remarkable local migration is aimed at reducing their vulnerability to predators.
It is likely that most of the crane excretion takes place in the Lake Agmon waters at night.
Studies carried out on migratory birds documented an increase in daily foraging activity
with daytime (light time) prolongation, and the opposite is reasonable because daytime
activity levels depend on light conditions (sun elevation) [44]. Moreover, Haynes et al. [45]
documented intensive night activity of foraging and copulation by many species of water
(wetland) birds, such as gulls (Laridae). Kostecke et al. [46] documented nocturnal time
activity budgets consisted of foraging (62%) and resting (20%). A greater percentage of time
was devoted to foraging and aggression, and less was spent resting at night [46]. Therefore,
searching for the TP migration rate through Lake Agmon effluents is justified. Moreover,
since 1994, the routine sampling of the Lake Agmon outflow has been carried out on a
weekly basis in the mornings. The relevance of these samples to the evaluation of the
impact of crane excretion on Lake Kinneret inputs might be criticized because the nocturnal
stay of the birds is terminated before routine sampling. To avoid a biased conclusion, a
calculation of the residence time (RT = inflow/volume) in Lake Agmon was done: the
mean (2008–2018) value of the Lake Agmon daily inflow was 25.2 × 10³ m3 , the Lake
Agmon surface area is 82 ha, and the mean depth is 20 cm. Consequently, the Lake Agmon
total volume is 164 × 103 m3 and RT = 6.5 days, confirming the minority of daily flushing
out of excreted crane droppings with accumulative potential. A major part of TP content
in the crane droppings is due to the daily ingestion of food (corn seeds) collected outside
Lake Agmon and results from resuspension carried out by bird stepping. Mass balances
for TP in Lake Agmon indicate a negative regime, i.e., outflow is higher than inflow loads.
These results, together with the results presented in Figure 7, support the conclusion about
other sources besides crane droppings of the summer increase in TP in the Lake AgmonHydrology 2021, 8, 114 14 of 20
effluent. Moreover, during the period of 1970–1993, before the crane era (CE), the mean TP
concentration was 0.224 ppm, whilst later (1994–2018), during the CE, it was 0.126 ppm.
Conclusively, an increase in the TP concentration in Lake Agmon due to the activities of
cranes is not confirmed. The Hula Valley annual contribution of TP and TN through the
hydrological system of Lake Agmon, after the implementation of the Hula Reclamation
Project (1996–2008), confirms the following: 1.2 and 26 tons of TP and TN, respectively,
were removed from the Lake Kinneret external loads, which comprised 1.7% and 2.4% of
the total loads of TP and TN, respectively [3,7,12,25,26]. Long- and short-term geochemical
research on phosphorus and nitrogen dynamics within the peat soil in the Hula Valley, as
well as in drainage canals in the vicinity of Lake Agmon [15,38–42] and in the subterranean
waters, indicated high TP and TN levels. Nevertheless, the composition and dynamics
of these pollutants in the River Jordan waters was not positively related to the soil and
underground flows from the geochemical findings.
This achievement initiated benefits for both landowners and farmers by generating
income from about half a million bird watchers (charged visit), whilst the Hula Valley
effluents were not significantly deteriorated. Moreover, the cranes were allotted a night
habitat underneath the terrestrial eucalyptus trees, where they became vulnerable to
predators (fox, wolf, mongoose, jackal). Therefore, the bird flocks changed from the night
habitat to the protected refuge site in the newly created shallow Lake Agmon–Hula.
The crane management project (deportation and feeding) was designed to be part of
a comprehensive objective aimed at enhancing ecosystem sustainability. The solution is
conclusively summarized as follows: to reduce the agricultural damage on a fixed land
site where cranes have gathered during the day to feed on corn seeds, leaving this area for
the shallow lake at night, where they would be protected from predators. Bird watchers
visits and the Hula Project lead to nutrient removal from Lake Kinneret loads. This crane
management project represents an efficient “marriage” by establishing a balance between
bird and limnological interests for the prevention of eutrophication in Lake Kinneret.
The Hula Reclamation Project was aimed at ensuring sustainability of modified eco-
systems by formulation of a conflict between agricultural development, Lake Kinneret
water quality protection, and nature conservation. The tension between farmers, water
managers, and nature preservers was reduced, and there was collaboration instead. The
outcome of the HRP was renewal of the ecosystem, which had become a tourist attraction,
enriching the biological diversity with approximately 300 species of birds, including 40,000–
50,000 wintering cranes annually, 40 species of water plants, and 12 species of fish. The
new ecosystem of the shallow Lake Agmon–Hula with surrounded safari habitats ecosys-
tem became a tourist attraction and maintenance investment. The potential contributors
of water-mediated phosphorus include the following: Lake Kinneret headwaters, Lake
Agmon–Hula, crane droppings, aquatic vegetation, and the major peat-soil-drained water
pathways in the Hula Valley.
A tentative semi-conclusion at this point indicates two major points: Phosphorus
removal from the Lake Kinneret loads through the Lake Agmon system is minor, and
phosphorus enrichment occurs in the late summer–fall season. A working hypothetical
assumption suggests sources of phosphorus other than crane droppings and resuspension.
These other sources are peat soil geochemical flushing introduced into the Lake Agmon
water column through water inflow. The second source is phosphorus uptake from the sed-
iments, incorporated into plant tissues and later, as a result of plant decomposition, into the
Lake Agmon water column. Earlier studies [47–49] and long-term records have indicated
peat-soil-bounded phosphorus release mostly during summer dryness, which enhances
linkage breaks between organic phosphorus and peat soil particles [50,51]. The dynamics
of submerged high plants and algal organisms was documented. The most abundant
organisms were, among others, submerged Potamogeton spp., Najas spp., Myriophillum sp.,
filamentous mats and scum of Cyanobacteria and Chlorophyta plants that stand out of the
water, Typha sp., Phragmites spp., and others [52]. The seasonal dynamics of their growth
rate, dry weight, and nutrient (N, P, K) content were documented. These measurementsHydrology 2021, 8, 114 15 of 20
clearly indicated onset of vegetation growth during late March–early April and offset
during September–November. It was confirmed that the plant degradation during fall con-
tributes a significant amount of phosphorus as dissolved and particulate forms [52]. Earlier
studies [18] have confirmed a significant elevation in the phosphorus concentration in the
Lake Agmon waters during summer months. Moreover, the Hula Reclamation Project
annual reports (1994–2018) documented a continuous increase in phosphorus concentration
during summer months in the major canal that drains organic peat soil. The TP elevation
is due to vegetation degradation and not crane activity. Therefore, to achieve a beneficial
ecological project of crane attraction, the potential damage due to phosphorus pollution is
eliminated and prevention of agricultural damage remains a major target. The long-term
record confirmed that such an objective is feasible but expensive. Goodwill and friendly
relations between all partners involved—landowners, farmers, hydrologists, and nature
and Lake Kinneret protectors—make this achievement feasible.
The combination of beneficial crane attraction as bird watcher visits and hydrological
management was confirmed. The merit of cranes as a complementary achievement of
eco-tourism policy to the hydrological management of the Hula Valley was also confirmed.
Data shown in Figure 11 indicate similar enhancement of the TP concentration in the Lake
Agmon effluent during 1994–2018 (Figure 13, left panel) without a particular impact of
the crane migration. Moreover, a close relationship is shown (Figure 12) of the temporal
pattern of changes between TP input and TP balance in Lake Agmon. No significant crane
impact on these parameters is therefore suggested. The TP sources for the input loads are
terrestrial, with probably a minor impact by cranes. Monthly means of the TP concentration
in the Lake Agmon effluent (Figure 13, Figure 14 right panel) justify the conclusion of
significant TP concentration enhancement resulting from summer decomposition of aquatic
macrophytes when cranes are absent. Moreover, during 1994–2018, the TP concentration
during winter months (12, 1, 2, 3, 4) was quite stable (240 ppb), declined in May–June,
followed by an abrupt and sharp increase (250–360 ppb) in summer–fall (July–November).
Conclusively, the domination of TP concentration in the Lake Agmon waters is due to input
(winter) and macrophyte decomposition (summer–fall) (Figures 14 and 15). Although the
possibility of phosphorus pollution of the Lake Agmon waters by cranes was rejected,
their agricultural damage is significant, and the solution to this damage is costly. Crane
migration starts in late October, and they stay until late February to early March, for a
total of 150 days. As of mid-December, cranes feed on the leftover peanut harvest and
deportation is implemented by the landowners. From mid-December until backward
natural migration, they are fed corn seeds in designated blocks, accompanied by partial
low-level deportation from other blocks. During the 2003/4–2005/6 season, 250 tons of
corn seeds were fed to the cranes in their designated blocks, whilst in 2020/21, 361 tons
were fed to them. The crane population in the Hula Valley increased from below 20,000
before the 2000s to 50,000 in 2021 (Figure 8). Moreover, the number of visitors and bird
watchers increased dramatically fromHydrology 2021, 8, 114 16 of 20
Figure 11. Linear regression (95% CI) between monthly means of TPout concentration (ppm) during crane months (12,
1, 2, 3, 4) (a) and no-crane months (5–11) (b) in 1994–2018. Linear regression (95% CI) between annual means of TPout
concentrations (ppm) in (1994–2018) (c).
Figure 12. LOWESS smoother plot of trend in changes in annual loads (tons/year) of TPin (a) and TPbalance (b) during
2008–2018.Hydrology 2021, 8, 114 17 of 20
Figure 13. Fractional polynomial regression between monthly (a) and annual (b) means (1994–2018) of TPout concentrations
(ppm).
Figure 14. (a) Maximum cranes counted (103 ). (b) LOWESS smoother trend plot of changes in monthly means of TPout
(ppb) during 1994–2018.
Figure 15. Fractional polynomial regression between monthly means (1994–2018) of TPout concentration (ppm) and
no-crane months (5–11) (a) and crane months (12, 1, 2, 3, 4) (b).Hydrology 2021, 8, 114 18 of 20
5. Conclusive Remarks
Documented information on the contribution of TP from the Hula Valley due to winter
migration of cranes does not include water quality damage in Lakes Agmon and Kinneret.
Geochemical research on the phosphorus dynamics in the organic peat soil of the Hula
Valley indicated a high content in the upper layers of the crane-feeding land plot as well
as in adjacent drainage canals [15,38–42]. Nevertheless, these results were not long term
(multi-annual). Short-term TP elevation in the Lake Agmon waters were documented,
but the TP concentration diminished significantly for the rest of the time. It is therefore
unlikely that the crane presence poses long-term risks to water quality in both Lakes Agmon
and Kinneret. Moreover, data shown in this paper confirm the multi-annual elevation in
the TP concentration in Lake Agmon, but analysis of TP seasonal fluctuation confirms
that this increased concentration could be attributed to aquatic plants and not cranes.
Underground-water-mediated phosphorus migration from northern to the southern Hula
Valley was indicated earlier but not later. However, regarding the fate of accumulated
phosphorus in the shallow depths of the southern Hula Valley, an unconfirmed hypothesis
was defined: this stock phosphorus migrates into much deeper strata. A study was carried
out in the early 1970s as part of the Lignite Project; deep (below 20 m) lignite waters were
analyzed, and difficult breakable organic compounds containing phosphorus were found.
Another unconfirmed assumption was raised later about the possibility of deep-layer
vertical migration toward the south. Conclusively, the underground-water-mediated and,
probably, part of the runoff-mediated phosphorus in the drainage canals in the Hula Valley
is not fluxed into Lake Kinneret.
Funding: This research received no external funding.
Acknowledgments: The construction and routine operation of the Hula Reclamation Project and
the agricultural management in the Hula Valley were implemented and routinely monitored by
the Keren Kayemet LeIsrael, Jewish National Foundation; MIGAL, Scientific Research Institute;
the Upper Galilee Municipality; the Agriculture Society, Upper Galilee; and the Israeli National
Water Authority. Data, technical assistance, and financial support were implemented by KKL-JNF,
MIGAL, and the Israeli National Water Authority. Warm personal thanks are due to E. Naim, I. Inbar,
V. Orlov-Levin, M. Meron, Y. Tsipris, E. Yasur. T. Natanzon, I. Barnea, and G. Eshel. The crane project
was (27 April 2021) presented at the Galilee Research Conference, Tel Hai College, by Y. Leshem,
D. Alon, O. Barnea, and M. Gophen.
Conflicts of Interest: The author declare no conflict of interest.
References
1. Gophen, M. Water Utilization in Semi Arid Zone. Hula Valley (Israel): Pollutant removal, Agriculture and Ecotourism Man-
agement. In Water in the Middle East and North Africa: Resources, Protection, and Management; Springer: Berlin, Germany, 2003;
pp. 207–225.
2. Dimentman, C.; Bromley, H.J.; Por, F.D. Lake Hula: Reconstruction of the Fauna and Hydrobiology of a Lost Lake; The Israel Academy
of Science and Humanities: Jerusalem, Israel, 1992; p. 170.
3. Gophen, M.; Meron, M.; Orlov-Levin, V.; Tsipris, Y. Seasonal and spatial distribution of N & P substances in the Hula Valley
(Israel) subterranean. Open J. Mod. Hydrol. 2014, 4, 121–131. [CrossRef]
4. Gophen, M. Climate Change—Enhanced, Cyanobacteria Domination in Lake Kinneret: A Retrospective Overview. Water
2021, 13, 163. [CrossRef]
5. Alperson-Afil, N.; Sharon, G.; Kislev, M.; Melamed, Y.; Zohar, I.; Ashkenazi, S.; Rabinovich, R.; Biton, R.; Werker, E.; Hartman,
G.; et al. Spatial Organization of Hominin Activities at Gesher Benot Ya’aqov, Israel. Science 2009, 326, 1677–1680. [CrossRef]
6. Foner, A.H.; Ganor, E.; Gravenhorst, G. The Chemical composition and sources of the bulk deposition on Lake Kinneret (The Sea
of Galilee), Israel. J. Arid. Environ. 2009, 73, 40–47. [CrossRef]
7. Gophen, M.; Meron, M.; Tsipris, Y.; Orlov-Levine, V.; Peres, M. Chemical, Hydrological and Climatological Properties of Lake
Agmon, Hula Valley (Israel) (1994–2006). Open J. Mod. Hydrol. 2016, 6, 8–18. [CrossRef]
8. Alon, D.; Yom-Tov, Y. Cranes in the Hula Valley; Hula Project Annual Reports; Gophen, M., Ed.; 1999–2001; pp. 72–86. Available
online: https://www.scirp.org/journal/paperinformation.aspx?paperid=75820 (accessed on 12 July 2021).
9. Gophen, M. Partnerships between the Managements of Cranes (Grus grus) and Kinneret Water Quality Protection in the Hula
Valley, Israel. Open J. Mod. Hydrol. 2017, 7, 200–208. [CrossRef]Hydrology 2021, 8, 114 19 of 20
10. Alonso, J.C.; Alonso, J.A.; Bautista, L.M. A review of the Crane-Agriculture Conflict at Gallocanta Lake, Spain. In Crane and
Agriculture: A Global Guide for Sharing the Landscape; Austin, J.E., Morrison, K., Harris, J.T., Eds.; International Crane Foundation:
Baraboo, WI, USA, 2018; pp. 271–279.
11. Austin, J.E.; Morrison, K.L.; Harris, J.T. Cranes and Agriculture: A Global Guide for Sharing the Landscape. International Crane
Foundation and IUCN Species Survival Commission Crane Specialist Group; The International Crane Foundation: Baraboo, WI, USA,
2018; p. 400.
12. Gophen, M. Management Improvement of the Agmon Wetlands System (Hula Valley, Israel) aimed at Enhancement of Bird
Populations and Kinneret Protection. Open J. Mod. Hydrol. 2015, 5, 1–9. [CrossRef]
13. Barnea, I. (Ed.) Jewish National Fund (Keren Kayemet LeIsrael) Migal-Scientific Research Institute and Israeli Water Authority; Hula
Project Annual Report; Israel Water Authority, and Jewish National Fund (KKL): Jerusalem, Israel, 2008; p. 159.
14. Barnea, I.; Kaplan, D. (Eds.) Jewish National Fund (Keren Kayemet LeIsrael) Migal-Scientific Research Institute and Israeli Water
Authority; Hula Project Annual Report; Israel Water Authority, and Jewish National Fund (KKL): Jerusalem, Israel, 2008–2018;
p. 232.
15. Barnea, I. Reexamination of Phosphorus Fertilization Practices in the Altered Wetland Soil of Hula Valley, Israel. Ph.D. Thesis,
The Hebrew University, Jerusalem, Israel, 2009.
16. Gophen, M.; Levanon, D. (Eds.) 1993–2006 Hula Project, Annual Reports; Migal-Scientific Research Institute, Jewish National Fund
(Keren Kayemet LeIsrael), U.S. Forestry Service International Project, Israeli Water Authority and Jewish National Fund (KKL):
Jerusalem, Israel, 1993–2006.
17. Gonen, E. (Ed.) Hula Project Annual Report; Jewish National Fund (Keren Kayemet LeIsrael) Migal-Scientific Research Institute
and Israeli Water Authority, and Jewish National Fund (KKL): Jerusalem, Israel, 2007; p. 133.
18. Hambright, D.K.; Zohary, T. Lake Hula and Agmon: Destruction and creation of wetland ecosystem in northern Israel. Wetl. Ecol.
Manag. 1998, 6, 83089.
19. LKDB-IOLR. Annual Reports; Kinneret Limnoilogical Laboratory, IOLR-KLL Publishers: Haifa-Migdal, Israel, 1970–2018.
20. Gophen, M. Climate and Water Balance Changes in the Kinneret Watershed: A review. Open J. Mod. Hydrol. 2020, 10, 21–29.
[CrossRef]
21. Lzuno Forrest, T.; Whalen, P.J. Phosphorus Management in Organic (Histosols) Soils. In Phosphorus Biogeochemistry in Subtropical
Ecosystems Reddy; O’Connor, K.R.G.A., Schelske, C.L., Eds.; LEWIS PUBLISHERS: Boca Raton, FL, USA; London, UK; New York,
NY, USA; Washington, DC, USA, 1999; pp. 425–445.
22. Richardson, C.J. The Role of Wetlands in Storage, and Cycling of M. H. Olson. In Phosphorus Biogeochemistry in Subtropical
Ecosystems; O’Connor, K.R.G.A., Schelske, C.L., Eds.; LEWIS PUBLISHERS: Boca Raton, FL, USA; London, UK; New York, NY,
USA; Washington, DC, USA, 1999; pp. 47–68.
23. Wetzel, R.G. Organic Phosphorus Mineralization in Soil and Sediments. In Phosphorus Biogeochemistry in Subtropical Ecosystems;
Reddy, R.K., O’Connor, G.A., Schelske, C.L., Eds.; LEWIS PUBLISHERS: Boca Raton, FL, USA; London, UK; New York, NY, USA;
Washington, DC, USA, 1999; pp. 225–245.
24. Gophen, M. From Natural to Man-Made Hula Wetland (Israel) (1950–1998): Utilization and Nutrient Removal. In Proceedings of
the 6th International Conference on Wetland Systems for Water Pollution Control, International Association-Water Quality: The
Use of Macrophytes in Water Pollution Control (IAWQ), Agua de Sao Pedro, Brazil, 27 September–2 October 1998; pp. 195–205.
25. Gophen, M. Nutrient and plant dynamics in lake Agmon wetland (Hula Valley, Israel): A review with emphasis on Typha
domingensis (1994–1999). Hydrobiologia 2000, 441, 25–36. [CrossRef]
26. Gophen, M. Nitrogen and Phosphorus dynamics in the Shallow Lake Agmon (Hula Valley, Israel). Open J. Ecol. 2015, 5, 55–65.
[CrossRef]
27. Kaplan, D. 1997–2004 Chapter: Submerged Vegetation. In Hula Project Annual Reports; Gophen, M., Ed.; Jewish National Fund
(KKL): Jerusalem, Israel, 1997–2005.
28. Gophen, M. The Hula Valley (Israel): From Nature to Anthropogenic Management, A Review. Rev. Soc. Sci. 2016, 1, 1–10.
[CrossRef]
29. Markel, D.; Sas, E.; Lazar, B.; Bein, A. Chapter: Biogeochemistry. In Hula Project, Annual Report, 9th ed.; Gophen, M., Ed.; Jewish
National Fund (KKL): Jerusalem, Israel, 1997; pp. 33–37. (In Hebrew)
30. Starmach, K. P excretion by Larus ridibundum and Malard platyrinchos. Ekol. Pol. 1996, 445, 289–297.
31. Grana, A.L.; Tavernari, F.C.; Lelis, G.R.; Albino, L.F.T.; Rostagno, H.S.; Gomes, P.C. Evaluation of nutrient excretion and retention
in broilers submitted to different nutritional strategies. Rev. Bras. Cien. Avic. 2013, 15, 1–13.
32. Gophen, M. Water Utilization in Semi-Arid Zone, The Hula Valley (Israel): Pollutant Removal, Agriculture and Ecotourism
Management. In Water in the Middle East and in North Africa, Resources, Protection, and Management; Zereini, F., Jaeschke, W., Eds.;
Springer: Berlin/Heidelberg, Germany, 2004; pp. 207–225. Available online: https://www.researchgate.net/publication/30
1988613_Water_Utilization_in_Semi-Arid_Zone_The_Hula_Valley_Israel_Pollutant_Removal_Agriculture_and_Ecotourism_
Management (accessed on 12 July 2021).
33. Scherer, M.N.; Gibbons, H.L.K.; Stoops, B.; Muller, M. Phosphorus loading of an Urban Lake by Bird Droppings. Lake Reserv.
Manag. 1995, 11, 317–327. [CrossRef]
34. Ganning, B.; Wulff, F. The effects of bird droppings on chemical and biological dynamics in brackish water rockpools. Oikos 1969,
20, 274–286. [CrossRef]Hydrology 2021, 8, 114 20 of 20
35. Sitters, S.E.; Bakker, J.M.B.; Veen, G.F.; Olde-Venternick, H.; Vanni, M. The stochiometry of nutrient release by terrestrial herbivore
and its ecosystem consequences. Front. Earth Sci. 2017, 5, 32. [CrossRef]
36. Gould, D.J.; Fletcher, M.R. Gull droppings and their effects on water quality. Water Res. 1978, 12, 665–672. [CrossRef]
37. Fleming, P. The Impact of Waterfowl on Water Quality. Literature Review; Ridgetown College, University of Guelph: Ridgetown, ON,
Canada, 2001; p. 14.
38. Haygarth, M.P.; Delgado, A.; Chardon, W.J.; Litaor, M.I.; Gil-Sotres, F.; Torrent, J. Phosphorus in soils and its transfer to water:
From fine-scale soil processes to models and solutions in landscapes and catchments. Soil Use Manag. 2013, 29, 3–21. [CrossRef]
39. Litaor, M.I.; Chashmonai, I.; Barnea, I.; Reichmann, O.; Shenker, M. Assessment of phosphorus fertilizer practices in altered
wetland soils using uncertainty analysis. Soil Use Manag. 2013, 29, 55–63. [CrossRef]
40. Litaor, M.I.; Reichmann, O.; Dente, E.; Naftaly, A.; Shenker, M. The impact of ornithogenic inputs on phosphorous transport from
altered wetland soils to waterways in East Mediterranean ecosystem. Sci. Total Environ. 2014, 473, 36–42. [CrossRef]
41. Reichmann, O.; Chen, Y.; Litaor, M.I. Spatial Model Assessment of P Transport from Soils to Waterways in an Eastern Mediter-
ranean Watershed. Water 2013, 5, 262–279. [CrossRef]
42. Reichman, O.; Chen, Y.; Litaor, M.I. The Impact of Rainfall-Runoff Events on the Water Quality of the Upper Catchment of the
Jordan River, Israel. In Integrated Water Resources Management: Concept, Research and Implementation; Borchardt, D., Ed.; Springer:
New York, NY, USA, 2016; pp. 129–146.
43. Post, D.M.; Taylor, J.P.; Kitchell, J.F.; Olson, M.H.; Schindler, D.E.; Herwig, B.R. The Role of Migratory Waterfowl as Nutrient
Vectors in a Managed Wetlands. Conserv. Biol. 1998, 12, 910–920. [CrossRef]
44. Pokrovski, I.; Kolzsch, A.; Sherub, S.; Feldler, W.; Glazov, P.; Kulikova, O.; Wikelski, M.; Flack, A. Longer days enable higher
activity for migratory birds. J. Anim. Ecol. 2021. [CrossRef] [PubMed]
45. Hayes, F.E.; Hayward, J.L. Nocturnal copulation in Glaucous-winged Gulls Larus glaucescens. Mar. Ornithol. 2020, 48, 55–59.
46. Kostecke, R.M.; Smith, L.M. Nocturnal behaviour of Amerucan Avocets in Playa Wetlands on the Sothern High Plains of Texas,
USA. Waterbirds 2003, 26, 192–195. [CrossRef]
47. Yatom, S.; Rabinovich, O. 1998 Hula Project Annual Report: Fractionation of organic soils in the Hula Valley. In Partition Indices
and Organic Fractionation: Conclusive Report; Gophen, M., Ed.; Jewish National Fund (KKL): Jerusalem, Israel, 1999; pp. 86–99.
(In Hebrew)
48. Meron, S.M.Y.; Rabinovich, O.; Yasur, E.; Banin, A. Manganese Deficiency and Reduction of Organic Soil Productivity in the
Hula Valley. In 1995 Hula Project Annual Report; Gophen, M., Ed.; Jewish National Fund (KKL): Jerusalem, Israel, 1996; pp. 8–21.
(In Hebrew)
49. Xiang, H.F.; Banin, A. Solid-Phase Manganese Fractionation Changes in Saturated Arid Zone Soil Pathways and Kinetics. Am. J.
Soil Sci. 1996, 60, 1072–1080. [CrossRef]
50. Campbell, K.L.; Capece, J.C. Hydrologic Processes Influencing Phosphorus Transport. In Phosphorus Biogeochemistry in Subtropical
Ecosystems; Reddy, R.K., O’Connor, G.A., Schelske, C.L., Eds.; LEWIS PUBLISHERS: Boca Raton, FL, USA; London, UK; New York,
NY, USA; Washington, DC, USA, 1999; pp. 343–354.
51. Gophen, M.; Kaplan, D.; Tsipris, Y.; Meron, M. The newly constructed wetland ecosystem of Lake Agmon (Hula Valley, Israel):
Functional perspectives. In Treatment Wetlands for Water Quality Improvement, Quebec 2000 Conference Proceedings (Selected Papers);
Pries, J., Ed.; CH2M Hill Canada Ltd.: North York, ON, Canada, 2001; pp. 53–62. Available online: https://www.migal.org.il/en/
node/837/publications?title=&page=4 (accessed on 12 July 2021).
52. Kaplan, D. Submerged Vegetation. In Hula Project Annual Report; Gophen, M., Ed.; Jewish National Fund (KKL): Jerusalem, Israel,
1998; pp. 85–96.You can also read