Economic activity and social change in the UK, real-time indicators: 12 January 2023
←
→
Page content transcription
If your browser does not render page correctly, please read the page content below
Statistical bulletin

Economic activity and social change in the
UK, real-time indicators: 12 January 2023
Early experimental data and analysis on economic activity and social change in the UK.
These real-time indicators are created using rapid response surveys, novel data
sources and experimental methods.

Contact:                          Release date:                     Next release:
Tom Williams                      12 January 2023                   19 January 2023
realtime.indicators@ons.gov.uk
+44 1633 455932

                                  Notice
12 January 2023
This week, the bulletin contains a reduced suite of indicators as we assess our future publication schedule. This
will continue to be a weekly release, but the frequency of some indicators may change. If you have any questions
or comments, please contact realtime.indicators@ons.gov.uk.

                                                                                                              Page 1 of 9
Table of contents
1. Main points
2. Latest indicators at a glance
3. Consumer behaviour
4. Business and workforce
5. Transport
6. Data
7. Glossary
8. Measuring the data
9. Strengths and limitations
10. Related links
11. Cite this statistical bulletin
Page 2 of 91 . Main points
After trending downwards for almost a year, the total number of online job adverts fell below the pre-
coronavirus (COVID-19) baseline in the week to 6 January 2023, for the first time since mid-April 2021
(Adzuna). Section 4: Business and workforce.
When looking ahead to February 2023, one in five (20%) businesses reported energy prices were their
main concern, followed by inflation of goods and services prices (16%) and the falling demand of goods
and services (14%) (final results from Wave 73 of the Business Insights and Conditions Survey (BICS)).
Section 4: Business and workforce.
Consumer behaviour indicators showed mostly decreased activity in the latest period, with Revolut debit
card spending falling by 7 percentage points and overall retail footfall decreasing to 84% of the level of the
previous week, in line with expected seasonal reductions in activity (Revolut, Springboard). Section 3:
Consumer behaviour.
The System Average Price (SAP) of gas fell by 8% in the week to 8 January 2023 compared with the
previous week and was 10% below the level of the equivalent week of 2022, partly driven by lower demand
because of unseasonably mild weather across the UK and large parts of Europe (National Grid).
The average number of UK flights in the week to 8 January 2023 and the number of Heathrow passengers
in November 2022 were both above the levels reported in the equivalent period of the previous year;
however, both remained below the levels of the equivalent period in 2019 at 89% and 92%, respectively
(EUROCONTROL, Civil Aviation Authority). Section 5: Transport.
Results presented in this bulletin are experimental and may be subject to revision. Data sources used to compile
these indicators are regularly reviewed to ensure they are representative and relevant, which may mean
indicators change at short notice.
2 . Latest indicators at a glance
Notes:
1. Revolut adjustments to user count are at an aggregate level, and as such, age bands may not adjust
evenly.
2. Users should note that card spending over time is pushed upwards by the impacts of both inflation on
value of transactions and cash-to-card conversion.
3. Data for the CHAPS-based indicator of credit and debit card purchases are provisional from 5 December
2022 onward.
.xlsx
Page 3 of 93 . Consumer behaviour
Revolut debit card spending fell by 7 percentage points in the week to 8 January 2023 compared with the
previous week. Of the six sector categories, spending decreased in four categories and increased in two
categories. After experiencing the largest increases in the previous week, spending in "pubs, restaurants and fast
food" and "entertainment" decreased the most in the latest period, falling by 25 and 14 percentage points,
respectively. These changes are in line with expected seasonal patterns. The "automotive fuel" category saw the
largest increase of 3 percentage points.
All categories were above the level of spending seen in the equivalent period of 2022, with spending in
"automotive fuel" and "entertainment" at 47 percentage points and 38 percentage points above this level,
respectively. Although "entertainment" spending rose above the pre-coronavirus (COVID-19) baseline for the first
time since February 2020 in the previous week, in the latest period, it fell again to 12 percentage points below
this level. Users should note that these data are not adjusted for the potential effects of inflation on the value of
transactions. Our accompanying Revolut spending on debit cards dataset is available.
The number of in-store transactions at most Pret A Manger locations increased in the week to 5 January 2023,
following the previous week's substantial fall in transactions, which was consistent with previous seasonal
patterns. Transactions increased in eight of the ten available location categories in the week to 5 January 2023,
with the impact of the national rail strikes largely offset by people returning to work and school following the
Christmas holidays.
Transactions in Manchester saw the largest increase of 32 percentage points compared with the previous week,
while regional town and London Airport locations saw the only decreases, with both falling by 8 percentage
points. Our accompanying Transactions at Pret A Manger dataset is available.
Overall retail footfall decreased in the week to 8 January 2023 to 84% of the level of the previous week and 86%
of the level seen in the equivalent week of 2019. Footfall in shopping centres saw the largest week-on-week
decrease, at 80% of the level of the previous week, and also recorded the lowest level compared with 2019, at
83%. Footfall in retail parks was the closest to 2019 levels, at 92%.
Retail footfall also decreased in 9 of the 12 UK countries and English regions in the latest week. The largest
decrease was in London, at 92% of the level of the previous week. All regions were down on 2019 levels, with the
East of England closest at 93% and the East Midlands lowest at 85%.
The latest data for Automotive fuel spending are available in our accompanying Automotive fuel spending dataset.
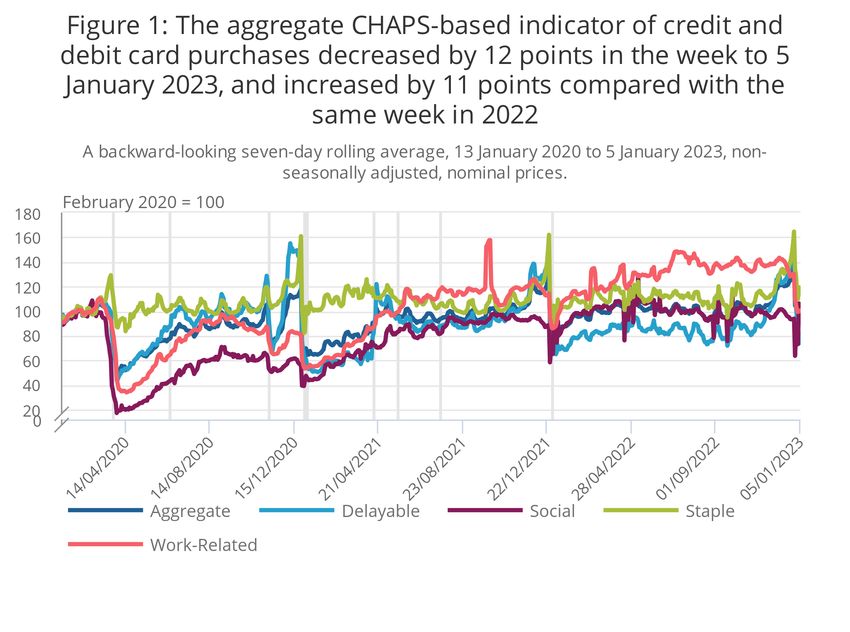
Page 4 of 9Daily CHAPS-based indicator
Figure 1: The aggregate CHAPS-based indicator of credit and debit card purchases decreased by 12
points in the week to 5 January 2023, and increased by 11 points compared with the same week in 2022
A backward-looking seven-day rolling average, 13 January 2020 to 5 January 2023, non-seasonally adjusted, nominal prices.
Source: Office for National Statistics – ONS calculations on Bank of England data
Notes:
1. Users should note the daily payment data are the sum of card transactions processed up to the previous
working day, so there is a slight time lag when compared with real-world events on the chart.
2. The vertical lines indicate notable events and coronavirus (COVID-19) restriction changes.
3. Percentage point difference is derived from the current week and previous week index before rounding.
4. Data are provisional from 5 December 2022 onward.
Page 5 of 9UK spending on debit and credit cards: monthly CHAPS-based indicator
Figure 2: Retail sales data follow a similar trend to the CHAPS index of aggregate credit and debit card
spending
Monthly average, non-seasonally adjusted, nominal prices and retail sales values, January 2020 to December 2022
Source: Office for National Statistics – ONS calculations on Bank of England data, ONS Monthly Business Survey – Retail
Sales Inquiry
Notes:
1. CHAPS uses a broader definition of retail than the Retail Sales Index, including expenditure on train fares
and social activities such as meals or drinks in pubs and restaurants.
2. The CHAPS index is not adjusted for seasonality as there is not currently enough back data to test. Non-
seasonally adjusted data will reflect the impact of factors such as the number of trading days in the month
and bank holidays.
3. The monthly CHAPS index is calculated by the ONS, rather than being an additional series that is
produced and validated by the Bank of England.
4. Our Retail sales bulletin'smain measure is seasonally adjusted volume, which differs to the series
presented in this figure.
Page 6 of 94 . Business and workforce
The total number of online job adverts fell by 3% in the week to 6 January 2023 compared with the previous
week, with falls in 20 of the 28 job categories and 11 of the 12 UK countries and English regions. The "HR and
recruitment" job category saw the largest decrease and fell by 19%, followed by the "energy, oil and gas" job
category, which fell by 7%. Of the 12 UK countries and English regions, the largest falls were seen in the East
Midlands, London and the North East, which all fell by 5%. The only region to show an increase on the week was
Northern Ireland, which was up by 3%.
The total number of online job adverts was also 16% lower than the level seen in the equivalent period of 2022,
with manufacturing showing the largest change, at 44% below the level of the equivalent period of last year. For
the first time since mid-April 2021, the total number of online job adverts was below the pre-coronavirus (COVID-
19) baseline, with the number of adverts 2% lower than this level. However, job advert numbers in early January
historically show a strong seasonal effect, and should be viewed cautiously when making comparisons to other
periods in the year. Our accompanying Online job advert estimates dataset is available.
5 . Transport
In November 2022, the number of passengers at Heathrow was 92% of the level seen in November 2019 but was
86% higher than the level reported in November 2021. Our accompanying Heathrow flight passengers dataset is
available.
The average number of UK flights in the week to 8 January 2023 increased by 7% from the previous week and
was 135% of the level seen in the equivalent week of 2022. However, this was only 89% of the pre-coronavirus
(COVID-19) level seen in the equivalent week of 2019. Our accompanying Daily UK flights dataset is available.
In the week to 8 January 2023, traffic camera activity for cars in London increased by 4% from the previous week,
to 105% of the pre-coronavirus level. Pedestrian and cyclist activity in London grew by 10% compared with the
previous week but remained at 85% of the pre-coronavirus level. Our accompanying Traffic camera activity
dataset is available.
Page 7 of 96 . Data
Automotive fuel spending
Dataset | Released 12 January 2023
Estimated quantity of automotive fuel demand per average transaction is an experimental indicator used to
isolate real demand after adjusting for growth in fuel prices.
Online job advert estimates
Dataset | Released 12 January 2023
Experimental job advert indices covering the UK job market.
Revolut spending on debit cards
Dataset | Released 12 January 2023
Experimental indices of Revolut debit card transaction data, UK. Includes sectoral, age and online versus in-
store breakdowns. Daily seven-day averages updated weekly, plus monthly averages.
System Average Price (SAP) of gas
Dataset | Released 12 January 2023
Daily and rolling average System Average Price (SAP) of gas traded in Great Britain over the On-the-Day
Commodity Market (OCM).
Transactions at Pret a Manger
Dataset | Released 12 January 2023
Weekly transactional data from approximately 400 Pret A Manger stores around the UK.
UK spending on credit and debit cards
Dataset | Released 12 January 2023
These data series are experimental real-time indicators for monitoring UK spending using debit and credit
cards. They track the daily CHAPS payments made by credit and debit card payment processors to around
100 major UK retail corporates, based on data supplied by the Bank of England.
This section lists a selection of the data available in this publication. For the full list of available datasets, please
see our accompanying dataset page.
7 . Glossary
Real-time indicator
A real-time indicator provides insights into economic activity using close-to-real-time big data, administrative data
sources, rapid response surveys or Experimental Statistics, which represent useful economic and social concepts.
8 . Measuring the data
Information on the methodology used to produce the indicators in this bulletin is available in our Economic activity
and social change in the UK, real-time indicators methodology.
Page 8 of 99 . Strengths and limitations
These statistics have been produced to provide timely indicators of the effect of developing world events on the
UK economy and society, using close-to-real-time big data, administrative data sources, rapid response surveys
or Experimental Statistics.
The data presented in this bulletin are reviewed and refreshed on a regular basis. Indicators are swapped in and
out of the publication based on their suitability and availability.
UK coronavirus (COVID-19) restrictions
Coronavirus restrictions should be considered when interpreting the data featured throughout this bulletin.
Seasonality
Seasonal fluctuations are likely to be present in many of these indicators so caution must be applied when
interpreting changes in series that are not seasonally adjusted.
10 . Related links
Public opinions and social trends, Great Britain
Bulletin | Released fortnightly
Social insights on daily life and events, including the cost of living, working arrangements and well-being
from the Opinions and Lifestyle Survey (OPN).
Business insights and impact on the UK economy
Bulletin | Released fortnightly
The impact of challenges facing the economy and other events on UK businesses. Based on responses
from the voluntary fortnightly business survey (BICS) to deliver real-time information to help assess issues
affecting UK businesses and economy, including financial performance, workforce, trade, and business
resilience.
11 . Cite this statistical bulletin
Office for National Statistics (ONS), published 12 January 2023, ONS website, statistical bulletin, Economic
activity and social change in the UK, real-time indicators: 12 January 2023
Page 9 of 9You can also read