Economic and Strategy Viewpoint - May 2019 - For professional investors and advisers only - Schroders
←
→
Page content transcription
If your browser does not render page correctly, please read the page content below
For professional investors and advisers only.

Economic
and Strategy
Viewpoint
May 2019
3
Are stock markets heading for a melt-up?
– With equity markets strengthening and the Fed on hold there is talk of a surge,
or melt-up in markets. Signs of economic recovery, low inflation and easier
central bank policy in Europe and Asia reinforce the Goldilocks narrative.
– Macro headwinds such as excess inventory, higher oil prices and a potential
squeeze on profit margins threaten to check equity markets. These risks may
Keith Wade materialise, but the lesson from history is that a melt-up can happen precisely
Chief Economist and because it is driven by sentiment rather than macro.
Strategist
(44-20)7658 6296
7
UK: growth built on sand
– Despite concerns over the impact of Brexit uncertainty, UK economic growth is
likely to have picked up markedly over the first quarter of the year. The UK
manufacturing sector appears to be buoyant again, although the headline
figures are not what they seem.
– Huge stockpiling appears to have taken place in the run-up to the March Brexit
deadline. While this has boosted output of late, growth is highly likely to slow in
coming months as excess inventories are wound down. Therefore, it may be
premature to celebrate the likely improvement in near-term growth.
Azad Zangana
Senior European Economist
and Strategist
(44-20)7658 2671
10
Quarantining Turkey and Argentina
– Turkey and Argentina face some serious problems. Luckily, we do not see a
likelihood of contagion for the rest of EM.
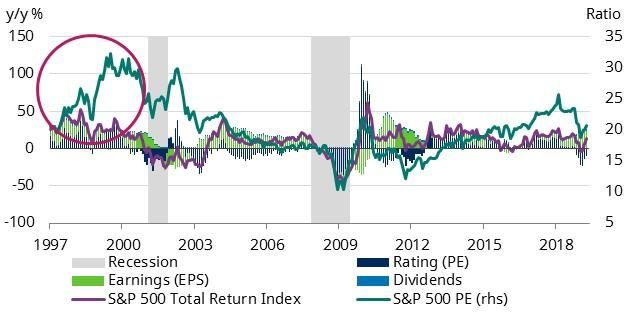
Chart: Market returns and PE ratios, 1997–2000 in focus
Craig Botham
Senior Emerging Markets
Economist
(44-20)7658 2882
Source: Thomson Reuters Datastream, Schroders Economics Group, 29 April 2019.
Economic and Strategy Viewpoint May 2019 2Are stock markets heading for a melt-up?
“We have a risk of a melt-up, not a meltdown here. Despite where the
markets are in equities, we have not seen money being put to work.”
Head of large asset manager (16 April 2019, CNBC)
Back to Equity markets have performed well so far this year, but there is now talk of a "melt-
up" with a number of investors arguing we will see a surge in indices in coming
Goldilocks?
months. Underlying this is the view that we are back in a "Goldilocks" environment
where growth is "not too hot" to create inflation and "not too cold" to depress profits,
it is "just right". The US Federal Reserve (Fed) is on hold, bond yields are low and
investors have cash to put to work having missed out (apparently) on the rally
in markets.
Certainly the Fed is playing its part following its dovish tilt earlier in the year which
has led markets to dismiss the possibility of any further rate hikes in this cycle. The
Fed can step back and markets can move higher. The historical comparison is with
1997 when a Fed tightening cycle was halted by the Asia and emerging markets crisis
which led to fears of deflation. The subsequent crisis at Long Term Capital
Management (LTCM)1 in September 1998 then spurred rate cuts. The Fed's easier
stance helped fuel the rapid rise in markets, culminating in the tech bubble of 1999 –
a melt-up if ever there was one.
In today's market, the key factor for policy makers has been the benign behaviour of
inflation. Despite being late in the economic cycle when tight labour markets and
high rates of capacity use would normally put upward pressure on prices, US inflation
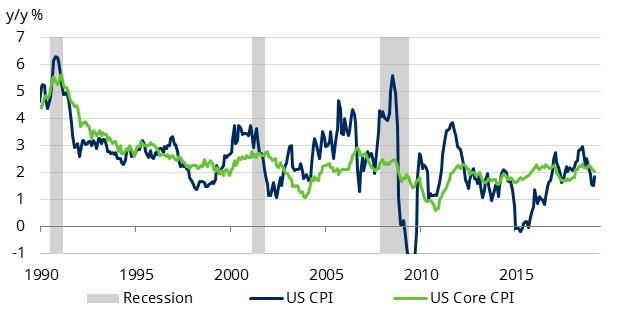
has been falling. Headline consumer price inflation (CPI) was 1.9% in March, down
one percentage point since last June. Meanwhile the core rate (CPI ex. food and
energy) was 2% in March compared with 2.3% last July. The key core personal
consumer deflator (the Fed’s preferred measure) was running at just 1.5% in March.
Chart 1: Well behaved – US inflation
Source: Thomson Datastream, Schroders Economics Group. 29 April 2019.
1LTCM was a hedge fund using leveraged trading strategies which received a bail out from the New York
Federal Reserve in September 1998 on concerns for the wider financial system.
Economic and Strategy Viewpoint May 2019 3Inflation is a lagging indicator so low rates today do not mean low rates tomorrow.
Low inflation
Nonetheless by starting at such levels there is a sizable cushion for the Fed to
allows the Fed to tolerate a pick-up in price pressures in the coming months and so allow it to be
be patient patient in determining interest rates.
More green shoots
On the growth side, there are also elements of Goldilocks. The US economy grew
3.2% in the first quarter, up from 2.2% at the end of last year and well ahead of
expectations. The typical seasonal pattern of a weak Q1 does not seem to apply in
2019 and President Trump was quick to tweet: "This is far above expectations or
projections. Importantly, inflation VERY LOW. MAKE AMERICA GREAT AGAIN!" The
reference to inflation is clearly a reminder to the Fed that it does not need to react
with a rate hike.
Looking beyond the US, there are signs that China is responding to stimulus with a
Signs of recovery pick up in the purchasing managers' index (PMI) and our Schroders China activity
in the US, China index has also bounced. At this time of year, the data is heavily distorted by the
and Europe Chinese New Year so we would resist calling a definite turn; nonetheless, leading
indicators such as credit have also strengthened, suggesting that easier monetary
policy and fiscal stimulus is working.
In Europe, the picture is more mixed, but here we also see signs of a turn with
industrial production in Germany and across the region levelling out over the past
three months while the manufacturing PMI's have bottomed out. Provisional
Eurozone GDP came in at 0.4% in the first quarter, after just 0.1% in Q4. The one-off
factors which depressed activity at the end of last year (tighter auto emissions
standards, the gilets jaunes protests, low water levels in the Rhine, etc.) have faded,
allowing growth to resume. The UK remains a problematic case with a big build up
of inventory as the Brexit cloud thickens (see below), but elsewhere the European
picture is improving and allowing recession talk to fade.
Alongside these positive signs, central banks have been following the Fed in moving
toward an easier monetary stance. The European Central Bank, Bank of Japan, and
Bank of Canada have pushed out tightening, whilst others such as the Reserve Bank
of India have cut rates.
These developments reinforce the Goldilocks narrative and are welcome after the
The recovery faces
gloom which had engulfed markets at the end of last year. In the near-term, they
three headwinds
are in line with our macro views, however recovery still faces three headwinds.
Inventory boost to fade
First, there has been a large and temporary boost from inventory, not just in the UK,
but across developed economies. Inventory added 0.7 percentage points to US GDP
annualised growth in Q1. Strip this factor out, along with volatile net exports, and
domestic final sales only grew at 1.4%, down from 2.1% in Q4 last year. The main
drivers of this measure are fixed investment and consumer spending where growth
rates halved in the first quarter.
Economic and Strategy Viewpoint May 2019 4Going forward, the large build-up of inventories relative to activity and orders
suggests that we will see a sharp cut back in inventory building in the current
quarter, which will slow growth, unless underlying consumption and investment
spending strengthen.
Higher oil prices threaten consumers
Another potential headwind to domestic demand is the rise in the oil price which
has rebounded this year. This reflects a combination of the inventory building
discussed above and the impact of the US ending sanctions waivers on purchases of
Iranian oil.
If sustained at current levels, oil will add to inflation later in the year. The risk to
activity would be that consumer spending slows in response as real incomes are
squeezed. Our forecasts for global activity are likely to move in a stag-flationary
direction as a result. Long run inflation expectations have risen in the inflation
market (chart 2) and the Fed will also be alert to any signs that inflation
expectations are rising in the wider economy, potentially pushing up wages.
Chart 2: Oil price leading inflation expectations higher
$/bbl %
120 2.4
100 2.2
2.0
80
1.8
60
1.6
40 1.4
20 1.2
2014 2015 2016 2017 2018 2019
Brent Crude Oil US TIPS – 10Y Breakeven Inflation rate
Source: Thomson Datastream, Schroders Economics Group. 29 April 2019.
For fixed investment, one positive would be a resolution of the US-China trade
tensions and we continue to believe that a solution will be reached later in the current
quarter. There is a risk that the trade war moves onto a new front with the US putting
tariffs on auto imports, or for a more general trade war to break out between the US
and EU. At this stage these are risks, as we doubt that president Trump would wish
to raise tariffs and inflation ahead of the 2020 presidential election. Nonetheless, it is
still possible.
Margin pressure to increase
Rising costs and The third headwind is from a potential profits squeeze. Whilst low inflation is seen as
low inflation an essential part of the Goldilocks scenario, it also reflects a lack of pricing power
points to a amongst companies. Since both wage and energy costs are rising, this would imply a
profits squeeze squeeze on profit margins. We expect US economic profits to rise 6% this year, but to
fall 4% in 20202. Earnings per share on the S&P500 would follow a similar path.
2 See our April Viewpoint here.
Economic and Strategy Viewpoint May 2019 5Such an outcome would be typical for a late cycle economy and can only be averted
through better cost control by holding back wage demands and/ or increasing
productivity. This would be a remarkable achievement at the end of a cycle when
typically wages accelerate and productivity often falls. Initial unemployment claims
suggest the labour market is at its tightest for 50 years.
Does this mean we can dismiss the idea of a melt-up in markets?
Even if the risks The prospect of a drop in profits does not bode well for the current proponents of a
materialise, a melt- melt-up: like many before and since, the late 1990s bull market was led by healthy
up can happen profits growth with gains in earnings per share accounting for a significant
proportion of returns up to 1999. However, back then the final stages of the bull
precisely because
market were driven entirely by a re-rating, with the price-earnings ratio on the
it is driven by
S&P500 rising significantly (see chart front page). The tech sector represented by the
sentiment rather NASDAQ composite accounted for much of this and saw the index rise by a
than macro remarkable 75% from late October 1999 to March 2000 (see chart 3).
This might tie in better with what people have in mind when they talk of a melt-up.
Nonetheless, it is difficult to point to a clear macro driver as at the time the Fed was
tightening policy in response to higher inflation. Liquidity was deteriorating as the
market rose until inevitably the bubble burst. We may be right on the macro risks
facing markets today, but the lesson from history would seem to be that melt-ups
develop a dynamic of their own by sucking in investors who are fearful of missing out
(FOMO). Any melt-up today would require the same – a FOMO mania.
Chart 3: Nasdaq, the Fed and inflation (1997–2000)
Index %
400 6
350
5
300
Jul 1997
250 Sep 1998 4
Asian Financial Crisis
(Thai baht collapses) LTCM collapses
200 3
150
2
100
50 1
1997 1998 1999 2000
NASDAQ (Jan 97=100) US CPI y/y (RHS) US Fed Funds rate (RHS)
Source: Thomson Datastream, Schroders Economics Group, 29 April 2019.
Economic and Strategy Viewpoint May 2019 6UK: growth built on sand
“We thought just in case there were significant delays at ports as a result of
Brexit, that we ought to increase our cover by about an extra month’s
supply, so didn’t sell out. The Holy Grail of retailing is you don’t want to hold
more stock than you need to — but given the high-profile nature of that
event, we genuinely thought it would be important to hold a few more
weeks’ stock just in case.”
Fortnum & Mason CEO Ewan Venters, in an interview with Talk Radio,
4 April 2019.
Brexit continues to dominate everyday life in the UK. News, politics and even lowly
economists pray for a break from the mundane gridlock and circular arguments. Now
that the Brexit deadline has been extended to October 3, a little breathing room has
been created to allow other topics to come into the fray.
The medium to long-term outlook for the economy will be heavily influenced by
Brexit, but in the near-term, data seems to have improved. The Bank of England had
downgraded its growth forecast for the coming quarters citing a more negative
impact from Brexit uncertainty than it had previously anticipated. However, recent
data has surprised to the upside. The monthly GDP release for January showed a
significant improvement, as GDP growth picked up to 0.5% compared to -0.3% in
December (Chart 4).
Chart 4: UK growth seems to be improving
Real GDP growth
First quarter GDP
1.2%
is set to show a
rebound in activity 1.0%
Q1 estimate
0.8%
0.6%
0.4%
0.2%
0.0%
-0.2%
-0.4%
Jan 17 Apr 17 Jul 17 Oct 17 Jan 18 Apr 18 Jul 18 Oct 18 Jan 19
m/m 3m/3m
Source: Thomson Datastream, ONS, Schroders Economics Group. 29 April 2019.
The release for February was more subdued with 0.2% growth, but even if the
economy stalls in March, the quarterly GDP estimate for the first quarter (3m/3m)
would be 0.5%. We suspect it could be even higher, but in any case, it is very likely to
be stronger than our present forecast, and will probably prompt many economists to
revise up their estimates for 2019. The data is due to be released on 10 May.
A simple analysis of the contributions to GDP shows that a resurgence in
manufacturing has played an important role in the pick-up in activity. This is reflected
by the recent readings from the Markit purchasing managers' indices (PMI) – a set of
private sector surveys that gauge the level of activity in the economy.
3See "Is the UK stuck in Brexit Limbo", 11 April 2019.
Economic and Strategy Viewpoint May 2019 7The March UK manufacturing PMI shows activity at its highest level since February
2018 (chart 5). In fact, the UK ranked only second to Denmark in the list of the 45
countries that Markit surveys.
Chart 5: UK PMIs suggest that manufacturing has led the rebound
Balance
Manufacturing is 65
buoyant once
again, although the
larger service 60
sector is struggling
55
50
45
2014 2015 2016 2017 2018 2019
Manufacturing PMI Services PMI
Source: Thomson Datastream, IHS Markit, Schroders Economics Group. 29 April 2019.
While manufacturing has been buoyant, services are struggling. The services PMI fell
to its lowest level since July 2016, which is certainly a concern for the coming months
given how much larger the service sector is in terms of its share of the economy.
Turning back to manufacturing, the sudden improvement does seem at odds with
global trends at present. Delving into the details of the manufacturing PMI survey,
we discover a worrying development. The survey questions that ask about the degree
to which companies are building inventories show stocks of both finished goods and
of purchases (parts or raw materials) are both are record highs (chart 6).
Chart 6: UK inventories hit a record high ahead of Brexit
Balance
Companies
70
stockpiling ahead
of Brexit have 65
boosted activity, 60
but is this 55
sustainable? 50
45
40
35
30
1992 1995 1998 2001 2004 2007 2010 2013 2016 2019
Stocks of finished goods Stocks of purchases
Source: Thomson Datastream, IHS Markit, Schroders Economics Group. 29 April 2019.
The unusual boost from Brexit
In the run-up to the original 31 March Brexit deadline, there had been a number of
anecdotal stories of both companies and government entities stockpiling supplies,
for example, of medicines by hospitals and pharmacies. While the above survey
questions only cover private manufacturers, we suspect it is a good indication of
widespread stockpiling.
Economic and Strategy Viewpoint May 2019 8Stockpiling inevitably leads to a slowdown in production at a later point in time.
Typically, a large build-up of inventories is involuntary. Companies are usually
producing output at a normal pace, when a fall in demand and sales leads to unsold
stocks building. This time is different as companies are hoarding ahead of possible
disruption to output and the ability to import. Regardless of the cause, the same
outcome of a slowdown in growth is likely, whether that disruption hits or not.
Once stockpiling For manufacturing activity to continue to enjoy above normal production, further
ends, GDP growth stockpiling would need to occur. Reports of shortages of warehouse space suggest
is likely to slow in that this is unlikely to continue for much longer. Production levels would have to be
the coming months wound down to stop any further build-up of inventories. If demand then disappoints,
or if imports are not as restricted as feared in a worst-case scenario, then excess
inventories would have to be discounted or destroyed at a cost to producers
and retailers.
Conclusions
A cautious approach to analysing the momentum of the UK economy will be required
in coming months. The improvement in monthly GDP figures appears to be driven by
stockpiling, and not final demand. This may have been a reaction to Brexit
uncertainty, but is still likely to lead to a slowdown in growth in the near future.
Meanwhile, leading indicators of activity in the services sector suggest a slump could
be on the horizon.
For the Bank of England, despite showing ambition to raise interest rates back to
more "normal" levels, the Bank is unlikely to follow through given the poor quality of
growth the UK is experiencing, set against a backdrop of ongoing Brexit uncertainty.
The government should also take note. Celebrating the forthcoming pick-up in GDP
growth for the first quarter could prove to be premature. Indeed, Chancellor Philip
Hammond has indicated that he may need to delay the next comprehensive spending
review due to the delay in Brexit. Committing to a multi-year spending programme
(which is likely to be stimulative) at a time of great uncertainty would be a big gamble.
Still, at least the UK is well stocked with luxury hampers and preservatives.
Economic and Strategy Viewpoint May 2019 9Quarantining Turkey and Argentina
“We cannot allow the use of the tool of exploitation that is interest.”
President Recep Tayyip Erdogan, 13 September 2018.
There are genuine Concerns are clearly building once more around Turkey and Argentina, which are
reasons for the sell once again experiencing a bout of currency volatility (chart 7). With growth seemingly
off in Turkey and faltering and fears of an eventual US recession, following the recent inversion of the
Argentina… yield curve, investors may be feeling more jittery than usual about the possibility of
contagion to the rest of emerging markets (EM).
We, however, think any such concerns are overblown. Turkey and Argentina are not
the symptom of a wider problem in EM; they face some rather unique problems in
both the economic and political spheres. Sentiment aside, we see no reason for
investors to extrapolate market performance in these two troubled economies to the
rest of the asset class.
Chart 7: Trying times for Argentina and Turkey's currencies
Rebased (1 Jan 2019 = 100)
125
120
115
110
105
…but the 100
argument for 95
contagion
90
is lacking
Jan 19 Feb 19 Mar 19 Apr 19
JPM EM FX ARSUSD TRYUSD
Source: Thomson Datastream, Schroders Economics Group, 26 April 2019.
Macro matters…
The two countries' woes have some similarities. Fundamentally, inflation is a big
concern in both economies and one which the respective central banks have been
struggling to stay on top of. Chart 8 illustrates the scale of the problem; inflation is
far above the EM average and has been climbing at a time when inflation in the rest
of EM has been flat or falling.
What is also apparent though is that nowhere else in EM has this problem. Inflation
is well under control thanks to a mix of global and domestic factors everywhere else,
and so investors would be hard pressed to find even an echo of Turkish or
Argentinian policy concerns in this space.
Economic and Strategy Viewpoint May 2019 10Chart 8: Inflation is a big, but unique problem for the troublesome two
CPI, %, y/y
60 60
50 50
40 40
30 30
20 20
10 10
0 0
HUF
ILS
MYR
CZK
ARS
ZAR
CLP
TWD
INR
BRL
MXN
PEN
CNY
TRY
IDR
PHP
KRW
PLN
THB
RUB
COP
Jan 18 Apr 18 Jul 18 Oct 18 Jan 19
EM inflation Argentina
Turkey
Source: Thomson Datastream, Schroders Economics Group. 26 April 2019.
Reserves are not Another challenge for Turkey is that it has very little firepower left to defend its
everything, but currency. Foreign currency reserves are very low relative to most metrics of adequate
Turkey could do reserves. There are a number of ways to assess this; whether the country has enough
with some reserves to finance a few months of imports, or to self finance maturing hard
currency debt, for example. Turkey looks objectively terrible on all of them (and
stated reserves may in any case be inflated by the use of swaps!).
As for the rest of EM, the question is how best to compare countries given the range
of metrics on offer. One option is to essentially combine them into a single measure,
as the IMF does4. The IMF approach notes that pressure on EM currencies can emerge
from a range of sources, and using historical evidence constructs a metric
incorporating export earnings (to guard against external demand shocks), external
debt (to guard against a "sudden stop" of foreign capital flows) and other liabilities,
and broad money (to guard against domestic capital flight).
Chart 9: A handful of countries join Turkey in concerning reserves territory
IMF reserve adequacy for a given exchange rate regime
350%
300%
250%
200%
150%
100%
50%
0%
TRY ZAR CLP HUF ARG MXN IDR KRW PLN COP CNY PHP MYR THB BRL INR CZK RUB
Floating exchange rate Fixed exchange rate
Source: Thomson Reuters Datastream, IMF, Schroders Economics Group. 26 April 2019. Adequacy
below 100% indicates insufficient reserves.
The weights assigned to each depend on the FX regime – a fixed exchange rate
requires more firepower to defend than a floating currency – but the rankings are
broadly unchanged by the choice of regime (chart 9).
Interestingly, Argentina would appear to have enough reserves to defend the
currency under a floating exchange rate regime, and so does not share Turkey's
4Moghadam, R., Ostry, J., and Sheehy, R., "Assessing Reserve Adequacy" IMF 2011.
Economic and Strategy Viewpoint May 2019 11vulnerability here. There are some economies which do – South Africa, Chile and
Hungary – and where pressures could potentially therefore emerge in the future.
However, at present these currencies are not seeing anything like the pressure that
the Turkish lira faces, while the Argentinian peso is underperforming despite
apparently enjoying an adequate buffer. The final explanatory variable in all of this is
policy, and politics.
…but so does policy credibility
The biggest Expectations play a crucial role in macroeconomic models and in financial markets. If
policymakers are not trusted to take the necessary measures in the future, even if
challenge is the
they are doing the right thing now, consumers, firms and investors will take fright.
direction of politics
The belief that central banks are unwilling or unable to deal with inflation, for
and policy example, will lead households to move their money out of the currency to prevent
losing the value of their savings. Firms will price in the expectation of further large
increases in costs, perpetuating the cycle. Investors will demand a greater return to
compensate for the risk that their investments will be eroded by inflation.
In both Turkey and Argentina, there is reason to fear for the path of policy. In Turkey
this is a familiar story by now; President Erdogan is vehemently opposed to orthodox
monetary policy and to that end has leant on the central bank on repeated occasions.
That the central bank recently dropped hawkish language, despite the pressure on
the currency, served as affirmation of this perception. The appointment of his son-in-
law as finance minister also did nothing to assuage market fears, particularly after
lacklustre PowerPoint presentations, most recently at the IMF meetings. There is little
sign so far that policy will take the right direction in Turkey.
In Argentina this is something of a new tune, at least under the current president.
President Macri was elected on an economically orthodox reform agenda, initially
cheered by markets. However, the turnaround has taken longer than expected, and
the electorate have begun to tire of promises of jam tomorrow. Former President
Cristina Fernández de Kirchner has begun to climb in the polls, with elections due this
October. The return of Kirchner, and populist policy, seems an increasingly
real threat.
Political challenges for Turkey and Argentina then are clearly significant, if not
insurmountable. The good news for the rest of EM though is that this is very clearly
country specific risk, and there is little reason for it to lead to contagion beyond the
hit to general EM investor sentiment.
It does however point to a need for investors to monitor political developments, and
for policymakers to maintain credibility; both in talking the talk and walking the walk.
Economic and Strategy Viewpoint May 2019 12Schroders Economics Group: Views at a glance
Macro summary – May 2019
Key points
Baseline
– After expanding by 3.2% in 2018, global growth is expected to moderate to 2.8% in 2019 and 2.7% in 2020.
Inflation is forecast to decline to 2.4% this year after 2.8% in 2018 and then falling to 2.5% in 2020.
Meanwhile we expect the US and China to sign a trade deal in June, although the impact of actions so far
will still be felt in 2019.
– US growth is forecast to slow to 2.4% in 2019 and 1.6% in 2020. Following recent statements from the Fed
we do not expect any further rate hikes. As US fiscal stimulus fades and the economy slows, the Fed is
forecast to cut rates twice in 2020 after ending quantitative tightening in October 2019.
– Eurozone growth is forecast to moderate from 1.8% in 2018 to 1.3% in 2019 as the full effects from the US-
China trade war and Brexit hit European exporters. Inflation is expected to remain under 2%, with higher
energy price inflation in 2018 replaced by higher core inflation in 2019. The ECB has ended QE and is
expected to raise interest rates only twice in 2020. The refinancing rate is forecast to reach 0.50% and the
deposit rate zero by the end of 2020.
– UK growth is likely to slow to 1.1% this year from 1.4% in 2018. Assuming that a Brexit deal with the EU
passes parliament ahead of a transition period that preserves the status quo of single market and customs
union membership, growth is expected to pick up to 1.5% in 2020. Inflation is expected to fall to 1.8% in
2019 thanks to an expected rise in sterling, but stronger growth is expected to push inflation up to 2.4% in
2020. Meanwhile, the BoE is expected to hike once in 2019 and twice in 2020 (to 1.5%).
– Growth in Japan should stay steady in 2019 at 0.7%, however the path of activity should be volatile owing to
the consumption tax hike in October this year. A slow recovery should follow resulting in 0.4% growth in
2020. We do not expect the BoJ to alter yield curve control, but look for rates to rise to 0% at the end of 2020
as inflation picks up.
– Emerging market economies should slow to 4.5% in 2019 after 4.8% in 2018, but pick-up slightly to 4.6% in
2020. We are optimistic that for most of the BRIC economies’ domestic factors can outweigh global
problems in 2020. China benefits from the easing of trade tensions with the US, but against a backdrop of
secular decline the PBoC should continue to ease.
Risks
– Risks are tilted toward deflation with the highest individual risk going on the US recession 2020 scenario
where the economy proves more fragile than expected as fiscal stimulus is withdrawn. There is also a risk
of recession outside the US given the current weakness in Europe.
Chart: World GDP forecast
Contributions to World GDP growth (y/y), %
6 4.8 5.3 5.3 4.9
5.0 Forecast
5 4.0 3.7
4 3.2 3.2 3.2 3.3
2.8 3.0 2.7 3.2 2.8 2.7
3 2.5
2
1
0
-1 -0.6
-2
-3
02 03 04 05 06 07 08 09 10 11 12 13 14 15 16 17 18 19 20
US Europe Japan Rest of advanced BRICS Rest of emerging World
Source: Schroders Economics Group, February 2019. Please note the forecast warning at the back of the document.
Economic and Strategy Viewpoint May 2019 13Schroders Baseline Forecast
Real GDP
y/y% Wt (%) 2018 2019 Prev. Consensus 2020 Prev. Consensus
World 100 3.2 2.8 (2.9) 2.8 2.7 (2.5) 2.8
Advanced* 61.4 2.2 1.8 (1.9) 1.7 1.5 (1.3) 1.6
US 26.5 2.8 2.4 (2.4) 2.4 1.6 (1.3) 2.0
Eurozone 17.2 1.8 1.3 (1.6) 1.1 1.4 (1.2) 1.3
Germany 5.0 1.5 1.0 (1.4) 0.8 1.4 (1.3) 1.5
UK 3.6 1.4 1.1 (1.4) 1.3 1.5 (1.5) 1.5
Japan 6.7 0.7 0.7 (1.0) 0.6 0.4 (0.0) 0.5
Total Emerging** 38.6 4.8 4.5 (4.5) 4.4 4.6 (4.5) 4.6
BRICs 25.3 5.7 5.5 (5.5) 5.5 5.5 (5.4) 5.5
China 16.7 6.6 6.3 (6.2) 6.2 6.1 (6.0) 6.1
Inflation CPI
y/y% Wt (%) 2018 2019 Prev. Consensus 2020 Prev. Consensus
World 100 2.8 2.5 (2.9) 2.4 2.6 (2.7) 2.5
Advanced* 61.4 2.0 1.7 (2.0) 1.5 1.9 (1.9) 1.8
US 26.5 2.4 1.9 (2.7) 1.9 2.3 (2.4) 2.2
Eurozone 17.2 1.7 1.7 (1.6) 1.3 1.5 (1.5) 1.4
Germany 5.0 1.8 1.8 (1.8) 1.5 1.7 (1.7) 1.6
UK 3.6 2.5 1.8 (1.8) 2.0 2.4 (2.1) 2.1
Japan 6.7 1.0 0.5 (0.5) 0.6 1.0 (1.1) 1.0
Total Emerging** 38.6 4.1 3.7 (4.2) 3.9 3.6 (4.0) 3.6
BRICs 25.3 2.6 2.6 (3.3) 2.8 2.8 (3.0) 2.8
China 16.7 2.1 2.0 (2.6) 2.1 2.2 (2.4) 2.1
Interest rates
% (Month of Dec) Current 2018 2019 Prev. Market 2020 Prev. Market
US 2.50 2.50 2.50 (3.00) 2.45 2.00 (2.50) 2.18
UK 0.75 0.75 1.00 (1.25) 0.92 1.50 (1.75) 1.03
Eurozone (Refi) 0.00 0.00 0.00 (0.50) 0.50 (1.00)
-0.31 -0.22
Eurozone (Depo) -0.40 -0.40 -0.40 (0.00) 0.00 (0.50)
Japan -0.10 -0.10 -0.10 (-0.10) 0.03 0.00 (0.00) 0.03
China 4.35 4.35 4.00 (4.00) - 3.50 (3.50) -
Other monetary policy
(Over year or by Dec) Current 2018 2019 Prev. Y/Y(%) 2020 Prev. Y/Y(%)
US QE ($Tn) 4.1 4.0 3.5 (3.4) -12.5% 3.5 (3.1) 0.0%
EZ QE (€Tn) 2.4 2.4 2.4 (2.4) 0.0% 2.4 (2.4) 0.0%
UK QE (£Bn) 435 435 445 (445) 2.3% 445 (445) 0.0%
JP QE (¥Tn) 552 552 575 (572) 4.1% 595 (592) 3.5%
China RRR (%) 14.50 14.50 12.00 12.00 - 10.00 11.00 -
Key variables
FX (Month of Dec) Current 2018 2019 Prev. Y/Y(%) 2020 Prev. Y/Y(%)
USD/GBP 1.29 1.27 1.42 (1.42) 11.5 1.38 (1.38) -2.8
USD/EUR 1.12 1.14 1.17 (1.21) 2.3 1.20 (1.25) 2.6
JPY/USD 111.6 109.7 110 (110) 0.3 108 (108) -1.8
GBP/EUR 0.86 0.90 0.82 (0.85) -8.2 0.87 (0.91) 5.5
RMB/USD 6.74 6.87 6.85 (7.20) -0.2 7.00 (7.40) 2.2
Commodities (over year)
Brent Crude 72.0 71.6 62.7 (71.7) -12.4 62.3 (68.1) -0.7
Source: Schroders, Thomson Datastream, Consensus Economics, April 2019
Consensus inflation numbers for Emerging Markets is for end of period, and is not directly comparable.
Market data as at 26/04/2019
Previous forecast refers to November 2018
* Advanced markets: Australia, Canada, Denmark, Euro area, Israel, Japan, New Zealand, Singapore, Sweden, Switzerland,
United Kingdom, United States.
** Emerging markets: Argentina, Brazil, Chile, Colombia, Mexico, Peru, China, India, Indonesia, Malaysia, Philippines, South Korea,
Taiwan, Thailand, South Africa, Russia, Czech Rep., Hungary, Poland, Romania, Turkey, Ukraine, Bulgaria, Croatia, Latvia, Lithuania.
Economic and Strategy Viewpoint May 2019 14Updated forecast charts – Consensus Economics
For the EM, EM Asia and Pacific ex Japan, growth and inflation forecasts are GDP weighted and calculated using
Consensus Economics forecasts of individual countries.
Chart A: GDP consensus forecasts
2019 2020
% %
7 7
6 EM Asia 6
EM Asia
5 5
EM EM
4 4
3 3
US Pac ex Jap
2 Pac ex Jap 2 US
UK UK
1 Eurozone 1 Eurozone
Japan Japan
0 0
J F MAM J J A S OND J F MAM J J A S OND J F M A M J J A S O N D
2018 2019 2020
Chart B: Inflation consensus forecasts
2019 2020
% %
5 5
4 4
EM EM
3 3
EM Asia
EM Asia US
2 UK 2 UK
US Pac ex Jap
Pac ex Jap
1 1 Eurozone
Eurozone Japan
Japan
0 0
J FMAM J J A S OND J F MAM J J A S OND J F M A M J J A S O N D
2018 2019 2020
Source: Consensus Economics (April 2019), Schroders.
Pacific ex. Japan: Australia, Hong Kong, New Zealand, Singapore.
Emerging Asia: China, India, Indonesia, Malaysia, Philippines, South Korea, Taiwan, Thailand.
Emerging markets: China, India, Indonesia, Malaysia, Philippines, South Korea, Taiwan, Thailand, Argentina, Brazil, Colombia, Chile,
Mexico, Peru, South Africa, Czech Republic, Hungary, Poland, Romania, Russia, Turkey, Ukraine, Bulgaria, Croatia, Estonia,
Latvia, Lithuania.
The forecasts included should not be relied upon, are not guaranteed and are provided only as at the date of issue. Our forecasts are based on our own assumptions
which may change. We accept no responsibility for any errors of fact or opinion and assume no obligation to provide you with any changes to our assumptions or
forecasts. Forecasts and assumptions may be affected by external economic or other factors. The views and opinions contained herein are those of Schroder
Investments Management’s Economics team, and may not necessarily represent views expressed or reflected in other Schroders communications, strategies or
funds. This document does not constitute an offer to sell or any solicitation of any offer to buy securities or any other instrument described in this document. The
information and opinions contained in this document have been obtained from sources we consider to be reliable. No responsibility can be accepted for errors of
fact or opinion. This does not exclude or restrict any duty or liability that Schroders has to its customers under the Financial Services and Markets Act 2000 (as
amended from time to time) or any other regulatory system. Reliance should not be placed on the views and information in the document when taking individual
investment and/or strategic decisions. For your security, communications may be taped or monitored.
Economic and Strategy Viewpoint May 2019 15Schroder Investment Management Limited
1 London Wall Place, London, EC2Y 5AU
Tel: + 44(0) 20 7658 6000
schroders.com
@Schroders
Important information: This document is intended to be for individual investment and/or strategic decisions. Past performance is
information purposes only and it is not intended as promotional not a reliable indicator of future results, prices of shares and income
material in any respect. The material is from them may fall as well as rise and investors may not get back the
not intended as an offer or solicitation for the purchase or sale of any amount originally invested. Schroders has expressed its own views in
financial instrument. The material is not intended to provide, and this document and these may change. Issued by Schroder Investment
should not be relied on Management Limited, 1 London Wall Place, London, EC2Y 5AU, which
for, accounting, legal or tax advice, or investment recommendations. is authorised and regulated by the Financial Conduct Authority. For
Information herein is believed to be reliable but Schroders does not your security, communications may be taped or monitored. EU04102.
warrant its completeness or accuracy. No responsibility can be
accepted for errors of fact or opinion. Reliance should not be placed
on the views and information in the document where takingYou can also read