Effect of exposure to aldehyde C9 (nonanal) on the electroencephalographic activity of humans according to time series analysis
←
→
Page content transcription
If your browser does not render page correctly, please read the page content below
Journal of Applied Pharmaceutical Science Vol. 13(01), pp 076-085, January, 2023
Available online at http://www.japsonline.com
DOI: 10.7324/JAPS.2023.130103
ISSN 2231-3354

Effect of exposure to aldehyde C9 (nonanal) on the
electroencephalographic activity of humans according
to time series analysis

Kandhasamy Sowndhararajan1, Minju Kim2, Songmun Kim2*
1
 Department of Botany, Kongunadu Arts and Science College, Coimbatore, India.
2
 Department of Biological Environment, School of Natural Resources and Environmental Science, Kangwon National University, Chuncheon, South Korea.

    ARTICLE INFO                       ABSTRACT
    Received on: 31/08/2022            Aldehyde C9 (nonanal) is naturally found in various essential oils and is mainly used for rose-like fragrances in perfumery
    Accepted on: 24/11/2022            products. This study aimed to evaluate the effect of exposure to aldehyde C9 odor on the electroencephalographic
    Available Online: 04/01/2023       (EEG) activity of humans in relation to time series analysis. Healthy volunteers, 10 men and 10 women, were used for
                                       the EEG study. The EEG recording was done using eight-channel electrodes. The EEG measurement was conducted
                                       for a total of 30 seconds during the exposure to no odor and C9 odor, and recorded EEG data were examined for every
    Key words:
                                       second. In the results, only absolute mid-beta wave activity significantly changed at the left parietal region (8.8988–
    C9, electroencephalography,
                                       7.7534 μV2) for a total of 30 seconds analysis time. However, exposure to C9 odor produced significant changes in
    fragrance, nonanal, olfaction.
                                       absolute wave activity at specific times during time series analysis except for absolute gamma. Furthermore, C9 odor
                                       affects the prefrontal (Fp1 and Fp2) and frontal (F3 and F4) regions when compared with temporal (T3 and T4) and
                                       parietal (P3 and P4) regions. Based on the results, it could be concluded that C9 odor greatly alters the EEG activity
                                       of humans in terms of analysis time.

INTRODUCTION                                                                        lemongrass, milkweed, citrus, and rose essential oils contain C9
          In perfumery industries, aldehydes have been used                         (Omonov et al., 2014; Otienoburu et al., 2012; Park et al., 2020).
for different fragrance notes. They are mainly derived from                         Nonanal is an important signal volatile of tobacco plants which
natural and anthropogenic sources. A number of aldehydes can                        attracts oviposition in female moths, Helicoverpa assulta (Wang
also be synthesized chemically (O’Brien et al., 2005). In these,                    et al., 2020b). Moreover, nonanal is an important skin odorant of
aldehydes C8–C13 are important bioactive fragrant compounds                         various animals such as birds and mammals in addition to humans
used in various perfumery products (Surburg and Panten, 2005).                      (Haze et al., 2001). Recently, Kim et al. (2019a) found that
Aldehydes are important ingredients in the legendary perfume                        aldehydes, nonanal (C9) and decanal (C10), exhibited markedly
Chanel No. 5 and are mostly perceived as pleasant smells by                         different electroencephalographic (EEG) activity according to
humans. Among them, C9 aldehyde (nonanal) is widely used in                         nostril difference.
perfumery products for its rose-like fragrance. In trace amounts, it                           In aromatherapy, pleasant odors have been used to
adds floral notes to a broad range of fragrance types. Cinnamon,                    improve the psychophysiological functions of humans. Olfaction
                                                                                    and emotion are highly interconnected (Hou et al., 2020). Odors
                                                                                    are abundant in indoor air due to the release from room fresheners,
                                                                                    cleaning solutions, insecticides, cosmetics, and scented candles
                                                                                    (Bartsch et al., 2016; Wolkoff and Nielsen, 2017). In general, it
*Corresponding Author
Songmun Kim, School of Natural Resources and Environmental Science,                 is not easy to generalize that all pleasant odors produce positive
Kangwon National University, Chuncheon, South Korea.                                psychophysiological effects on humans via inhalation. Functional
E-mail: eperfume @ kangwon.ac.kr                                                    changes in the brain induced by odor inhalation are highly linked

© 2023 Kandhasamy Sowndhararajan et al. This is an open access article distributed under the terms of the Creative Commons Attribution 4.0 International License
(https://creativecommons.org/licenses/by/4.0/).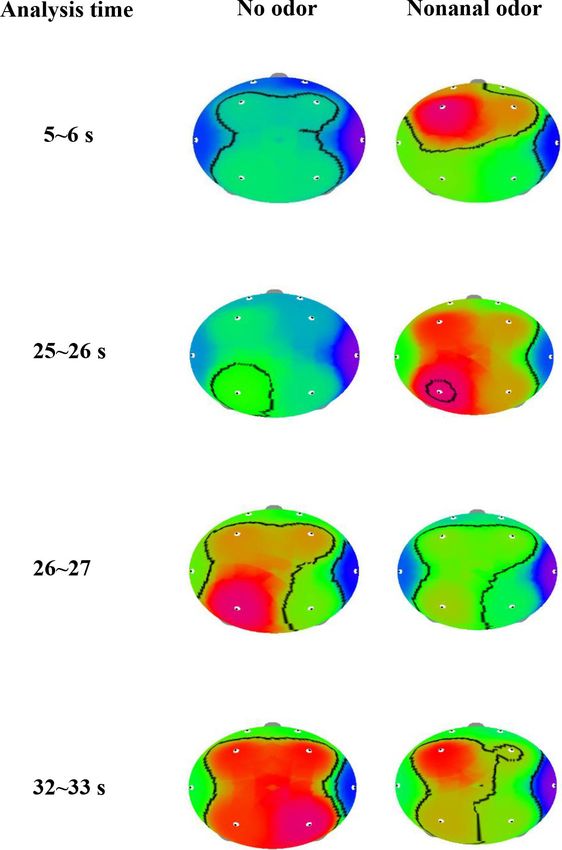
Sowndhararajan et al. / Journal of Applied Pharmaceutical Science 13 (01); 2023: 076-085                         077

to the alteration of electrical activity in neuronal cells through      the experiment. Informed consent was received from all the
the olfactory system. Therefore, it is necessary to figure out the      participants before they participated in the EEG study.
influence of fragrance inhalation on brain functions (Kutlu et al.,
2008).                                                                  Experimental design
           Brain waves, including delta, theta, alpha, beta, and                   A single-group pretest and posttest experimental design
gamma, are considered to have relationships with specific               was used in the study (20 participants). The participants were told
functions of the brain. Brain wave activities are measured using        that the purpose of the study was to evaluate the effect of inhalation
various electrophysiological techniques. Among them, EEG is a           of an odor molecule on EEG activity. During EEG recordings, the
widely used technique to monitor changes in brain wave activity         participants were asked to sit quietly, keep their eyes closed, and
induced by odor inhalation (Iijima et al., 2009; Kim et al., 2018;      breathe normally under awakening conditions.
Sowndhararajan and Kim, 2016). Previous studies have shown
                                                                        EEG recordings and fragrance administration
that the EEG activity of humans is greatly altered during exposure
to odor molecules (Koomhin et al., 2020; MacDonald, 2015). The                     A QEEG-8 system was used to record the EEG readings
EEG technique is a noninvasive approach, and it does not require        (LXE3208, LAXTHA Inc., Daejeon, Republic of Korea). The
the active participation of subjects (Skoric et al., 2015).             EEG data were recorded from eight-channel electrodes according
           In our previous study, aldehyde C9 odor exposure             to the International 10–20 System. The EEG recording conditions
exhibited a significant change only for absolute mid-beta wave          and administration of odor were followed according to the method
                                                                        described previously by Kim et al. (2019b).
activity at the left parietal region (P3) via binasal inhalation
when compared with no odor exposure (Kim et al., 2019a).                Data analysis
However, previous studies have found that the EEG recording
                                                                                   The mean power spectra values were calculated for 25
time for determining the influence of exposure to different
                                                                        EEG indicators, and the values were expressed as microvolts
odors can be varied at every second. In addition, EEG readings
                                                                        squared (μV2) (Seo et al., 2016). We analyzed the EEG data for
have been exhibited to reveal nonstationary behavior in various
                                                                        every second by splitting the total 30 seconds EEG data (from 5
contexts. Hence, it is important to develop a method to analyze         to 35 seconds). SPSS 23 (SPSS, Inc., Chicago, IL) was used for
nonstationary data (Krystal et al., 1999; Sowndhararajan and Kim,       statistical analysis (Kim et al., 2019b).
2016). Recently, Kim et al. (2019b) reported that aldehyde C10
(decanal) odor showed considerable variations in EEG power              RESULTS
spectra values at a specific time interval and found that absolute                 In this study, we investigated the olfactory stimulation
waves significantly decreased during the first 13 seconds period.       effect of exposure to undiluted aldehyde C9 on the EEG activity
Time series analysis is an appropriate method to determine the          of humans. The EEG power spectra changes between no odor
nonstationary behavior of EEG data using evenly spaced time             exposure and C9 odor exposure were examined from eight
intervals to identify an exact pattern in EEG data (Gao et al., 2020;   electrode sites in the prefrontal, frontal, temporal, and parietal
Wang et al., 2020). Therefore, this study aimed to evaluate the         regions. Primarily, EEG power spectrum changes were analyzed
olfactory stimulation influence of aldehyde C9 fragrance on the         between no odor exposure and C9 odor exposure for a total of 30
EEG activity of humans with respect to analysis time.                   seconds, and then we split the EEG data into 30 separate seconds
                                                                        and analyzed changes during no odor and C9 odor for every
MATERIALS AND METHODS                                                   second. In the results, we presented significant changes (p < 0.05)
Materials                                                               in absolute brain wave activity in relation to time series analysis. In
                                                                        a total of 30 seconds of EEG analysis time, a significant decrease
         Nonanal [CH3(CH2)7CHO] (CAS No. 124-19-6) was                  in absolute mid beta (AMB) wave activity at the P3 site was
procured from Sigma (St. Louis, MO).                                    observed due to the exposure to C9 odor (8.8988–7.7534 μV2). The
Subjects                                                                significant change in AMB wave activity due to the exposure to
                                                                        C9 odor is presented in Table 1. Figure 1 shows the topographical
          This study was performed according to the                     mapping of AMB power spectrum change during the exposure to
Declaration of Helsinki on Biomedical Research Involving                C9 odor when compared to that of no odor exposure.
Human Subjects. The Ethical Committee from Kangwon                                 Table 2 shows the significant changes (p < 0.05) of
National University, Chuncheon, Republic of Korea (IRB                  absolute power spectra values between no odor exposure and C9
No. KWNUIRB-2017-05-001-003), approved the EEG study                    odor exposure based on different analysis times. In time series
protocol. A total of 20 healthy volunteers (10 men and 10 women)        analysis, C9 odor exposure exhibited significant changes in all
aged 20–30 years participated in this study. The participants were      absolute waves with the exception of absolute gamma at a specific
selected based on the protocol described by Kim et al. (2019b).         time interval when compared to that of no odor exposure. However,
The selection criteria for participants were being nonsmokers and       no significant change in absolute wave activity was observed
right-handed. In this study, participants with olfactory diseases or    during 6~8, 11~13, 15~16, 18~23, 28~30, and 33~35 seconds
abused drugs were not included. Furthermore, participants who           during the exposure to C9 odor. The absolute power spectra
were unable to distinguish the well-known aroma types were              such as alpha, beta, slow alpha, low beta, and high beta activities
excluded from this study. The participants were not allowed             markedly decreased in the first 6-second period. Significant
to consume alcohol or any medications from 2 days prior to              differences in absolute alpha (AA), absolute slow alpha (ASA),
078 Sowndhararajan et al. / Journal of Applied Pharmaceutical Science 13 (01); 2023: 076-085
Table 1. Significant changes of EEG power spectrum values during no odor and C9 odor exposures in total 30 seconds.
EEG indices Site No odor exposure (µV2) C9 odor exposure (µV2) t-test p value*
AMB P3 8.8988 ± 1.360 7.7534 ± 1.387 2.119 0.047
beta; P3, left parietal.
Number of subjects – 20.
*Significant difference (p < 0.05).
Figure 1. The topographical mapping of AMB activity due to no odor and C9 odor exposure in total 30 seconds
recording time.
and AMB wave activities were observed during different analysis inhalation. On the other hand, absolute fast alpha (AFA)
times (Figs. 2 and 3). significantly increased during 23~24 seconds and decreased during
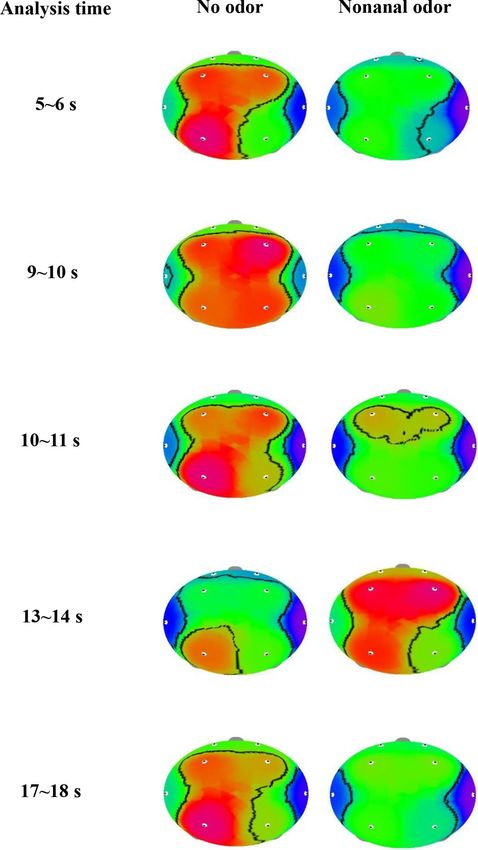
The EEG data analysis revealed that absolute theta 24~26 seconds. In particular, AA wave significantly decreased at
(AT) wave activity significantly increased during 8~9 seconds the Fp1, Fp2, F3, F4, and T4 regions during the period of 5~6
(16.5963–26.6732 μV2 at T3 and 16.0215–27.5788 μV2 at Fp2) seconds. However, no significant change in AA and ASA activity
and 25~26 seconds (19.7777–31.4728 μV2 at F3; 17.3160– was observed during the last 17 seconds of time series analysis
28.1636 μV2 at F4; and 9.3947–14.3709 μV2 at T4) and decreased (Table 2). Furthermore, C9 odor had no effect on absolute gamma
during 26~27 seconds (26.0982–16.7358 μV2 at T3) and 32~33 wave activity. In the EEG time series analysis, significant changes
seconds (17.3059–14.1615 μV2 at T4) during the exposure to C9 were observed in more EEG indicators such as AA, AB, ASA,
odor (Fig. 4). Additionally, significant decreases in absolute beta ALB, and AMB during the first second of analysis time (5~6
(AB), low beta, mid beta, and high beta were observed at certain seconds) than in other periods. Furthermore, the F4 region was
times due to the exposure of C9. AB wave activity significantly highly sensitive to C9 odor, followed by the Fp1, F3, T4, and P3
decreased during 5~6 seconds (P4), 16~17 seconds (Fp1), and regions. According to time series analysis, exposure to C9 odor
27~28 seconds (Fp1, Fp2, F3, P3, and P4), and absolute low beta exhibited nonstationary EEG power spectra activity.
(ALB) wave significantly decreased during 5~6, 14~15, 30~31,
and 31~32 seconds (Figs. 5 and 6). Absolute high beta (AHB) DISCUSSION
also significantly decreased during 27~88 seconds during C9 It is well known that odor molecules affect brain wave
odor inhalation when compared to that of no odor inhalation. activities, thereby producing changes in the psychophysiological
Furthermore, AMB wave activity significantly decreased during functions of humans. Brain wave modifications can be effectively
5~6, 9~10, 16~17, 27~28, and 30~31 seconds. measured by EEG (Angelucci et al., 2014; Ko et al., 2021). In the
A significant decrease in AA and ASA activity was present study, only AMB wave activity significantly changed in
observed at similar analysis times during 5~6, 9~10, and 10~11 the left parietal region during the exposure to C9 odor in a total
seconds and increased during 13~14 seconds. However, AA of 30 seconds analysis time. On the other hand, all absolute wave
significantly increased during 17~18 seconds, while ASA activities significantly changed in different regions at different
significantly decreased at the same period during C9 odor time points due to the exposure to C9 odor. However, no significant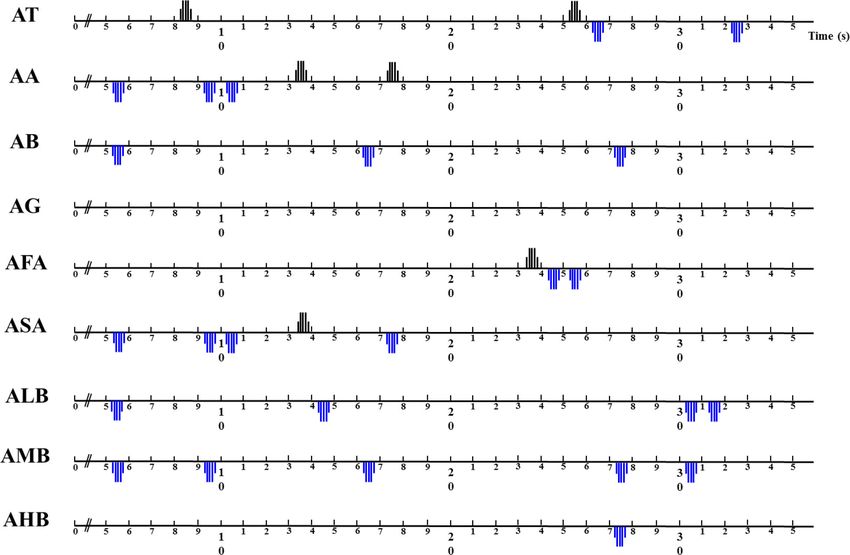
Sowndhararajan et al. / Journal of Applied Pharmaceutical Science 13 (01); 2023: 076-085                             079

   Table 2. Significant changes of EEG power spectrum values at different time series during no odor and C9 odor exposures.
Time            EEG indices          Site       No odor exposure (µV2)      C9 odor exposure (µV2)         t-test         p value*
5~6                 AMB               F4             6.8829 ± 0.816             4.6254 ± 0.810             3.047              0.007
                    ALB               T4             6.9378 ± 1.194             3.7841 ± 0.559             2.987              0.008
                                      P3            18.0956 ± 3.907             8.7671 ± 1.078             2.957              0.008
                                      P4            12.1528 ± 2.530             6.1390 ± 0.685             2.828              0.011
                                      F3            10.5687 ± 1.895             7.0505 ± 1.553             2.719              0.014
                                      F4             9.0428 ± 1.694             6.0722 ± 1.393             2.577              0.018
                    AA                T4            30.4753 ± 5.354             23.0236 ± 4.025            2.809              0.011
                                      F4            75.1153 ± 15.604            55.6016 ± 9.951            2.762              0.012
                                      F3           77.6444 ± 15.964            57.6285 ± 10.614            2.504              0.022
                                     Fp1            59.5069 ± 11.483            45.0147 ± 7.885            2.408              0.026
                                     Fp2            56.9187 ± 11.685            44.2258 ± 7.440            2.201              0.040
                    ASA               T4            26.1319 ± 5.053             20.5602 ± 3.923            2.528              0.020
                                      F4           68.6475 ± 14.851             51.2244 ± 9.325            2.497              0.022
                                      F3           70.2707 ± 15.034             52.5769 ± 9.994            2.218              0.039
                    AB                P4            20.7927 ± 2.211             16.2998 ± 2.450            2.142              0.045
8~9                  AT               T3            16.5963 ± 2.546             26.6732 ± 6.321            −2.317             0.032
                                     Fp2            16.0215 ± 2.385             27.5788 ± 6.460            −2.207             0.040
9~10                AMB               P3            12.3057 ± 2.209             8.8152 ± 1.651             2.343              0.030
                    ASA              Fp2            58.8280 ± 11.266            37.7272 ± 7.353            2.305              0.033
                                      F4           83.3203 ± 16.378            49.6211 ± 10.526            2.789              0.012
                                      T4            38.7050 ± 8.404             20.6957 ± 4.880            3.091              0.006
                    AA               Fp2            62.7258 ± 11.499            41.5667 ± 7.729            2.303              0.033
                                      T4            41.0357 ± 8.492             24.3771 ± 5.393            2.914              0.009
                                      F4           88.1018 ± 16.713            54.1840 ± 10.967            2.811              0.011
10~11               AA                P3           83.3434 ± 16.086            61.8932 ± 14.391            2.641              0.016
                    ASA               P3           76.1023 ± 15.431            55.8227 ± 13.968            2.478              0.023
13~14               AA               Fp1            39.4312 ± 7.289            59.3705 ± 12.356            −2.377             0.028
                                     Fp2            37.4491 ± 7.491            58.2389 ± 12.229            −2.492             0.022
                                      F3            46.1690 ± 8.679            71.9860 ± 15.827            −2.461             0.024
                                      F4            47.0134 ± 9.999            74.9361 ± 18.065            −2.356             0.029
                    ASA              Fp1            35.5323 ± 6.903            54.2947 ± 12.201            −2.268             0.035
                                     Fp2            34.0981 ± 7.160            52.9446 ± 12.060            −2.323             0.031
                                      F3            41.9831 ± 8.387            65.3893 ± 15.413            −2.330             0.031
                                      F4            42.7714 ± 9.466            68.6313 ± 17.456            −2.316             0.032
14~15               ALB               T4             6.4774 ± 1.261             4.3465 ± 0.734             2.300              0.033
16~17               AMB               F4             8.3753 ± 1.068             6.7784 ± 1.074             3.007              0.007
                                     Fp1             8.3211 ± 0.847             6.0057 ± 0.927             2.878              0.010
                    AB               Fp1            20.3180 ± 2.517             16.7795 ± 2.152            2.126              0.047
17~18               ASA               P3           61.4318 ± 12.270            45.3297 ± 11.424            2.406              0.026
                    AA                P3           77.0064 ± 13.422            52.4709 ± 12.374            2.382              0.028
23~24               AFA               T4             4.8621 ± 0.784             7.9614 ± 1.831             −2.100             0.049
24~25               AFA               T3            10.7125 ± 1.681             6.9772 ± 1.235             2.504              0.022
25~26               AFA               F3            18.1766 ± 3.536             10.7904 ± 2.605            2.820              0.011
                     AT               F3            19.7777 ± 2.752             31.4728 ± 5.645            −2.283             0.034
                                      F4            17.3160 ± 2.737             28.1636 ± 4.914            −2.287             0.034
                                      T4             9.3947 ± 1.361             14.3709 ± 3.120            −2.128             0.047
                                                                                                                               Continued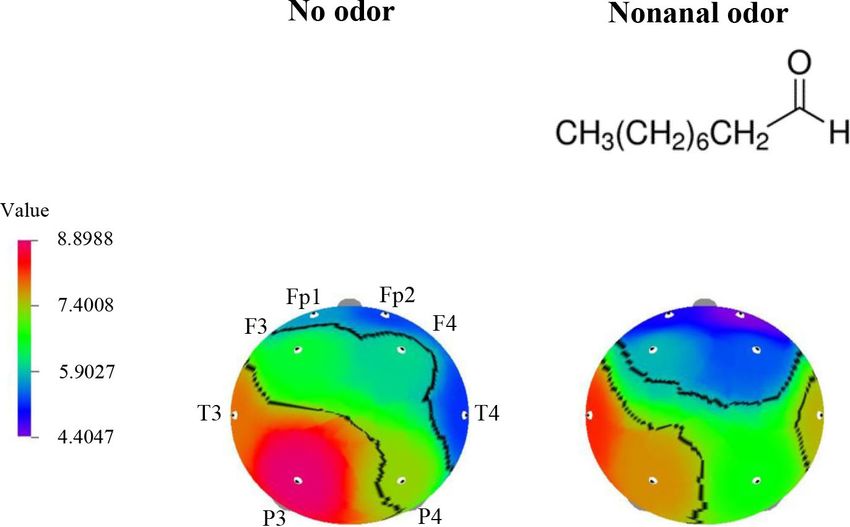
080                             Sowndhararajan et al. / Journal of Applied Pharmaceutical Science 13 (01); 2023: 076-085

          Time                 EEG indices              Site         No odor exposure (µV2)            C9 odor exposure (µV2)                t-test            p value*
         26~27                      AT                  T3                26.0892 ± 5.136                  16.7358 ± 2.557                   2.104              0.049
         27-28                      AB                  Fp1               20.7079 ± 2.673                  14.3626 ± 1.590                   2.789              0.012
                                                        Fp2               18.1651 ± 2.586                  13.3344 ± 1.396                   2.121              0.047
                                                         F3               23.1439 ± 3.385                   16.633 ± 2.330                   2.558              0.019
                                                         P3               31.1584 ± 5.199                  20.0701 ± 3.562                   4.006              0.001
                                                         P4               23.8327 ± 3.266                  16.7633 ± 2.477                   3.014              0.007
                                   AMB                  Fp1                8.5357 ± 1.078                   5.8653 ± 0.889                   2.769              0.012
                                                         F3                9.4970 ± 1.665                   6.7826 ± 1.501                   2.225              0.038
                                                         P3               14.8663 ± 3.439                   9.1289 ± 2.317                   3.319              0.004
                                                         P4               11.2474 ± 2.016                   7.4276 ± 1.807                   2.809              0.011
                                   AHB                   P3               12.2637 ± 1.744                   7.4964 ± 1.075                   3.384              0.003
         30~31                     ALB                  T3                 9.9809 ± 1.868                   5.4615 ± 0.805                   2.575              0.019
                                   AMB                  Fp1                8.3108 ± 1.254                   5.9703 ± 0.794                   2.386              0.028
         31~32                     ALB                  Fp1                9.2405 ± 2.176                   6.4948 ± 1.883                   3.362              0.003
                                                        Fp2                9.1763 ± 2.301                   6.4955 ± 1.740                   2.661              0.015
                                                        T3                 9.1958 ± 1.921                   6.1192 ± 1.782                   2.575              0.019
         32~33                      AT                  T4                17.3059 ± 3.564                  14.1615 ± 2.910                   2.193              0.041

AT, absolute theta; AA, absolute alpha; AB, absolute beta; ASA, absolute slow alpha; AFA, absolute fast alpha; ALB, absolute low beta; AMB, absolute mid beta;
AHB, absolute high beta; Fp1, left prefrontal; Fp2, right prefrontal; F3, left frontal; F4, right frontal; T3, left temporal; T4, right temporal; P3, left parietal; P4, right
parietal.
Number of subjects – 20.
*Significant difference (p < 0.05).

Figure 2. Significant increase and decrease in absolute brain waves due to the inhalation of C9 odor in relation to analysis time.
Sowndhararajan et al. / Journal of Applied Pharmaceutical Science 13 (01); 2023: 076-085 081
Figure 3. Significant changes in AA, AFA, and AMB waves due to the inhalation of C9 odor in
relation to analysis time.
change in AG wave activity was observed during the exposure to brain waves (Fig. 3). In general, the neuronal electrical activity
C9 odor (Table 2). of the brain produces time-dependent potential alterations on the
The results revealed that the changes mainly occurred in scalp. Masago et al. (2000) found that lavender, eugenol, and
AA, ASA, and AMB wave activities when compared with other chamomile odors produced a significant decrease in alpha 1 wave082 Sowndhararajan et al. / Journal of Applied Pharmaceutical Science 13 (01); 2023: 076-085
A functional magnetic resonance image study demonstrated that
the time course to activate the human primary olfactory cortex
induced by odor molecules is 30~40 seconds (Sobel et al., 2000).
In addition, Boesveldt et al. (2009) used a time series approach for
magnetoencephalography data to detect olfactory dysfunction in
patients with Parkinson’s disease and healthy individuals.
Among different brain waves, alpha and beta waves
play a vital role in cognitive performance in humans. According
to previous studies, a significant decrease in the alpha wave was
observed during emotional tension and stress states and a significant
increase was noticed during relaxation as well as calmness states
of the brain (Iijima et al., 2009; Lorig and Schwartz, 1988;
Sayorwan et al., 2012). The data of the present study indicated
that AA waves (AA and ASA) decreased due to the exposure to C9
odor. However, the AA wave markedly increased during 13~14
and 17~18 seconds. However, the change in AA, ASA, and AFA
waves was not persistent during time series analysis. Beta waves
such as AB, ALB, AMB, and AHB significantly decreased at
different time points during time series analysis. It is well known
that beta wave activity is attenuated under the drowsiness state
and increases under the awareness and concentration states of the
brain (Lee et al., 2014). According to time series analysis results,
reduction in beta wave activity due to C9 odor inhalation may
connect with the drowsiness state of the brain.
In addition, absolute theta wave activity increased during
8~9 and 25~26 seconds and decreased during 26~27 and 32~33
seconds due to the exposure to C9 odor. Previous studies suggest
that the decrease in theta wave activity is highly linked with
memory formation (Greenberg et al., 2015; Razumnikova, 2007;
Sowndhararajan and Kim, 2016). However, AT wave activity was
not persistent during the exposure to C9 odor. The findings of this
study suggest that C9 odor produced alterations in different brain
waves at different brain sites based on time series analysis. From
the results, we cannot predict the accurate action of C9 odor on
Figure 4. The topographical mapping of AT activity due to the inhalation of C9 brain function due to the unstable EEG signals during time series
odor in relation to analysis time.
analysis.
Time series analysis of EEG signals also allows the
activity during the first 10-second period of odor inhalation. The measurement of durations and order of activation of each brain
authors found that the significant decrease in alpha 1 activity was region (Jung et al., 2006). In this study, the results suggest that
observed during the exposure to lavender, eugenol, and chamomile the inhalation of C9 odor highly affected the frontal and prefrontal
aromas in which subjects felt comfortable. The significant regions when compared with the temporal and parietal regions.
decrease was stable only due to the inhalation of lavender odor, Particularly, C9 odor mainly affects the F4 region of the brain,
but the decrease was unstable during the inhalation of other kinds followed by the F3, Fp1, T4, and P3 regions. The prefrontal and
of odors. Previously, some researchers used the time-frequency frontal sites are important functional areas in the cerebral cortex
analysis approach to evaluate EEG signals in regard to the time of the brain. The prefrontal and frontal regions are involved in
as well as frequency domains simultaneously. Huart et al. (2013) various cognitive functions, such as decision-making skills,
used time-frequency analysis of EEG signals to evaluate olfactory problem-solving, language, memory, attention, and movements
functions in patients. Time-frequency analysis was also used to (Collins and Koechlin, 2012; Sowndhararajan and Kim, 2016).
study EEG power spectra change induced by olfactory stimuli, Furthermore, Grabenhorst et al. (2007) stated that the medial
phenyl ethyl alcohol, and eucalyptol, and this approach reliably orbitofrontal cortex region of the brain is mainly activated by odors
discriminates patients with olfactory impairments from healthy with a pleasant smell. In olfaction, the odor molecules present in
subjects (Schriever et al., 2017). A recent study showed that the air reach the primary olfactory cortex via olfactory receptor
absolute waves markedly decreased in the first 13-second period cells and the olfactory bulb (Simoes de Souza and Antunes, 2007).
due to the exposure to C10 odor. Later, AA, ASA, and AFA wave Primary olfactory regions, such as the piriform cortex, amygdala,
activities significantly increased. In addition, the odor inhalation and neighboring cortex, are mainly activated by the stimulation
of C10 mainly showed changes especially in the left frontal site of odor molecules through the transmission between inhaling and
(F3) when compared to that of other sites (Kim et al., 2019b). odor molecules (Billot et al., 2011; Sobel et al., 2000).Sowndhararajan et al. / Journal of Applied Pharmaceutical Science 13 (01); 2023: 076-085 083 Figure 5. Significant changes in ALB, AT, and AB waves due to the inhalation of C9 odor in relation to analysis time.
084                         Sowndhararajan et al. / Journal of Applied Pharmaceutical Science 13 (01); 2023: 076-085

                                                                            CONCLUSION
                                                                                      The results revealed that the EEG activity of C9 odor
                                                                            exposure in a total of 30 seconds analysis time is completely
                                                                            different from time series analysis. In time series analysis,
                                                                            AB waves markedly decreased during C9 odor exposure, and
                                                                            these changes may reduce the alertness state of the brain. In
                                                                            aromatherapy, aldehyde C9 may be used for managing cognitive
                                                                            activities after fixing the appropriate dosage. In addition, this
                                                                            study demonstrates that there was no trend in the EEG activity of
                                                                            C9 odor during time series analysis. Hence, further investigations
                                                                            are needed in association with slightly longer EEG recording time
                                                                            along with time series analysis.

                                                                            AUTHORS’ CONTRIBUTION
                                                                                      All authors made substantial contributions to conception
                                                                            and design, acquisition of data, or analysis and interpretation of
                                                                            data; took part in drafting the article or revising it critically for
                                                                            important intellectual content; agreed to submit to the current
                                                                            journal; gave final approval of the version to be published; and
                                                                            agree to be accountable for all aspects of the work. All the authors
                                                                            are eligible to be authors as per the International Committee of
                                                                            Medical Journal Editors (ICMJE) requirements/guidelines.

                                                                            CONFLICTS OF INTEREST
 Figure 6. The topographical mapping of AB activity due to the inhalation              The authors report no financial or other conflicts of
 of C9 odor in relation to analysis time.                                   interest in this work.

                                                                            FUNDING
                                                                                  There is no funding to report.

                                                                            ETHICAL APPROVAL
                                                                                     The study protocol was approved by the Ethical
                                                                            Committee from Kangwon National University, Chuncheon,
                                                                            Republic of Korea (IRB No. KWNUIRB-2017-05-001-003).

                                                                            DATA AVAILABILITY
                                                                                     The data presented in this study are available within the
                                                                            article.

                                                                            PUBLISHER’S NOTE
                                                                                      This journal remains neutral with regard to jurisdictional
                                                                            claims in published institutional affiliation.

                                                                            REFERENCES
                                                                                        Angelucci FL, Silva VV, Dal Pizzol C, Spir LG, Praes CE,
                                                                            Maibach H. Physiological effect of olfactory stimuli inhalation in humans:
                                                                            An overview. Int J Cosmet Sci, 2014; 36:117–23.
                                                                                        Bartsch J, Uhde E, Salthammer T. Analysis of odour compounds
                                                                            from scented consumer products using chromatography-mass spectrometry
                                                                            and gas chromatography-olfactometry. Anal Chim Acta, 2016; 904:98–106.
                                                                                        Billot PE, Comte A, Galliot E, Andrieu P, Bonnans V, Tatu, L,
                                                                            Gharbi T, Moulin T, Millot JL. Time course of odorant- and trigeminal-
                                                                            induced activation in the human brain: an event-related functional magnetic
                                                                            resonance imaging study. Neuroscience, 2011; 189:370–6.
                                                                                        Boesveldt S, Stam CJ, Knol DL, Verbunt JP, Berendse HW.
                                                                            Advanced time-series analysis of MEG data as a method to explore
                                                                            olfactory function in healthy controls and Parkinson’s disease patients. Hum
                                                                            Brain Mapp, 2009; 30:3020–30.
                                                                                        Collins A, Koechlin E. Reasoning, learning, and creativity:
                                                                            frontal lobe function and human decision-making. PLoS Biol, 2012;
                                                                            10:e1001293.
                                                                                        Gao Y, Zhao Z, Chen Y, Mahara G, Huang J, Lin Z, Zhang J.
      Figure 7. The topographical mapping of AA activity due to the         Automatic epileptic seizure classification in multichannel EEG time series
      inhalation of C9 odor in relation to analysis time.                   with linear discriminant analysis. Technol Health Care, 2020; 28:23–33.
Sowndhararajan et al. / Journal of Applied Pharmaceutical Science 13 (01); 2023: 076-085 085
Grabenhorst F, Rolls ET, Margot C, da Silva MA, Velazco MI. Park S, Kang W, Choi D, Son B, Park T. Nonanal stimulates
How pleasant and unpleasant stimuli combine in different brain regions: growth factors via cyclic adenosine monophosphate (cAMP) signaling in
odor mixtures. J Neurosci, 2007; 27:13532–40. human hair follicle dermal papilla cells. Int J Mol Sci, 2020; 2:8054.
Greenberg JA, Burke JF, Haque R, Kahana MJ, Zaghloul Razumnikova OM. Creativity related cortex activity in the
KA. Decreases in theta and increases in high frequency activity underlie remote associates task. Brain Res Bull, 2007; 73:96–102.
associative memory encoding. NeuroImage, 2015; 114:257–63. Sayorwan W, Siripornpanich V, Piriyapunyaporn T,
Haze S, Gozu Y, Nakamura S, Kohno Y, Sawano K, Ohta H, Hongratanaworakit T, Kotchabhakdi N, Ruangrungsi N. The effects of
Yamazakiet K. 2-Nonenal newly found in human body vodor tends to lavender oil inhalation on emotional states, autonomic nervous system, and
increase with aging. J Invest Dermatol, 2001; 116:520–4. brain electrical activity. J Med Assoc Thai, 2012; 95:598–606.
Hou HR, Zhang XN, Meng QH. Odor-induced emotion Schriever VA, Han P, Weise S, Hösel F, Pellegrino R, Hummel
recognition based on average frequency band division of EEG signals. J T. Time frequency analysis of olfactory induced EEG-power change. PLoS
Neurosci Methods, 2020; 334:108599. One, 2017; 12:e0185596.
Huart C, Rombaux P, Hummel T, Mouraux A. Clinical usefulness Seo M, Sowndhararajan K, Kim S. Influence of binasal
and feasibility of time-frequency analysis of chemosensory event-related and uninasal inhalations of essential oil of Abies koreana twigs on
potentials. Rhinology, 2013; 51:210–21. electroencephalographic activity of human. Behav Neurol, 2016;
Iijima M, Osawa M, Nishitani N, Iwata M. Effects of incense on 2016:9250935.
brain function: Evaluation using electroencephalograms and event–related Simoes de Souza FM, Antunes G. Biophysics of olfaction. Rep
potentials. Neuropsychobiology, 2009; 59:80–6. Prog Phy, 2007; 70:451–91.
Jung J, Hudry J, Ryvlin P, Royet JP, Bertrand O, Lachaux JP. Skoric MK, Ivan Adamec I, Jerbic AB, Gabelic T, Hajnšek S,
Functional significance of olfactory-induced oscillations in the human Habek M. Electroencephalographic response to different odors in healthy
amygdala. Cereb Cortex, 2006; 16:1–8. individuals: a promising tool for objective assessment of olfactory disorders.
Kim M, Sowndhararajan K, Park SJ, Kim S. Effect of inhalation of Clin EEG Neurosci, 2015; 46:370–6.
isomers, (+)-α-pinene and (+)-β-pinene on human electroencephalographic Sobel N, Prabhakaran V, Zhao Z, Desmond JE, Glover GH,
activity according to gender difference. Eur J Integr Med, 2018; 17:33–9. Sullivan EV, Gabrieli JD. Time course of odorant-induced activation in the
Kim M, Sowndhararajan K, Choi HJ, Park SJ, Kim S. human primary olfactory cortex. J Neurophysiol, 2000; 83:537–51.
Olfactory stimulation effect of aldehydes, nonanal, and decanal on the Sowndhararajan K, Kim S. Influence of fragrances on
human electroencephalographic activity, according to nostril variation. human psychophysiological activity: with special reference to human
Biomedicines, 2019a; 7:57. electroencephalographic response. Sci Pharm, 2016; 84:724–51.
Kim M, Nishi K, Sowndhararajan K, Kim S. A time series Surburg H, Panten J. 2005. Common fragrance and flavor
analysis to investigate the effect of inhalation of aldehyde C10 on the materials, preparation, properties and uses, 5th edition, Weinheim,
human EEG activity. Eur J Integr Med, 2019b; 25:20–7. Germany: Wiley-VCH.
Ko LW, Su CH, Yang MH, Liu SY, Su TP. A pilot study on Wang C, Li G, Miao C, Zhao M, Wang B, Guo X. Nonanal
essential oil aroma stimulation for enhancing slow-wave EEG in sleeping modulates oviposition preference in female Helicoverpa assulta
brain. Sci Rep, 2021; 11:1078. (Lepidoptera: Noctuidae) via the activation of peripheral neurons. Pest
Koomhin P, Sattayakhom A, Chandharakool S, Sinlapasorn J, Manag Sci, 2020a; 76:3159–67.
Suanjan S, Palipoch S, Na-ek P, Punsawad C, Matan N. Michelia essential Wang C, Zhu M, Wang X, Wang X, Zhang H, Deng H, Cui H,
oil inhalation increases fast alpha wave activity. Sci Pharm, 2020; 88:23. Chen S, Li G. Time-frequency analysis of electroencephalogram signals in
Krystal AD, Prado R, West M. New methods of time series a cognitive decision-making task. Annu Int Conf IEEE Eng Med Biol Soc,
analysis of non-stationary EEG data: eigenstructure decompositions of time 2020b; 2020:3469–72.
varying autoregressions. Clin Neurophysiol, 1999; 110:2197–206. Wolkoff P, Nielsen GD. Effects by inhalation of abundant
Kutlu AK, Yilmaz E, Cecen D. Effects of aroma inhalation on fragrances in indoor air - an overview. Environ Int, 2017; 101:96–107.
examination anxiety. Teach Learn Nursing, 2008; 3:125–30.
Lee BG, Lee BL, Chung WY. Mobile healthcare for automatic
driving sleep-onset detection using wavelet-based EEG and respiration
signals. Sensors, 2014; 14:17915–36.
Lorig TS, Schwartz GE. Brain and odor: I. Alteration of human
EEG by odor administration. Psychobiology, 1988; 16:281–4.
MacDonald DB. 2015. Electroencephalography: basic principles
and applications. In: Wright, JD (ed.). International encyclopedia of the
social & behavioral sciences, 2nd edition, Amsterdam, Netherlands:
Elsevier, pp 353–63.
Masago R, Matsuda T, Kikuchi Y, Miyazaki Y, Iwanaga K,
Harada H, Katsuura T. Effects of inhalation of essential oils on EEG activity
and sensory evaluation. J Physiol Anthropol, 2000; 19:35–42.
O’Brien PJ, Siraki AG, Shangari N. Aldehyde sources,
metabolism, molecular toxicity mechanisms, and possible effects on human How to cite this article:
health. Crit Rev Toxicol, 2005; 35:609–62. Sowndhararajan K, Minju Kim M, Kim S. Effect of exposure
Omonov TS, Kharraz E, Foley P, Curtis JM. The production of to aldehyde C9 (nonanal) on the electroencephalographic
biobased nonanal by ozonolysis of fatty acids. RSC Adv, 2014; 4:53617.
activity of humans according to time series analysis. J Appl
Otienoburu PE, Ebrahimi B, Phelan PL, Foster WA. Analysis
and optimization of a synthetic milkweed floral attractant for mosquitoes. J Pharm Sci, 2023; 13(01):076–085.
Chem Ecol, 2012; 38:873–81.You can also read