Twitter Based Sentimental Analysis of Impact of COVID-19 on Economy using Naïve Bayes Classifier
←
→
Page content transcription
If your browser does not render page correctly, please read the page content below
Brindavana Sachidanand, Yuanyuan Jiang & Ahmad Hadaegh

  Twitter Based Sentimental Analysis of Impact of COVID-19 on
             Economy using Naïve Bayes Classifier

Brindavana Sachidanand                                                      sachi002@cougars.csusm.edu
Computer Science and Information System
California State University San Marcos
San Marcos, 92096, USA

Yuanyuan Jiang                                                                           yjiang@csusm.edu
Computer Science and Information System
California State University San Marcos
San Marcos, 92096, USA

Ahmad Hadaegh                                                                        ahadaegh@csusm.edu
Computer Science and Information System
California State University San Marcos
San Marcos, 92096, USA

                                                  Abstract

COVID-19 outbreak brought unprecedented changes to people’s lives and made significant
impact on the US and world economy. It wrought havoc on livelihood, businesses and ultimately
the economy. Understanding how the sentiment on economy is changing and main factors that
drives the change will help the public to make sense of the impact and generating relief
measures. In this paper we present a novel Naïve Bayes model using a word-based training
approach to perform the analysis and determine the sentiment of Twitter posts. The novelty of
this methodology is that we use labelled set of words to classify the tweets to perform sentimental
analysis as opposed to the more expensive methods of manually classifying the tweets. We then
perform analysis on the resulting labelled tweets to observe the trend of economy from February
2020 to July 2020 and determine how COVID-19 impacted the economy based on what people
posted on Twitter. We found our data was largely inclined towards negative sentiment indicating
that the economy had been largely negatively impacted as a result of COVID-19. Further, we
correlate the sentiment with the stock market index aka Dow Jones Industrial Average (DJIA)
because stock market movement closely mirrors the economic sentiment and is shown as one of
the main factors influencing people's attitude change from our sentimental analysis. We found
strong correlation between the two, indicating stock market change is one of the driving factors
behind people's opinion change about economy during pandemic. This work proposed and tested
a generic lower-cost text-based model to analysis generic public’s opinion about an event which
can be adopted to analyze other topics.

Keywords: Sentimental Analysis, Naïve Bayes Classifier, COVID-19, Economy, Stock Market
Index.

1. INTRODUCTION
COVID-19 (Corona Virus Disease ’19) outbreak is unprecedented in human history and has
disturbed the day-to-day life in different ways [1]. As a result of the pandemic, supply chain and
people's economic behavior has deeply been affected. Manufacturing, transport, imports, and
exports are greatly affected which posts impact to the economy [2]. People's lives and economic
behavior are drastically different from pre-pandemic time as well. We are interested in studying
how general public's opinion about the economy change during the pandemic and the main
influential factors behind the change. By studying this topic, we can observe the extent to which

International Journal of Artificial Intelligence and Expert Systems (IJAE), Volume (10) : Issue (2) : 2021   33
ISSN: 2180-124X, https://www.cscjournals.org/journals/IJAE/description.php
Brindavana Sachidanand, Yuanyuan Jiang & Ahmad Hadaegh

the economy has been impacted due to the pandemic from the general public's perspective,
make meaningful observations and analysis which can help shine light on people's opinion about
economic change and the main driving factors behind.

Though different techniques and data can be used to study the economy change, for example,
unemployment rate, industrial production, etc. We are primarily interested in studying how it
impacted personal lives. Twitter seems to be most reliable source to get the data [3], since Twitter
reflects the sentiments of common people in day-to-day life and their views on various issues,
whereas newspapers, news channels, magazines, etc. are the viewpoints of the journalists.
Through Twitter we have access to analytics using which views can be statistically analyzed.
Thus, collecting the data from Twitter is an effective and commonly used approach. So far, the
existing works make use of already labelled tweets to perform training and get the sentiments [4].
Labelled tweets refer to the classified tweets i.e., tweets along with their sentiment. Manually
labelling large amount of tweets can be very resource intensive.

In this paper, we present a novel methodology to train data based on the labelled set of words
i.e., word-based training to classify the tweets to perform sentimental analysis instead of the more
expensive method of manually classifying the tweets. Once this model is built, it can be used on
any text data to perform sentimental analysis. In this approach, we use Twitter data as an
example to showcase our model and study the impact of COVID-19 through sentimental analysis.
This paper focuses on public sentiment by collecting the tweets having keywords like ‘economy’,
‘stock market’ and ‘GDP’ since the pandemic started.

In section 2, we outline the background work and also discuss the related work in detail. We have
collected tweets from February 2020 to July 2020 and trained our model using Naïve Bayes
classifier and further used the classifier to perform Sentimental Analysis [5]. The classifier training
is based on the set of positive words and negative words [6]. Once the model is trained, we use
the trained classifier to calculate positive and negative probability of a tweet and accordingly
classify the tweet as positive, negative, or neutral. This is explained in detail under section 3.
After determining sentiments for every tweet, we observe and analyze the obtained results to
understand the impact of COVID-19 on economy and people's opinion change. From the results,
we found stock market change seems to be one of the main factors driving people's opinion
change about the economy. We also study the correlation of the inferred sentiment with the stock
market index i.e., Five-day moving Dow Jones Industrial Average (FDJIA) [7] because it is
generally believed that the stock market is a reflection of the current state of economy and the
movement of stock market captures the movement of economic sentiment. This is explained in
detail under section 4. Lastly, we conclude our work in section 5.

2. BACKGROUND AND RELATED WORKS
Social Media has become an extension of who we are, all that we post on social media is related
to our feelings and our opinions about a particular matter in hand [8]. It is a place where large
amount of data gets generated continuously. Twitter is one of the popular social media platforms
where people are open to share their thoughts and concerns about any ongoing affairs, matters
or crisis [1]. It is a rich source of information that would make a path for the analysis of social
phenomena and its related sentiment [3]. Twitter data is the best source to do sentimental
analysis (mainly categorized as positive, negative and neutral) on COVID-19’s impact on
Economy. Analyzing the tweets gives us insights into user’s expressions, opinions and attitude
[5].

Traditional approach to estimate sentiments involves training on already labelled data. This
training is further used on the actual tweets to infer the sentiments. Whereas, in this work we

International Journal of Artificial Intelligence and Expert Systems (IJAE), Volume (10) : Issue (2) : 2021   34
ISSN: 2180-124X, https://www.cscjournals.org/journals/IJAE/description.php
Brindavana Sachidanand, Yuanyuan Jiang & Ahmad Hadaegh

propose a novel approach of word-based training where we use certain key words to determine
the sentiments of the tweets. We use a set of positive words and negative words, combine them,
and use them as training data for the Naïve Bayes model. Once the model is trained, we obtain a
trained classifier to get the sentiment of a tweet. We do not use already labelled tweets which is a
very labor intensive approach. Instead, we make use of labelled words to label the tweets using
Naïve Bayes approach. This is a novel approach which is intuitively modular and yields good
accuracy as demonstrated by the testing results.

There is some earlier work done on Twitter sentimental analysis using Naïve Bayes approach. In
one approach, tweets that are already labelled as positive or negative are taken as the training
set [9]. Number of positive words and negative words are counted for each set. If a word exists in
only the positive set, the word has positive weight. If a word exists in only the negative set, the
word has negative weight. Otherwise, if a word exists in both sets, it has both positive and
negative weight [9]. In another method, the weights are modified using the average of weight
differences [9].

COVID-19 impact on economy has been discussed in other works. In A. Atkeson ‘s work [10], a
SIR Markov model is built wherein the population is divided into 3 categories: susceptible to
disease (S), actively infected with disease (I) and recovered (R) [10]. Importance is given when
the fraction of active infections in the population exceeds 10% which can result in poor economic
condition and cumulative impact of the disease over an 18-month horizon. Through this, they
draw conclusions of the impact of COVID-19 on economy to be adverse and suggest that
mitigation measures are needed.

B. Le and H. Nguyen used SVM and Naïve Bayes classifiers to categorize tweets into positive or
negative [11]. They achieved an accuracy of 80.00% using Naïve Bayes approach and 78.08%
using SVM approach. Bishwo Prakash Pokharel used TextBlob library of Python to classify
tweets into positive and negative [12].

A Agarwal et al [13] Performed Sentimental Analysis of Twitter data using the POS-specific prior
polarity features and a tree kernel. They demonstrated that tree kernel and feature-based
approach outperform the unigram baseline using SVM. They achieved an accuracy of 75.39%.

Classifiers like Naïve Bayes, Maximum Entropy, and Support Vector Machines were used to
classify the tweets as positive and negative by A. Go, L. Huang and R. Bhayani [14]. They use
tweets with emoticons for distant supervised learning. The accuracy achieved in the case of
Naïve Bayes classification was 81.30%.

COVID-19 has sparked interest in analysis of the impact through Twitter and sentiment analysis.
KH Manguri et al measured how COVID-19 was trending on Twitter [15], Sakun Boon-Itt et al
discovered the top three concerns related to COVID-19 on Twitter through sentiment analysis
[16]. Kalifer Garcia et al did sentiment analysis on COVID-19 related tweets and concluded that
the sentiment was largely negative [17]. Usman Naseem et al did Twitter based sentiment
analysis on COVID-19 related tweets in early stages of pandemic and concluded that the
sentiments were negative [18]. V. Senthil et al. used Twitter sentiment analysis to study the
impact of COVID-19 on travel industry [19].

Table 1 shows how our work is different from the already existing work based on two features -
training and impact of COVID-19 on economy. This table shows the novelty of our work.

International Journal of Artificial Intelligence and Expert Systems (IJAE), Volume (10) : Issue (2) : 2021   35
ISSN: 2180-124X, https://www.cscjournals.org/journals/IJAE/description.php
Brindavana Sachidanand, Yuanyuan Jiang & Ahmad Hadaegh

Feature                              Existing Work                       Our Work
Training                             In most cases, the tweets           Instead of using the manually
                                     are      already  labelled.         labelled tweets, we rather use
                                     Training and testing are            labelled words (words labelled as
                                     done on the model based             positive or negative), and the
                                     on these training and               training and testing are based on
                                     testing sets [4].                   set of positive words and negative
                                                                         words (word-based training). We
                                                                         then predict the sentiment of a
                                                                         tweet based on the resultant
                                                                         trained classifier.
Showcasing impact of COVID-          Many theoretical surveys            No direct analysis of economy
19 on economy                        were done on the impact of          using     computational   methods
                                     COVID-19 on economy                 exists in existing work so far. We
                                     [10].                               have used Naïve Bayes Classifier
                                     There are also few models           approach on tweets to do
                                     like SIR Markov Model that          sentimental analysis by collecting
                                     are used to relate the              tweets related to COVID-19 and
                                     number of increasing active         economy and further corelating the
                                     COVID-19      cases      to         sentiments with stock market index
                                     economic impact [11].
                         TABLE 1: Differences between existing work and our work.

3. METHODOLOGY
The entire implementation is done using Python 3., we collect the data from Twitter which is one
of the most popular social media platform where people express their views. There are other
social media platforms like Facebook, LinkedIn, Reddit exist, and it might be possible to collect
data and perform similar sentimental analysis through other platforms if the data is text based and
can be cleaned into similar format. But Twitter is the most suitable platform for our purpose since
tweets are mostly text based with large number of active users expressing personal views in real
time. We train our model using Naïve Bayes classifier and further use the classifier to perform
Sentimental Analysis [6]. The Python libraries we use are nltk’s NaiveBayesClassifier (to train the
model), re (to clean the tweets), matplotlib (to plot graphs), WordCloud (to draw a word cloud
having most frequently used words), pandas (to create a data frame), LangDetect (to fetch only
English tweets). We start by collecting tweets related to economy, clean the tweets, and tokenize
them. Rather than manually labelling the tweets as positive or negative, we use a novel approach
using word level labelling. In this approach, we have a set of positive words and negative words
stored in separate files. We store the list of words in a list where each word is stored along with
the sentiment as positive or negative. The tweets whose sentiment need to be predicted are
tokenized since the trained data set (the set of positive and negative words) is in tokenized form.
Then, we train our model using Naïve Bayes classifier on the word set that was obtained from the
set of positive words and negative words. Once the model is trained, we use the trained classifier
to calculate positive and negative probability of a tweet and accordingly classify the tweet as
positive or negative. We also have neutral tweets, that will be explained in detail under Step 9 of
section 3.4. After determining sentiment for every tweet, we observe the results, and do the
analyses on how the tweets’ sentiments vary from month to month and correlate the percentages
of positive and negative tweets with Dow Jones Industrial Average (DJIA) to observe how the
stock market index correlates to the sentiment of tweets. The details are explained in section 4.
Figure 1 shows the steps involved in our approach.

International Journal of Artificial Intelligence and Expert Systems (IJAE), Volume (10) : Issue (2) : 2021   36
ISSN: 2180-124X, https://www.cscjournals.org/journals/IJAE/description.php
Brindavana Sachidanand, Yuanyuan Jiang & Ahmad Hadaegh
FIGURE 1: Steps involved in the approach.
3.1 Data Collection
Initially, we started collecting tweets using “Tweepy” streaming API. But since February 1, 2018,
we cannot access tweets that are older than 7 days. So, we used GOT3 API (Get Old Tweets).
GOT3 is a GitHub repository which uses “URLlib” for fetching tweets from Twitter's advance
search. We used the search queries as ‘economy’, ‘stock market’, ‘GDP’, ‘unemployment’ and
‘business shutting’ to collect the tweets. We collected about 2000 tweets per day and tweets
range from February 2020 to July 2020. We focused on collecting tweets for 8 days in every
month. We randomly selected some days from every month i.e., mostly weekends because users
tweet the most during weekends in their down time. In total, we collected tweets for 48 days i.e., 6
months multiplied by 8 days, so approximately there were around 100,000 total tweets collected.
International Journal of Artificial Intelligence and Expert Systems (IJAE), Volume (10) : Issue (2) : 2021 37
ISSN: 2180-124X, https://www.cscjournals.org/journals/IJAE/description.phpBrindavana Sachidanand, Yuanyuan Jiang & Ahmad Hadaegh
Each day’s tweets are stored in a separate folder. We fetched only English tweets using
“langdetect” library from Python and setting language to ‘en’. Example 1 shows an instance of a
collected raw tweet.
Example 1: "@SenatorWong so good to see that the Libs have an extra $60 billion to put back
into the economy. Rather than be at a loss? The Libs have managed COVID exceptionally well.
Labor are trying to find fault. Won’t work. Labour lack finesse and ability to even build wealth."
3.2 Data Cleaning
Once data is collected, we created data frame for the tweets using “Pandas” library of Python.
Next step in the process is to clean the tweets. Example 2 shows an instance of a cleaned tweet.
Tweets are cleaned using regular expressions in Python that are available through the “re” library.
The usernames, hashtags, and links were removed as these were unnecessary tokens while
analyzing a tweet. Usernames and links are unnecessary to determine the sentiment of a tweet
and hence we remove them. Hashtags helps expressing the meaning or theme of a tweet. But
they may not always be useful for determining the sentiment of a tweet since not every tweet
uses them and the Hashtags might not cover the entire meaning of the message. Thus, they are
removed during data cleaning.
Example 2: "so good to see that the Libs have an extra $60 billion to put back into the economy
Rather than be at a loss The Libs have managed COVID exceptionally well Labor are trying to
find fault Won’t work Labour lack finesse and ability to even build wealth."
3.3 Data Tokenization
Cleaned tweets are passed to a tokenize function to remove stop words, punctuations and finally
tokenize every tweet. The result of a tokenized tweets is the list of all the tokens appearing in
each tweet separated by commas. Example 3 shows an instance of a tokenized tweet. It is
necessary to get each word in a tweet as a token because in the training step we would be
training on a set of positive and negative words (or tokens), and then apply the tokenized tweets
on the trained classifier.
Example 3: "['good', 'see', 'libs', 'extra', '60', 'billion', 'put', 'back', 'economy', 'rather', 'loss', 'libs',
'managed', 'covid', 'exceptionally', 'well', 'labour', 'trying', 'find', 'fault', 'work', 'labour', 'lack',
'finesse', 'ability', 'even', 'build', 'wealth']"
3.4 Training (For labelling the tweets)
We construct 2 files containing the positive and negative words. One is positive words file which
has a list of various positive words and another is negative words file which has a list of various
negative words. The key to classify our tweets as positive or negative is to perform the training
using Naïve Bayes classifier on the labelled set of words and once trained, use the trained
classifier to find positive and negative probability of every tweet. Then based on the results, we
classify the tweets as either positive, negative or neutral [5]. We use nltk’s NaiveBayesClassifier
library in Python in this step [20]. This includes 10 steps as discussed below.
Step 1: We constructed 2 word files – one having a list of positive words
(about 2000 words) and another having a list of negative words (about 5000
words) and converted the words into a word dictionary.
Step 2: Once the word dictionary is created, we combine both positive and
negative word dictionaries and store it in a variable named training. Example
4 shows a snapshot of the tokenized dictionary generated after combining
both the dictionaries. This word dictionary constructed from the word files
would further help us in classifying a tweet as positive or negative while
training. Notice that each element is a list containing a dictionary and a string
index i.e., either positive or negative.
International Journal of Artificial Intelligence and Expert Systems (IJAE), Volume (10) : Issue (2) : 2021 38
ISSN: 2180-124X, https://www.cscjournals.org/journals/IJAE/description.phpBrindavana Sachidanand, Yuanyuan Jiang & Ahmad Hadaegh
Example 4: [{'abound': True}, 'positive'], [{'abounds': True}, 'positive'],
[{'abundance': True}, 'positive'], [{'abundant': True}, 'positive'], ……..,
[{'wrong': True}, 'negative'], [{'wrongful': True}, 'negative']
Step 3: Naïve Bayes Classifier is used to train the model on the training data
[8].
Step 4: The Naïve Bayes training generates a classifier. This classifier will
be used in the further steps to decide whether the tweet is positive or
negative [5].
Step 5: Now we go back to our tweet. Recall that we tokenized our tweet.
We apply a function on the tokenized tweet and generate a word dictionary
of the tokenized tweet in the same way that we performed for the set of
positive and negative words. Example 5 shows an instance of a tokenized
tweet dictionary. Notice that each token is a key-value pair.
Example 5: "{'good': True, 'see': True, 'libs': True, 'extra': True, '60': True,
'billion': True, 'put': True, 'back': True, 'economy': True, 'rather': True, 'loss':
True, 'libs': True, 'managed': True, 'covid': True, 'exceptionally': True, 'well':
True, 'labour': True, 'trying': True, 'find': True, 'fault': True, 'work': True,
'labour': True, 'lack': True, 'finesse': True, 'ability': True, 'even': True, 'build':
True, 'wealth': True}"
Step 6: Since the trained classifier is trained using Naïve Bayes, it is based
on probabilities [9]. Now a positive and negative probability score would be
assigned to the tokenized tweet dictionary that was generated in Step 5. The
probability value ranges from 0 to 1. Few operations are applied on the
classifier that is generated by the Naïve Bayes Classifier to get the positive
and negative probability score of the tokenized tweet dictionary.
prob_result = classifier.prob_classify (tokenized_tweet_dictionary)
positive_prob = prob_result.prob("positive")
negative_prob = prob_result.prob("negative")
Step 7: positive_prob and negative_prob give us the positive and negative
probability score of the tokenized tweet dictionary.
Step 8: Example 6 shows how a sentiment of a tweet is decided. If the
positive probability is greater than the negative probability, then the tweet is
classified to be positive, else it is a negative tweet.
Step 9: According to our algorithm, we have classified all the tweets that
have positive and negative probability ranging between 0.4 and 0.6 to be
neutral tweets. Thus, we end up with positive, negative, and neutral tweets.
Example 6:
Positive Probability: 0.9060365743100163,
Negative Probability: 0.09396342568998274
Sentiment: Positive
In Example 6, the Positive Probability of the tweet is greater than the
Negative Probability. Hence, the tweet is Positive. If the probabilities ranged
between 0.4 and 0.6 the tweet would have been Neutral.
International Journal of Artificial Intelligence and Expert Systems (IJAE), Volume (10) : Issue (2) : 2021 39
ISSN: 2180-124X, https://www.cscjournals.org/journals/IJAE/description.phpBrindavana Sachidanand, Yuanyuan Jiang & Ahmad Hadaegh
Step 10: Since we obtained the sentiment of every tweet, percentages of
positive, negative, and neutral tweets are calculated for each day.
We have collected tweets for 8 days in every month from February to July.
For each day, we get cleaned tweets, tokenized tweets, sentiment for every
tweet and percentages of positive, negative, and neutral tweets.
After training whenever we observed that a particular tweet is not classified correctly, we went
back to the positive and negative word files and checked if the required word is present in the
word files. In case of a word not being present, we manually added the required word to the
respective file (positive or negative file depending on the case). We kept adding new words to the
files as and when required and kept re-training and retuning the model. This enabled us to
achieve better training and better classification of the tweets.
We collected around 100,000 tweets in total to perform sentimental analysis. We feel that this
number of tweets is good to perform the analysis. However, a greater number of tweets could be
collected to perform the analysis as well, there is no inherent limitation in the methodology.
3.5 Training & Testing on the labelled tweets
After generating the labelled tweets, we split the labelled tweets into training and testing data i.e.,
80% of the labelled tweets would be training data and 20% of the labelled tweets would be testing
data [8]. We pass these training data and testing data to the Naïve Bayes Classifier to calculate
the accuracy. We have achieved an accuracy of 85.92 %.
The key to achieve good training is to include as many positive and negative words as possible in
the training set that we used for labelling the tweets so that they cover almost all words present in
the tweets and accordingly classify the tweet as either positive or negative based on those words.
If this initial labelling of tweets happens well, then our model constructed is effective. We
performed the word-based training with some corrections multiple times in order get good
labelling of tweets. Thus, good labelling of tweets would ensure good accuracy measure when
the labelled tweets are tested.
3.6 Analysis
The sentimental analysis results obtained from the model is used to draw bar plots separately for
every month to observe how the sentiments differ on particular days in every month. Plots are
drawn using Python’s matplotlib library. Figure 2 shows the plot having sentimental analysis from
nd th
Feb 2 , 2020 to July 19 , 2020. X axis gives the days and Y axis gives the percentages of
positive, negative, and neutral tweets.
From Figure 2 it can be observed that the tweets are mostly inclined towards positive in February
and more towards negative from March through July. Thus, the data found indicates that people
have more negative tweets than positive tweets related to economy. We are interested in
studying the underlining reasons that cause this effect. Since the collected tweets are related to
economy, our hypothesis is that "bad economy might be one of the top reasons that made people
generate negative posts”. We will support our hypothesis with explanation in section 4.
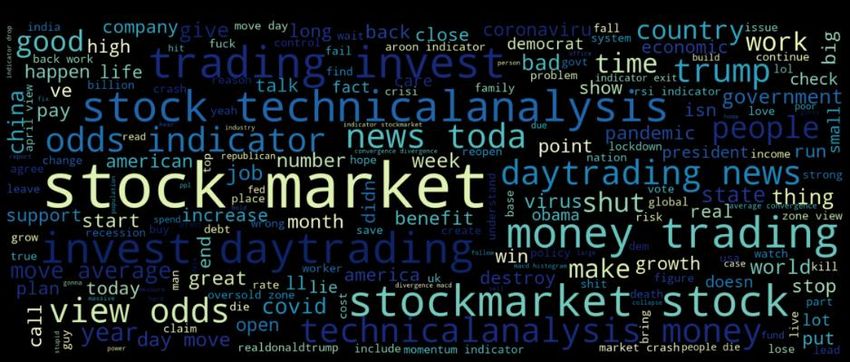
Python’s wordcloud library is used to draw a word cloud from the tokens obtained through the
tweets to observe the most important and frequently used words which would depict the relevant
words related to the current ongoing situation. Those words that appear in larger font in the word
cloud depict that they are the mostly occurring words and the ones in the smaller font are the
least occurring words. For e.g., the word ‘stock market’ is the most frequently used word
according to the word plot. Thus, stock market is most frequently discussed topic during February
2020 to July 2020 which might indicate that Covid-19, among other factors, brought changes and
people’s attention to the stock market. We can also observe that there are many more frequently
International Journal of Artificial Intelligence and Expert Systems (IJAE), Volume (10) : Issue (2) : 2021 40
ISSN: 2180-124X, https://www.cscjournals.org/journals/IJAE/description.phpBrindavana Sachidanand, Yuanyuan Jiang & Ahmad Hadaegh
occurring words. Figure 3 shows the Word Cloud obtained from the tweets.
FIGURE 2: Plot showing sentimental analysis from February to July 2020
FIGURE 3: Word Cloud.
4. RESULTS
We have presented a novel approach for sentimental using word-based training based on Naïve
Bayes approach. As explained in section 3.5, this approach yields good accuracy (85.92 %) in
testing. Table 2 shows comparisons of accuracies across related works and our work.
Works B. Le Work A. Agarwal Alec Go Work Our Work
[11] Work [13] [14]
Accuracy 80.00% 75.39% 81.30% 85.92%
TABLE 2: Comparisons of accuracies across related works.
As seen in Table 2, our approach gives accuracy which is in the higher range of the results. Thus,
these results validate our model. In sections 5.1 and 5.2 we further analyze the results obtained
from our model.
International Journal of Artificial Intelligence and Expert Systems (IJAE), Volume (10) : Issue (2) : 2021 41
ISSN: 2180-124X, https://www.cscjournals.org/journals/IJAE/description.phpBrindavana Sachidanand, Yuanyuan Jiang & Ahmad Hadaegh
4.1 Results from Monthly Sentimental Analysis
From the plots obtained, it can be observed that our data is mostly inclined towards negative
sentiment while being positive on few days. When we observe the plots obtained in each month
specifically, we observe that in the month of February, the sentiment is mostly positive and rarely
negative, from March through May the sentiment is highly negative and from June through July
the positive sentiment percentage gradually increases while still being negative on few days. We
can validate the trend observed by quoting that in February the sentiment is mostly positive
because the COVID-19 pandemic had not yet set in and the world economy was in a good shape.
But during March, the pandemic set in and the economic conditions started to worsen. Hence, the
sentiments become more negative and less positive. From March through May the sentiment is
mostly negative as the economic conditions became worse because of lockdown and stay at
home orders. From June through July the government started taking necessary steps to improve
the economy and in addition, many states started opening up gradually towards the end of June.
As the result, the sentiment started inclining towards positive while still retaining negative
sentiments on few days.
Thus, our earlier hypothesis stated under section 3.6 that "bad economy might be one of the top
reasons that made people generate negative posts” is validated. Since we collected tweets using
the keywords ‘economy’, ‘stock market’, ‘GDP’, ‘unemployment’ and ‘business shutting’ the
sentiment calculated can be directly attributed to the state of economy at that point of time.
It is observed that positive and negative tweets have higher sentiments (around 40% to 50%) and
neutral percentage is usually lower (around 10%). Positive and negative percentages have
around 10% difference because whenever the economy drops, the government comes up with
remedial measures to make the positive percentage to be around 10% closer to the negative
percentage. The tweets are mostly either positive or negative.
4.2. Correlating percentages of positive and negative tweets with Dow Jones Industrial
Average (DJIA)
Now that we have sentimental analysis in place, we can move on to correlating the sentiments to
stock market. It is generally believed that the stock market is a reflection of the current state of
economy and the movement of stock market captures the economic sentiment. Dow Jones
Industrial Average (DJIA) is a USA stock market index that consists of 30 blue chip publicly
traded companies. This largely tracks the US stock market sentiment [7]. Five-day moving Dow
Jones Industrial Average (FDJIA) gives an average of Dow Jones Industrial Average over 5 days
[7].
All tweets collected are in English and since almost 85% of the tweets are from United States, we
would focus on Dow Jones Industrial Average specifically in United States to draw correlations to
percentage changes in positive and negative tweets. Correlation is a statistical measure which
indicates how two or more entities are related to each other [21]. A positive correlation indicates
that the entities are directly related and shows the measure of how the entities increase or
decrease in parallel; a negative correlation indicates that the entities are inversely related and
shows the measure of how one entity increases as the other decreases [22].
In our case, it is observed that the economic sentimental analysis is corelating well to DJIA [7].
Also, since the word cloud seems to suggest that there is a good correlation between the stock
and sentiments, we tried to correlate the stock index with the sentiment – it seems to corelate
reasonably well.
We calculate the Five-day moving Dow Jones Industrial Average (FDJIA). It is seen that
whenever the percentage change in FDJIA increases, there is an increase in change of positive
percentage of tweets and decrease in change of negative percentage of tweets. Basically, this
means that whenever the stock market is going down, the sentiment of tweets is mostly negative
i.e., the negative sentiment percentage increases. Similarly, whenever the stock market is going
International Journal of Artificial Intelligence and Expert Systems (IJAE), Volume (10) : Issue (2) : 2021 42
ISSN: 2180-124X, https://www.cscjournals.org/journals/IJAE/description.phpBrindavana Sachidanand, Yuanyuan Jiang & Ahmad Hadaegh
up, the sentiment of tweets is mostly positive i.e., the positive sentiment percentage increases
[21]. Figure 4 shows the Relationship between percentage change in FDJIA with percentage
change in positive tweets and percentage change in negative tweets . X axis gives the days and
Y axis gives the percentages of positive, negative, and neutral tweets.
From Figure 4, it can be observed that whenever there is a rise in percentage change in FDJIA,
there is a rise in percentage change in positive tweets i.e., they are positively (directly) corelated.
But whenever there is a drop-in percentage change in FDJIA, there is a rise in percentage
change in negative tweets i.e., they are negatively (inversely) correlated.
FIGURE 4: Relationship between percentage change in FDJIA with percentage change in positive tweets
and percentage change in negative tweets.
Figure 5 (a) and (b) are the plots showing correlation between the respective entities. X axis gives
the %change in FDJIA and Y axis gives the %change in positive and negative tweets in 5 (a) and
5 (b) respectively.
FIGURE 5 (a): Correlation between FIGURE 5(b): Correlation between
percentage change in FDJIA and percentage change in FDJIA and
percentage change in positive tweets. percentage change in negative tweets.
International Journal of Artificial Intelligence and Expert Systems (IJAE), Volume (10) : Issue (2) : 2021 43
ISSN: 2180-124X, https://www.cscjournals.org/journals/IJAE/description.phpBrindavana Sachidanand, Yuanyuan Jiang & Ahmad Hadaegh
From Figure 5 (a) it can be observed that there is direct correlation (positive correlation) between
percentage change in FDJIA and percentage change in positive tweets and similarly, from Figure
5 (b) it can be observed that there is inverse correlation (negative correlation) between
percentage change in FDJIA and percentage change in negative tweets.
We use Equation 1 to calculate the correlation value between the entities [21].
Equation 1: Correlation.
In Equation 1, n refers to the number of entries, x and y refer to the entities whose correlation
need to be determined, and refer to mean/average of x and y, respectively. and refer to
the Standard Deviations of x and y, respectively [22].
After calculating, we obtain correlation value as 0.69 in the case of 5 (a) and -0.61 in the case of
5 (b). This proves that 5 (a) is the case of positive correlation and 5 (b) is the case of negative
correlation.
Thus, it is observed that the percentage change in Five-day moving Dow Jones Moving Average
(FDJIA) is positively correlated to percentage change in positive tweets and negatively correlated
to percentage change in negative tweets. This means that whenever the stock market is
performing well, there is an increase in the FDJIA, and this in turn reflects in the sentiments of
tweets and thus people tweet positively. Similarly, whenever the stock market is not performing
well, there is a decrease in the FDJIA, and this in turn reflects in the sentiments of tweets and
thus people tweet negatively.
5. CONCLUSIONS
In this paper we presented a novel approach to do sentimental analysis using Naïve Bayes
Classifier which is based on word-based training. We used this analysis on Twitter data to track
the sentiments of the people on the effect of COVID-19 on world economy. We collected tweets
related to economy during a 6-month period i.e., February 2020 to July 2020. We then cleaned,
tokenized the tweets and then classified each tweet as positive, negative, or neutral using Naïve
Bayes classifier. This novel approach is modular and yields good results. Once we have the
labelled tweets i.e., each tweet along with its sentiment, we performed training (80% of labelled
tweets) and testing (20% of labelled tweets) and found accuracy to be 85.92 %.
We noticed the impact of COVID-19 on economy from the obtained results and found that the
tweets were inclined towards positive sentiment in February 2020, from March through May it
mostly inclined towards negative sentiment and from June through July we saw a slight increase
in positive sentiment while being negative on few days. Thus, we reached a conclusion that our
data was largely inclined towards negative sentiment indicating that the economy had been
largely negatively impacted as a result of COVID-19.
We also showed strong correlation of the sentiment with Five-day moving Dow Jones Industrial
Average (FDJIA) i.e., we observed positive correlation between percentage change in positive
tweets and percentage change in FDJIA and negative correlation between percentage change in
negative tweets and percentage change in FDJIA. This means that whenever there is positive
sentiment in tweets, the FDJIA is also in positive territory indicating that the stock market is
performing well. Similarly, whenever there is negative sentiment in tweets, the FDJIA is also in
negative territory indicating that the stock market is not performing well.
International Journal of Artificial Intelligence and Expert Systems (IJAE), Volume (10) : Issue (2) : 2021 44
ISSN: 2180-124X, https://www.cscjournals.org/journals/IJAE/description.phpBrindavana Sachidanand, Yuanyuan Jiang & Ahmad Hadaegh
This work proposed and tested a generic lower-cost text-based model to analysis generic public’s
opinion about an event which can be adopted to analyze other topics. Our model could be used
to analyze sentiment on any piece of text be it any email, news article or a message. For
example, a higher-level application can be built to classify any news article to help the reader with
the sentiment of the article. Our model can also be used by the administration to gauge the
sentiment of people on various issues that affects the people. It could be a good tool to gather
sentiments of people if any policy change is done. It could also be used in election predictions
where psephologists can use the tweets to predict the outcome of an election. For example,
based on the sentiment of the tweets, one can get the approval ratings of candidates in an
election - this can be useful tool for the candidates to decide on the strategy to be used in the
course of their election campaign.
A limitation of our work could be that since not everyone uses Twitter, the sentiments of those
cluster of people not using Twitter are not captured. We do not know if their sentiments conform
to the results that we provided, or if they deviate. More experiments can be done using our
methods with more tweets or tweets from different time to better analyze the accuracy and
reliability of this method. It would be interesting to see if similar results can be found via posts
from other platforms, like Facebook or Reddit.
The scope of our work was between the 6-month period from February 2020 to July 2020. As a
future scope, we could also collect tweets for a period of 1 year i.e., from 2020 to 2021 and
observe the overall 1-year trend. We can also factor in the quantity of likes, retweets, and shares
in the form of weights which would be added to the raw sentiment calculated by the sentiment
analysis. In our work we studied the relationship between the sentiment towards economy and
stock market index - as a future work we could also consider relationship of sentiment towards
economy with other factors such as number of COVID-19 cases, number of COVID-19 deaths
and number of remedial policies introduced by the government.
6. REFERENCES
[1] S.Hamidian and M. Diab, “Rumor Detection and Classification for Twitter Data”. SOTICS
2015 : The Fifth International Conference on Social Media Technologies, Communication,
and Informatics.
[2] Cinelli, M., Quattrociocchi, W., Galeazzi, A. et al. The COVID-19 social media infodemic. Sci
Rep 10, 16598 (2020). https://doi.org/10.1038/s41598-020-73510-5.
[3] Amedie, Jacob, "The Impact of Social Media on Society" (2015). Pop Culture Intersections.
2.
[4] Fang, X., Zhan, J. Sentiment analysis using product review data. Journal of Big Data 2, 5
(2015). https://doi.org/10.1186/s40537-015-0015-2
[5] Rish, Irina. (2001). An Empirical Study of the Naïve Bayes Classifier. IJCAI 2001 Work
Empir Methods Artif Intell. 3.
[6] I.V., Shravan. (2016). Sentiment Analysis in Python using NLTK. OSFY -
OpensourceForYou.
[7] R. Glen Donaldson and Harold Y. Kim, “Price Barriers in the Dow Jones Industrial
Average”,The Journal of Financial and Quantitative Analysis, Vol. 28, No. 3 (Sep 1993), pp.
313-330
International Journal of Artificial Intelligence and Expert Systems (IJAE), Volume (10) : Issue (2) : 2021 45
ISSN: 2180-124X, https://www.cscjournals.org/journals/IJAE/description.phpBrindavana Sachidanand, Yuanyuan Jiang & Ahmad Hadaegh
[8] C. Troussas, M. Virvou, K. J. Espinosa, K. Llaguno and J. Caro, "Sentiment analysis of
Facebook statuses using Naive Bayes classifier for language learning," IISA 2013, Piraeus,
2013, pp. 1-6, doi: 10.1109/IISA.2013.6623713.
[9] J. Song, K. T. Kim, B. Lee, S. Kim and H. Y. Youn, "A novel classification approach based
on Naïve Bayes for Twitter sentiment analysis," KSII Transactions on Internet and
Information Systems, vol. 11, no. 6, pp. 2996-3011, 2017. DOI: 10.3837/tiis.2017.06.011.
[10] A. Atkeson, “What will be the Economic Impact of Covid-19 in the US? Rough Estimates of
disease scenarios”, NATIONAL BUREAU OF ECONOMIC RESEARCH 1050
Massachusetts Avenue Cambridge, MA 02138 March 2020
[11] B. Le and H. Nguyen, "Twitter Sentiment Analysis Using Machine Learning Techniques,"
Advanced Computational Methods for Knowledge Engineering, pp.279-289, 2015.
[12] B. P. Pokharel, “Twitter Sentiment analysis during COVID-19 Outbreak in Nepal”, M.Phil in
ICT 3rd semester Nepal Open University, Nepal, May 2020.
[13] A. Agarwal, B. X, I. Vovsha, Owen Rambow and Rebecca Passonneau, "Sentiment analysis
of Twitter data," in Proc. of the Workshop on Languages in Social Media, pp.30-38, 2011.
[14] A. Go, L. Huang and R. Bhayani, “Twitter Sentiment Classification using Distant
Supervision”. 2009.
[15] K. H. Manguri, R. N. Ramadhan, and P. R. Mohammed Amin, “Twitter Sentiment Analysis
on Worldwide COVID-19 Outbreaks”, Kurdistan Journal of Applied Research, vol. 5, no. 3,
pp. 54-65, May 2020.
[16] Boon-Itt S, Skunkan Y, “Public Perception of the COVID-19 Pandemic on Twitter: Sentiment
Analysis and Topic Modeling Study”, JIMR Public Health Surveill 2020;6(4):e21978.
[17] Klaifer Garcia, Lilian Berton, “Topic detection and sentiment analysis in Twitter content
related to COVID-19 from Brazil and the USA”, Applied Soft Computing, Volume 101, 2021,
107057, ISSN 1568-4946
[18] U. Naseem, I. Razzak, M. Khushi, P. W. Eklund and J. Kim, "COVIDSenti: A Large-Scale
Benchmark Twitter Data Set for COVID-19 Sentiment Analysis," in IEEE Transactions on
Computational Social Systems, doi: 10.1109/TCSS.2021.3051189.
[19] Senthil V., Goswami S. (2020) An Exploratory Study of Twitter Sentiment Analysis During
COVID-19: #TravelTomorrow and #UNWTO. In: Sharma S.K., Dwivedi Y.K., Metri B., Rana
N.P. (eds) Re-imagining Diffusion and Adoption of Information Technology and Systems: A
Continuing Conversation. TDIT 2020. IFIP Advances in Information and Communication
Technology, vol 618. Springer, Cham. https://doi.org/10.1007/978-3-030-64861-9_43
[20] N. Sebe, M. S. Lew, I. Cohen, A. Garg and T. S. Huang, "Emotion recognition using a
Cauchy Naive Bayes classifier," Object recognition supported by user interaction for service
robots, Quebec City, Quebec, Canada, 2002, pp. 17-20 vol.1, doi:
10.1109/ICPR.2002.1044578.
[21] Senthilnathan, Samithambe, Usefulness of Correlation Analysis (July 9, 2019). Available at
SSRN: https://ssrn.com/abstract=3416918 or http://dx.doi.org/10.2139/ssrn.3416918.
[22] R. Taylor, EdD, RDCS, “Interpretation of the Correlation Coefficient: A Basic Review”,
1990 Research Article.
International Journal of Artificial Intelligence and Expert Systems (IJAE), Volume (10) : Issue (2) : 2021 46
ISSN: 2180-124X, https://www.cscjournals.org/journals/IJAE/description.phpYou can also read