Effect of Particle Size and Surface Chemistry of Photon-Upconversion Nanoparticles on Analog and Digital Immunoassays for Cardiac Troponin
←
→
Page content transcription
If your browser does not render page correctly, please read the page content below
RESEARCH ARTICLE
 www.advhealthmat.de

Effect of Particle Size and Surface Chemistry of
Photon-Upconversion Nanoparticles on Analog and Digital
Immunoassays for Cardiac Troponin
Julian C. Brandmeier, Kirsti Raiko, Zdeněk Farka,* Riikka Peltomaa, Matthias J. Mickert,
Antonín Hlaváček, Petr Skládal, Tero Soukka,* and Hans H. Gorris*

 1. Introduction
Sensitive immunoassays are required for troponin, a low-abundance cardiac
biomarker in blood. In contrast to conventional (analog) assays that measure Heart diseases such as acute myocardial
 infarction (AMI) are the leading cause of
the integrated signal of thousands of molecules, digital assays are based on
 death worldwide.[1] Since there is only a
counting individual biomarker molecules. Photon-upconversion nanoparticles limited time available from the onset of
(UCNP) are an excellent nanomaterial for labeling and detecting single the symptoms to lifesaving treatment, fast
biomarker molecules because their unique anti-Stokes emission avoids and reliable diagnostic tests are essential.
optical interference, and single nanoparticles can be reliably distinguished In healthy individuals, cardiac troponin
from the background signal. Here, the effect of the surface architecture and (cTn) is located exclusively in myocardial
 tissue. Therefore, several clinical tests have
size of UCNP labels on the performance of upconversion-linked
 been employed to measure elevated levels
immunosorbent assays (ULISA) is critically assessed. The size, brightness, of cTn—the recommended biomarker for
and surface architecture of UCNP labels are more important for measuring AMI—in blood for the early diagnosis of
low troponin concentrations in human plasma than changing from an analog AMI.[2] cTn is a heterotrimeric complex
to a digital detection mode. Both detection modes result approximately in the consisting of cTnI, cTnT, and TnC.[3,4] The
 subunits cTnI and cTnT exist as unique,
same assay sensitivity, reaching a limit of detection (LOD) of 10 pg mL−1 in
 recognizable isoforms only in the heart
plasma, which is in the range of troponin concentrations found in the blood of muscle (myocardium) and are released into
healthy individuals. the blood during AMI.[5,6] Highly sensitive,
 precise, and specific troponin tests are
 required to discriminate between low cTnI
 levels in blood and background noise.[7]
J. C. Brandmeier, Z. Farka, R. Peltomaa, M. J. Mickert, H. H. Gorris
 Commercial chemiluminescence, electrochemical, or fluores-
Institute of Analytical Chemistry, Chemo- and Biosensors cence assays in clinical use[8] reach limits of detection (LOD) in
University of Regensburg the range of 0.08–2.7 pg mL−1 .[9] According to the European So-
Regensburg 93053, Germany ciety of Cardiology and the American College of Cardiology, in-
E-mail: farka@mail.muni.cz; hans-heiner.gorris@ur.de creased cTnI or cTnT levels in blood are defined as the value above
K. Raiko, R. Peltomaa, T. Soukka the 99th percentile concentration of a healthy reference popula-
Department of Life Technologies/Biotechnology
University of Turku tion, which varies typically between 8.67 and 60.4 pg mL−1 .[10,11]
Kiinamyllynkatu 10, Turku 20520, Finland Nevertheless, cTnI is a challenging analyte for immunochem-
E-mail: tejoso@utu.fi ical detection, and quantitative measurements can be influenced
Z. Farka, P. Skládal by several factors, such as the availability of epitopes for anti-
Department of Biochemistry, Faculty of Science body binding. Due to the proteolytic susceptibility of the N- and
Masaryk University
Kamenice 5, Brno 625 00, Czech Republic
 C-terminal parts of cTnI,[12] antibodies for cTnI assays are often
A. Hlaváček
 selected to recognize epitopes in the stable central part.[13,14] Fur-
Institute of Analytical Chemistry of the Czech Academy of Sciences thermore, since cTnI in the blood is mainly present as a binary
v. v. i., Brno 602 00, Czech Republic cTnI–TnC complex,[8] the antibodies should recognize both the
 free and complexed forms of cTnI. Moreover, phosphorylation or
 The ORCID identification number(s) for the author(s) of this article blocking of the epitopes by autoantibodies or heterophile anti-
 can be found under https://doi.org/10.1002/adhm.202100506 bodies may hinder the antibody recognition.[15] As it is unlikely
© 2021 The Authors. Advanced Healthcare Materials published by that a single antibody pair is not affected by some kind of cTnI
Wiley-VCH GmbH. This is an open access article under the terms of the
 modifications or interferences,[16] many cTnI assays use a com-
Creative Commons Attribution-NonCommercial License, which permits
use, distribution and reproduction in any medium, provided the original bination of two capture or two detection antibodies.[9] Further-
work is properly cited and is not used for commercial purposes. more, troponin assays often suffer not only from a low work-
 ing range but also from rather poor precision at concentrations
DOI: 10.1002/adhm.202100506

Adv. Healthcare Mater. 2021, 2100506 2100506 (1 of 9) © 2021 The Authors. Advanced Healthcare Materials published by Wiley-VCH GmbH
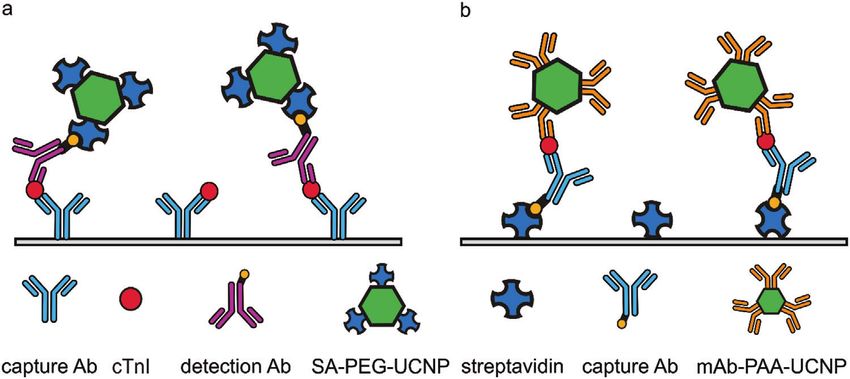
www.advancedsciencenews.com www.advhealthmat.de

Figure 1. ULISA configurations for the detection of cardiac troponin (cTnI). a) SA-PEG-UCNP label: A microtiter well is coated with monoclonal mouse
anti-cTnI antibodies to capture cTnI. The biotinylated anti-cTnI antibody binds to cTnI and forms a sandwich immunocomplex, which is detected using SA-
PEG-UCNP labels. b) mAb-PAA-UCNP label: A microtiter well is coated with streptavidin to immobilize biotinylated anti-cTnI antibodies, which capture
cTnI. Finally, mAb-UCNP conjugates bind to cTnI and form a sandwich immunocomplex.

below the 99th percentile.[17] The choice of signal-generating la- of 0.023 pg mL−1 , which was 20-fold more sensitive than the
bels is of a paramount importance to improve the assay reliability analog readout. In another study, we applied PAA-coated UCNPs
and performance. to the detection of cTnI in the analog mode, which resulted in
 Photon-upconversion nanoparticles (UCNP) represent an LOD of 0.48 pg mL−1 .[28,29] Here, we employ both surface
lanthanide-doped luminescent labels emitting shorter- modification strategies for UCNPs and critically assess the effect
wavelength light under near-infrared excitation (anti-Stokes of the UCNP label size on the performance of the analog and
emission), which strongly reduces background interference digital immunoassay for cTnI. The schemes of the sandwich
because of autofluorescence and light scattering.[18,19] Due to ULISAs using either type of label are shown in Figure 1.
these remarkable optical properties, UCNPs are excellent labels
for upconversion-linked immunosorbent assays (ULISA).[20–22] 2. Experimental Section
The hydrophobic layer of oleic acid on pristine UCNPs needs
to be replaced by a hydrophilic coating to render the UCNPs 2.1. Chemicals and Reagents
dispersible in aqueous media and allow further bioconjugation.
Alkyne-poly(ethylene glycol) (PEG) conjugated to neridronate, A complete list of chemicals and the preparation of alkyne-
a bisphosphonate, has been shown to strongly coordinate to PEG-neridronate (Alkyne-PEG-Ner) and the streptavidin-azide
surface lanthanide ions of UCNPs. The alkyne group reacts are provided in the Supporting Information. The cTn I-T-C com-
with azide-modified streptavidin via click-chemistry.[23,24] Al- plex, and monoclonal anti-cTnI-antibody (mAb) clones 19C7cc,
ternatively, surface coating with hydrophilic poly(acrylic acid) MF4cc, 560cc, and 625cc were purchased from Hytest (Turku,
(PAA) yields water-dispersible nanoparticles with excellent Finland). The mAbs 560cc and 625cc were biotinylated as de-
colloidal stability and high density of surface carboxyl groups for scribed in the Supporting Information and mAb 19C7 as pre-
bioconjugation via EDC/NHS activation.[25] viously published.[30] The recombinant anti-cTnI Fab fragment
 Furthermore, the absence of optical background interferences 9707 was cloned from a hybridoma cell line of Medix Biochemica
enables the detection and counting of individual UCNP labels (Espoo, Finland) and produced and site-specifically biotinylated
using wide-field optical microscopy.[19,26] This has led to the de- as described previously.[31] Blood for the plasma pool from five
velopment of single-molecule (digital) immunoassays,[27] as op- anonymized healthy volunteers was collected in lithium-heparin
posed to analog immunoassays where the integrated signal gen- vacuum tubes (BD Vacutainer 10 mL, Plymouth, UK). Volun-
erated by thousands of labels is measured. It is essential that the teers provided written informed consent regarding the use of col-
UCNP labels have the right size and are bright enough to be reli- lected plasma samples according to the principles expressed in
ably detectable (and countable) at the single-nanoparticle level. If the Declaration of Helsinki. Plasma was stored at −20 °C, and
this condition is met, the digital assay is essentially independent the aliquots were freshly thawed and centrifuged for 5 min at
of varying particle brightness, particle aggregation, and the in- 1000 g before each experiment. The STAT troponin I test (Abbot,
strumental background. With high-affinity detection antibodies, Chicago, IL, USA) was used to determine the intrinsic cTnI con-
the LOD is limited by (1) the standard deviation of the nonspecif- centration in plasma.
ically bound labels in the control sample without analyte, and (2) The buffers were prepared using double-distilled water and
counting statistics, as the precision of the measurement depends filtered through a 0.22-µm membrane (Magna Nylon, GVS,
on the number of counted events (Poisson noise). USA). The buffers for the dilution of reagents included phos-
 We previously developed a digital ULISA with PEG- phate buffer (PB; 50 × 10−3 m NaH2 PO4 /Na2 HPO4 , pH 7.4),
neridronate-based UCNP labels for the detection of prostate- phosphate-buffered saline (PBS; PB with 150 × 10−3 m NaCl),
specific antigen (PSA).[19,26] The digital readout yielded an LOD Tris-buffered saline (TBS; 50 × 10−3 m Tris, 150 × 10−3 m

Adv. Healthcare Mater. 2021, 2100506 2100506 (2 of 9) © 2021 The Authors. Advanced Healthcare Materials published by Wiley-VCH GmbH
www.advancedsciencenews.com www.advhealthmat.de

NaCl, pH 7.5). Coating buffer consisted of 50 × 10−3 m were obtained from Kaivogen. The oleic acid was removed and
NaHCO3 /Na2 CO3 , 0.05% NaN3 , pH 9.6. Two types of wash- replaced with PAA in a two-step ligand exchange with NOBF4 ,
ing buffers were employed: Kaivogen-washing buffer and Tris- as described previously.[33] The UCNPs (25 mg) dispersed in
washing buffer (50 × 10−3 m Tris, 5 × 10⁻³ m CaCl2 , 0.05% cyclohexane were mixed with an equal volume of dimethylfor-
Tween 20, pH 7.5). Several assay buffer combinations were in- mamide (DMF). The suspension was sonicated for 1 min, added
vestigated: (1) SuperBlock buffer (10% SuperBlock in TBS, 1 × to 25 mg of NOBF4 and vortexed vigorously. During the following
10−3 m KF, 0.05% Tween 20, 0.05% PEG, and 0.05% NaN3 , pH 60 min under shaking (1200 rpm), oleic acid on the nanoparti-
7.5), (2) SuperBlock buffer with 5 × 10⁻³ m CaCl2 (SuperBlock- cle surface was replaced by BF4 – , which mediated a phase trans-
Ca), (3) Kaivogen assay buffer, (4) modified Kaivogen assay buffer fer from cyclohexane to DMF. The UCNP dispersion was split
(assay buffer including 0.05% PAA (MW 1200 Da), 1 × 10⁻³ m into two aliquots and the particles were precipitated by adding a
KF, 0.2% milk powder, 0.08% native mouse IgG, 0.005% dena- fourfold volume excess of chloroform to the dispersion in DMF.
tured mouse IgG, pH 8.0), (5) BSA/BGG buffer (37.5 × 10⁻³ m The UCNPs were washed four times by alternating precipitation
Tris, 513 × 10−3 m NaCl, 5% d-trehalose, 2.5% BSA, 0.06% BGG, with chloroform and centrifugation (11 000 g, 5 min) followed
0.04% NaN3 , pH 8.6), and (6) BSA/BGG/IgG buffer (37.5 × 10⁻³ by redispersion in 200 µL of DMF. The UCNP pellet was resus-
m Tris, 500 × 10−3 m NaCl, 5% d-trehalose, 2.5% BSA, 0.06% pended in 150 µL DMF, centrifuged (2500 g, 3 min) to remove
BGG, 0.08% native mouse IgG, 0.005% denatured mouse IgG, possible larger aggregates, and the supernatant was transferred
0.2% casein, 37.5 U mL−1 heparin, 0.0375% NaN3 , pH 7.75). Cal- to a fresh tube. The yield of UCNPs coated with BF4 – was de-
ibrator dilutions were prepared in 7.5% BSA/TSA (50 × 10−3 m termined by comparing the luminescence of the solution to that
Tris, pH 7.75, 150 × 10−3 m NaCl and 0.05% NaN3 , with 7.5% of 10 mg mL−1 UCNP standard, both diluted 200 times in 10 ×
BSA). 10−3 m B4 Na2 O7 , pH 8 with 0.1% Tween-20).
 The DMF dispersion of BF4 – -coated UCNPs was mixed with a
 10% solution of poly(acrylic acid) (PAA, MW 2000) in water (ad-
2.2. Preparation of and Characterization of UCNP Labels
 justed to pH 9 by NaOH) such that a twofold mass excess of
 PAA compared to UCNPs was obtained. The mixture was fur-
2.2.1. SA-PEG-UCNP Conjugates
 ther diluted with DMF to yield a PAA concentration of 3.3%
 and incubated for 24 h at 60 °C under shaking (1400 rpm). The
For the preparation of SA-PEG-UCNP labels, UCNPs
 PAA-coated UCNPs were washed three times by centrifugation
(NaYF4 :Yb,Er, 63 nm in diameter) were synthesized as de-
 (20 000 g, 15 min) and resuspended twice in 1 mL of water and
scribed in the Supporting Information. The UCNPs (10 mg,
 finally in 1 mL of sodium borate buffer (50 × 10−3 m H3 BO3 with
311 µL) dispersed in cyclohexane were mixed with an equal
 NaOH, pH 8.0). This suspension was centrifuged once more at
volume of 200 × 10−3 m HCl and incubated for 30 min at 38 °C
 lower speed (2500 g, 3 min) to sediment possible larger aggre-
under shaking and an additional 15 min of sonication to remove
 gates. The supernatant was carefully collected and stored at room
the oleic acid from the UCNP surface and mediate a phase trans-
 temperature (RT) until further use.
fer from cyclohexane to water. The lower HCl phase was added
 The conjugation of mAb 625cc and mAb 560cc was adapted
to an excess of acetone and centrifuged (1000 g, 20 min) to pre-
 from a previously published protocol[28] and all steps were per-
cipitate the UCNPs. The UCNP pellet was redispersed in 500 µL
 formed at RT. A dispersion of 250 µL of PAA-coated UCNPs
of water, sonicated for 5 min, and 2 mg of the Alkyne-PEG-Ner
 (2 mg) in 20 × 10−3 m aqueous MES buffer (pH 6.1) was activated
linker dissolved in 500 µL of water were added and incubated
 using 20 × 10−3 m EDC and 30 × 10−3 m sulfo-NHS for 45 min
overnight at 38 °C under shaking. The Alkyne-PEG-Ner-UCNP
 under shaking. The UCNPs were washed by two centrifugation
conjugates were dialyzed for 72 h in a Float-A-Lyzer G2 dialysis
 steps (20 000 g, 7 min), the initial one followed by resuspension
device (100 kDa MW cut-off; Fisher Scientific) at 4 °C against 4 L
 in 335 µL and the second in 210 µL of 20 × 10−3 m MES buffer.
of 1 × 10⁻³ m KF in water, which was exchanged nine times.
 40 µL of mAbs solution in 0.9% NaCl was added to yield a fi-
 For the functionalization with streptavidin, 100 µL of Tris-HCl
 nal antibody concentration of 0.33 mg mL−1 in a total volume of
(375 × 10−3 m, pH 7.5) and an aqueous solution of sodium ascor-
 250 µL. After 2.5 h under rotation, an aqueous solution of 2 m
bate (20 µL, 100 × 10−3 m) were added to 10 mg of Alkyne-PEG-
 2-amino-N,N-dimethylacetamide (ADMA) in water (pH 11) was
Ner-UCNPs in 1.4 mL of water. After purging the mixture for
 added to yield a final ADMA concentration of 50 × 10−3 m. The
45 min with argon, 100 µL of streptavidin-azide (1 mg mL−1
 mixture was rotated for 30 min to terminate the conjugation re-
in water) were added, and the mixture was purged for another
 action and block the nanoparticle surface. After washing twice by
10 min. Adding 10 µL of an aqueous solution of 25 × 10−3 m
 centrifugation (20 000 g, 10 min) and resuspension in 500 µL of
CuSO4 initiated the click reaction. The suspension was purged
 Tris-buffer (10 × 10−3 m Tris, 0.1% Tween 20, pH 8), the antibody-
for 40 min with argon and then dialyzed in a Float-A-Lyzer G2
 conjugated UCNPs (mAb-PAA-UCNPs) were resuspended in 5 ×
dialysis device (100 kDa MW cut-off) against 4 L of dialysis buffer
 10−3 m Tris, pH 8.5, 0.05% Tween 85, 0.5% BSA, 0.05% NaN3 , pH
(50 × 10−3 m Tris, 0.05% NaN3 , 1 × 10⁻³ m KF, pH 7.5 at 4 °C for
 8.5, and stored at 4 °C.
72 h), which was exchanged nine times.[32]

2.2.2. mAb-PAA-UCNP Conjugates 2.2.3. Characterization of UCNP Labels

For the preparation of mAb-PAA-UCNP labels, oleic acid-capped The UCNPs and their conjugates were characterized using trans-
UCNPs (NaYF4 :Yb,Er; 40, 48, 56, 64, and 80 nm in diameter) mission electron microscopy (TEM), dynamic light scattering

Adv. Healthcare Mater. 2021, 2100506 2100506 (3 of 9) © 2021 The Authors. Advanced Healthcare Materials published by Wiley-VCH GmbH
www.advancedsciencenews.com www.advhealthmat.de

(DLS), and upconversion emission spectroscopy as described in and a signal integration time 1 s. Afterwards, the 16 highest and
Figures S1–S3 in the Supporting Information. 16 lowest values were discarded, and the mean value was calcu-
 lated, providing the truncated average of the intensity in a single
 well. (2) In the case of mAb-PAA-UCNP labels, the bottom sur-
2.3. ULISA face of the microtiter plate wells was scanned using a 3 × 3 raster
 with 1.5 mm step size and an exposure time of 2 s and the av-
2.3.1. SA-PEG-UCNP Labels erage intensity per well was calculated. The plotted averages and
 standard deviations (mean ± SD) were determined from three in-
A high-binding 96-well microtiter plate ( Clear with 190- m- dependent wells. The data was fitted by a four-parameter logistic
thick bottom foil for microscope detection, Greiner, Austria) function using the software Origin 2020 (OriginLab, USA). The
was coated with 60 µL of two monoclonal anti-cTnI antibodies LODs were obtained by adding three times the standard devia-
(19C7cc and MF4cc, each 50 ng/well) in coating buffer overnight tion of the background to the baseline values of the regression
at 4 °C. The following steps were carried out at RT. The plate was curve.[26]
washed twice with 250 µL of Tris-washing buffer and blocked
for 1 h with 175 µL of SuperBlock buffer. After two wash-
ing steps, the cTn I-T-C complex was serially diluted in 60 µL 2.4.2. Digital Readout
of either BSA/BGG buffer alone, or 20% human plasma in
BSA/BGG buffer and incubated for 1 h. The microtiter plate was An inverted wide-field epifluorescence microscope (Eclipse Ti,
washed twice and incubated for 1 h with 60 µL of a mixture Nikon, Japan) was connected to a continuous-wave 980-nm laser
containing biotinylated anti-cTnI antibodies (560cc and 625cc; diode (4 W, Wavespectrum, China) via a multimode optical
each 0.5 µg mL−1 ) in SuperBlock-Ca buffer. After two washing fiber (105 µm fiber core, 0.22 NA, Wavespectrum) and a motor-
steps, the plate was incubated with 60 µL of SA-PEG-UCNPs ized TIRF/Epifluorescence illuminator unit (Eclipse Ti-E, Nikon,
(6.5 µg mL−1 ) for 1 h in SuperBlock-Ca buffer. After two wash- Japan). The filter cube for the detection of Er3+ -doped UCNPs
ing steps, the plate was left to dry on air. consisted of a long-pass excitation filter ( cut-on = 830 nm, Schott,
 Germany), a dichroic mirror ( cut-on = 875 nm, AHF Analysen-
 technik, Germany), and a band-pass filter ( = 535 ± 70 nm,
2.3.2. mAb-PAA-UCNP Labels OD980 ≈ 6, Chroma, USA). The images were acquired on an sC-
 MOS camera (5.5 megapixel, Neo, Andor Technology, UK) and
All steps were carried out at RT. The mAb-PAA-UCNP labels were a 100× objective (1.49 NA, CFI HP Apochromat TIRF, Nikon),
diluted 30 min before starting the assay in modified Kaivogen as- which resulted in a power density of 640 W cm−2 .
say buffer to a final concentration of either 4 µg mL−1 of mAb625- The dry microtiter plate wells were filled with 80 µL of glycerol
PAA-UCNP alone, or 2 µg mL−1 of each label in a mixture of for heat dissipation of the NIR laser beam. The software NIS El-
mAb625-PAA-UCNP and mAb560cc-PAA-UCNP. ements 4.5 (Nikon) was used for the acquisition of 9 wide-field
 A high-binding 96-well microtiter plate ( Clear with 190-µm- images per well with an imaging area of 166 × 144 µm2 and ex-
thick bottom foil for microscope detection, Greiner) was coated posure times between 10 and 30 s (depending on the size—and
with streptavidin as described earlier.[34] The plates were first thus brightness—of the UCNPs)[19] and for the counting of indi-
washed with Kaivogen washing buffer. Then, 50 µL of biotiny- vidual UCNPs. The total number of UCNPs per well (n = 3) was
lated mAb 19C7cc (150 ng/well) and Fab 9707 (50 ng/well) in analyzed using a four-parameter logistic function in Origin 2020.
Kaivogen assay buffer were added and incubated for 30 min The LODs were obtained by adding three times the standard de-
under shaking. After one washing step, the cTn I-T-C complex viation of the background to the baseline values of the regression
was serially diluted in 50 L/well in 7.5% BSA/TSA or hu- curve.[26]
man plasma, respectively, followed by further dilution to 20%
in BSA/BGG/IgG buffer, and incubated for 30 min. After one 3. Results and Discussion
washing step, the mAb-PAA-UCNP labels prepared prior to the
assay were sonicated 3× for 0.5 s with 100% amplitude using a 3.1. Optimization of Antibody Combination and ULISA
VialTweeter (Hielscher Ultrasonics, Teltow, Germany) and added Configuration
to the microtiter plate (50 L/well). After 15 min, the microtiter
plate was washed four times and left to dry on air. cTnI is a very fragile analyte prone to proteolytic degrada-
 tion, phosphorylation, or complexing with other proteins and
 autoantibodies.[16,36–38] As these factors are not relevant when
2.4. Signal Acquisition and Statistical Analysis cTnI is present in well-defined buffers, it is necessary to as-
 sess the detectability of cTnI in its physiological environment,
2.4.1. Analog Readout where many different enzymes, troponins, and other proteins
 are present in varying concentrations. Therefore, we prepared a
A modified upconversion microtiter plate reader (Chameleon, plasma pool from five healthy volunteers and determined the in-
Hidex, Turku, Finland) equipped with a 980-nm laser excitation trinsic cTnI concentration using a commercial test (28.8 pg mL−1 )
source[35] was used for measuring the integrated emission of Er- to distinguish it from spiked troponin concentrations.
doped UCNPs at 540 nm. (1) In the case of SA-PEG-UCNP labels, The immunoassay performance further depends on the care-
64 points were scanned in each well with a distance of 100 µm ful selection of antibodies and the assay configuration. We first

Adv. Healthcare Mater. 2021, 2100506 2100506 (4 of 9) © 2021 The Authors. Advanced Healthcare Materials published by Wiley-VCH GmbH
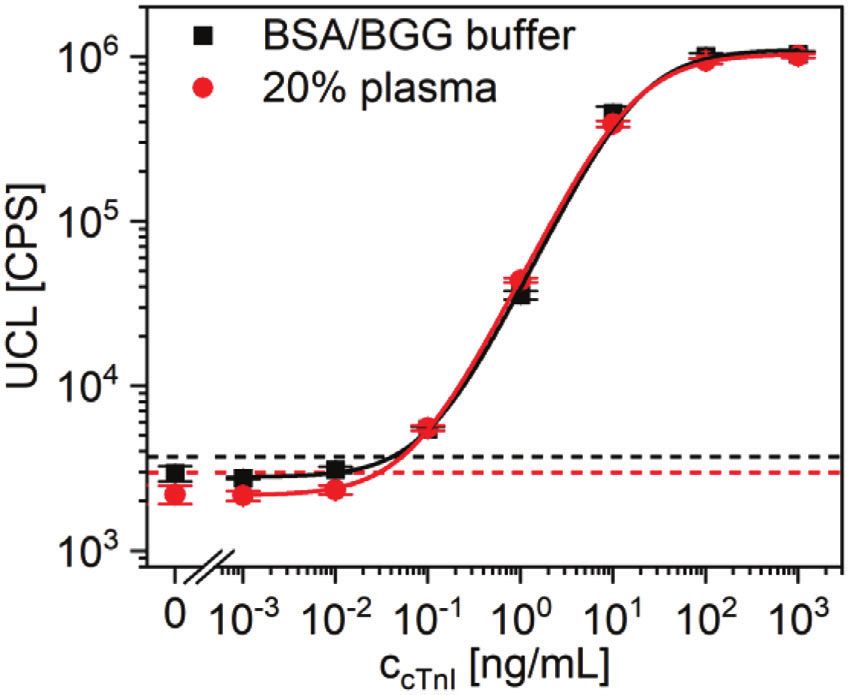
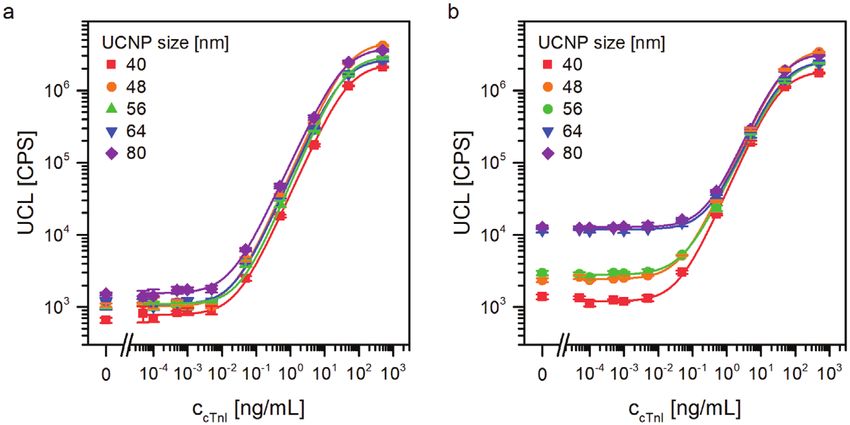
www.advancedsciencenews.com www.advhealthmat.de

 sensitivity in plasma (data not shown) and thus was used for fur-
 ther experiments.

 3.2. Effect of UCNP Label Size

 The size of the UCNP-based detection label is another important
 parameter influencing the immunoassay performance. On the
 one hand, the size should be small to (1) obtain stable nanoparti-
 cle dispersions, (2) reduce nonspecific binding, and (3) minimize
 their influence on the antibody–antigen interaction. On the other
 hand, a larger size of UCNPs strongly increases their brightness
 such that they can be more easily detected. The brightness is par-
 ticularly important for the detection of the labels at the single-
 nanoparticle level. Therefore, we conjugated UCNPs of 40, 48,
 56, 64, and 80 nm in diameter to mAb 625cc and used them as
Figure 2. Calibration curves of the analog ULISA using biotinylated labels for the detection of cTnI in buffer (Figure 3a) and in human
mAb 560cc and SA-PEG-UCNP labels. cTnI was serially diluted in either plasma (Figure 3b).
BSA/BGG buffer (LOD: 41 pg mL−1 ; bg: 3000 CPS), or first in 20% plasma
and then in BSA/BGG buffer (LOD: 30 pg mL−1 ; bg: 2200 CPS). The er-
 While the background signal of mAb-PAA-UCNP labels in
ror bars show the standard deviation of three replicate measurements BSA/BGG/IgG buffer was in general lower (
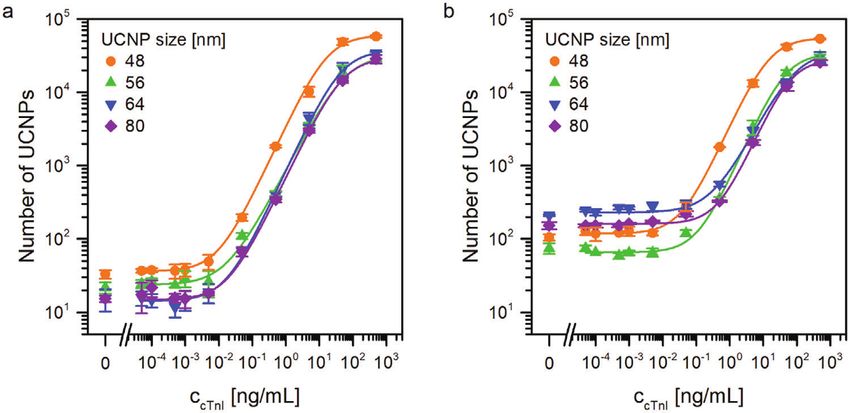
www.advancedsciencenews.com www.advhealthmat.de

Figure 3. Analog ULISA for the detection of cTnI using different sizes of UCNP-PAA conjugated to mAb 625cc in a) buffer and b) 20% plasma. The error
bars show standard deviations of replicate measurements in three wells (mean ± SD, n = 3).

Table 1. Summary of the analog and digital detection of cTnI in buffer and in human plasma using mAb-PAA-UCNP labels.

Detection of cTnI in buffer in plasma

 analog digital analog digital
 a)
UCNP size [nm] background LOD number of LOD background LOD number of LOD
 b) b)
 signal (CPS) [pg mL−1 ] UCNPs [pg mL−1 ] signal (CPS) [pg mL−1 ] UCNPs [pg mL−1 ]
 c) c) c) c)
40 658 6.0 n.d. n.d. 1387 11.9 n.d. n.d.
48 1055 3.8 33 3.3 2622 8.6 105 9.8
56 1038 8.3 21 7.0 2958 11.8 74 65.2
64 1129 13.3 15 17.4 11 211 57.2 209 17.2
80 1517 2.9 15 4.7 12 716 44.9 153 160.0
a) b)
 Average UCNP diameter determined by TEM (Figure S1, Supporting Information); Number of luminescent spots in the background images (0.2 mm2 ). Average of 3 wells
 c)
calculated from the sum of 9 images per well; Not determinable because smaller UCNPs are not bright enough for single-nanoparticle detection.

S6 in the Supporting Information). A minimal size of 48 nm was We also compared the assay performance in the digital mode
required for a reliable detection at the single-nanoparticle level. using SA-PEG-UCNP labels (Figure S7, Supporting Informa-
In both buffer and plasma, the distribution of the label bright- tion), but these labels did not improve the LOD compared to
ness was relatively uniform among different types and sizes of the analog readout (Figure 2), either. Therefore, independent
labels (Table S1, Supporting Information), indicating that the of the assay configuration and the type and size of the label,
number of aggregates present in the label samples was relatively the analog and digital readout resulted in similar LODs. The
small. number of nonspecifically bound mAb-PAA-UCNP labels in
 The calibration curves of the digital assays are summarized in the background image of the blank sample (Figure 5a) was
Figure 5. In contrast to the analog readout (Figure 3), the number about ten times lower than the number of nonspecifically bound
of nonspecifically bound labels was relatively independent of SA-PEG-UCNP labels (Figure S7, Supporting Information),
the label size in BSA/BGG/IgG buffer and in plasma (Figure 5, which was consistent with our earlier PSA experiments using
Table 1). While most of the increased background is a result of SA-PEG-UCNP labels.[26] The lower√ number of counting events
more nonspecific binding events in plasma, it should be noted (n) increased the Poisson noise ( n∕n) and affected the accuracy
that in the case of small nanoparticles, also the average bright- of the digital readout. For example, in the case of 64-nm UCNPs
ness per diffraction-limited spot increased, which indicates and 80-nm UCNP, the nonspecific binding was so low that only
that the plasma has an indirect effect on the label aggregation 15 diffraction-limited spots were detectable in the imaging area.
(Table S1, Supporting Information). As the background mainly A count of 15, however, results in a relatively high Poisson noise
determines the assay sensitivity, the sensitivity of the digital de- of 26%. In Figure 5a, the lowest baselines show the highest
tection in buffer was relatively similar among the different label fluctuations, due to the Poisson noise.
sizes. By contrast, the assay sensitivity decreased in plasma when An explanation why the digital readout improved the LOD of
using larger labels, with exception of the 64-nm conjugates. the PSA assay but not the LOD of the troponin assay may be that

Adv. Healthcare Mater. 2021, 2100506 2100506 (6 of 9) © 2021 The Authors. Advanced Healthcare Materials published by Wiley-VCH GmbH
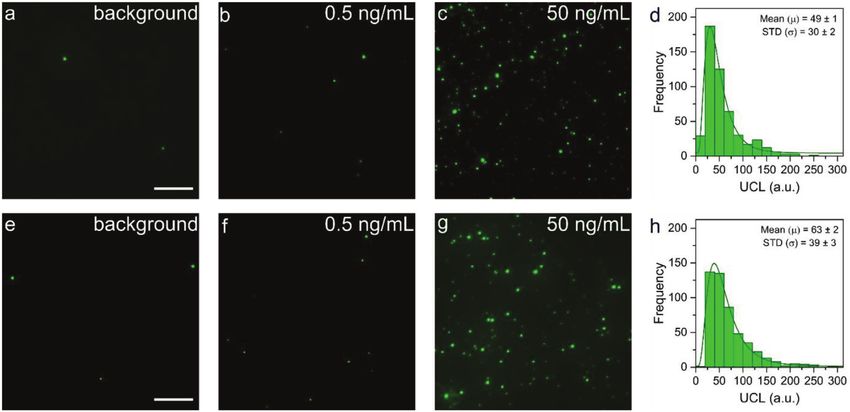
www.advancedsciencenews.com www.advhealthmat.de

Figure 4. Digital ULISA for the detection of troponin using mAb-PAA-UCNP labels (56 nm in diameter). a–c) Wide-field upconversion microscopy
images corresponding to serial dilutions of cTnI in BSA/BGG/IgG buffer. d) Brightness distribution histogram of 500 diffraction-limited spots recorded
at 50 ng mL−1 of cTnI. e–g) Wide-field upconversion microscopy images corresponding to serial cTnI dilutions in plasma. d) Brightness distribution
histogram of 500 diffraction-limited spots recorded at 50 ng mL−1 of cTnI in plasma. Scale bar: 10 µm.

Figure 5. Digital ULISA for the detection of troponin using different sizes of mAb 625cc-PAA-UCNP labels in a) BSA/BGG/IgG buffer and b) 20% plasma.
The error bars show the standard deviation of replicate measurements in three wells (mean ± SD, n = 3).

the label preparation was more uniform than in our previous PSA however, the ULISA results in a similar or even better assay per-
assay. Also, the differences in the particular antibody–antigen in- formance (Table 2).
teractions may explain why the digital assay confers a higher sen-
sitivity only for some analytes. In the analog mode, the PSA assay 4. Conclusions
was ten times more sensitive than the troponin assay. In the dig-
ital mode, the PSA assay was even 200 times more sensitive al- For the detection of troponin (cTnI), the advantages conferred
though the number of nonspecifically bound SA-PEG-UCNP la- by optimizing the assay configuration and the size, brightness,
bels was ten times higher than the number of mAb-PAA-UCNP and surface chemistry of UCNP labels were more important than
labels. Therefore, it seems to be the first requirement that the changing from an analog to a digital detection mode. In both
affinity of the antibody for the analyte is already very high be- cases, an LOD of 10 pg mL−1 in human plasma was obtained
fore the sensitivity can be further improved by the digital read- using mAb-PAA-UCNPs (48 nm in diameter). In contrast to
out. Compared to commercial cTnI assays and literature reports, conventional analog measurements, the digital readout allowed

Adv. Healthcare Mater. 2021, 2100506 2100506 (7 of 9) © 2021 The Authors. Advanced Healthcare Materials published by Wiley-VCH GmbH
www.advancedsciencenews.com www.advhealthmat.de

Table 2. Assay platforms for the detection of cTnI.

 Detection label LOD [pg mL−1 ] linear range [ng mL−1 ] Company/reference

Commercial assays Alkaline phosphatase 20 0.00–50.0 Abbott i-STAT[39]
 Alkaline phosphatase 10 0.01–100 Beckman Access 2[ 40 ]
 Alkaline phosphatase 10 Beckman Coulter DxI[ 41 ]
 Alkaline phosphatase 2.5 0.0023–27000 Beckman Coulter Access hs-cTnI[ 42 ]
 Horseradish peroxidase 12 Ortho-Clinical Diagnostics Vitros[ 43 ]
 Horseradish peroxidase 100 0.125–8.0 Invitrogen: Human Troponin I (TNNI3) ELISA[44]
Literature reports 5′-6-FAM-modified aptamer 70 0.1–6.0 [45]
 SERS using graphene oxide/gold NP 5 0.01–1000 [46]
 Cyclovoltammetry using whiskered nanofibers 40 0.5–100 [47]
 48-nm UCNP (analog/digital readout) 10 0.04–38 (analog readout) This work

for distinguishing between the number of nonspecific binding Data Availability Statement
events (observable as the number of diffraction-limited spots)
and the degree of label aggregation (observable as an increase The data that support the findings of this study are available from the cor-
 responding author upon reasonable request.
in the brightness of individual diffraction-limited spots). In par-
ticular, measurements in human plasma were strongly affected
by the size of the UCNP labels. While the number of nonspecific
binding events strongly increased with the label size, smaller la- Keywords
bels led to slightly more aggregated UCNPs. The digital readout anti-Stokes emission, cardiac arrest, lanthanide-doped nanomaterials,
also showed that a low background signal is important to achieve single molecule immunoassay, troponin
a high sensitivity, but ultimately, the digital assay is limited by
the counting noise. When comparing different analytes (troponin Received: March 16, 2021
and PSA) measured under similar experimental conditions, the Revised: June 22, 2021
particular antibody–analyte interaction had a stronger effect on Published online:
the assay sensitivity than the degree of nonspecific binding.

 [1] WHO, www.who.int/data/gho/data/themes/mortality-and-global-
Supporting Information health-estimates (accessed: July 2021).
Supporting Information is available from the Wiley Online Library or from [2] K. Thygesen, J. S. Alpert, A. S. Jaffe, M. L. Simoons, B. R. Chaitman,
the author. H. D. White, E. S. C. A. A. H. A. W. H. F. T. F. f. t. U. D. o. M. I. Joint,
 H. A. Katus, B. Lindahl, D. A. Morrow, P. M. Clemmensen, P. Johan-
 son, H. Hod, R. Underwood, J. J. Bax, R. O. Bonow, F. Pinto, R. J.
 Gibbons, K. A. Fox, D. Atar, L. K. Newby, M. Galvani, C. W. Hamm, B.
Acknowledgements F. Uretsky, P. G. Steg, W. Wijns, J. P. Bassand, P. Menasche, J. Ravk-
 ilde, E. M. Ohman, E. M. Antman, L. C. Wallentin, P. W. Armstrong,
J.C.B. and K.R. contributed equally to this work. This study was supported
 M. L. Simoons, J. L. Januzzi, M. S. Nieminen, M. Gheorghiade, G.
by the German Research Foundation (DFG GO 1968/6-2 and Heisen-
 Filippatos, R. V. Luepker, S. P. Fortmann, W. D. Rosamond, D. Levy,
berg Program GO 1968/7-1). Z.F. and P.S. acknowledge financial support
from the Ministry of Education, Youth and Sports of the Czech Republic D. Wood, S. C. Smith, D. Hu, J. L. Lopez-Sendon, R. M. Robertson, D.
(MEYS CR) under the projects CEITEC 2020 (LQ1601) and INTER-ACTION Weaver, M. Tendera, A. A. Bove, A. N. Parkhomenko, E. J. Vasilieva,
(LTAB19011). Z.F., A.H., and P.S. acknowledge grant 21-03156S from the S. Mendis, Circulation 2012, 126, 2020.
Czech Science Foundation. A.H. acknowledges institutional support RVO [3] S. Takeda, A. Yamashita, K. Maeda, Y. Maeda, Nature 2003, 424, 35.
68081715 from the Institute of Analytical Chemistry of the Czech Academy [4] I. A. Katrukha, Biochemistry (Moscow) 2013, 78, 1447.
of Sciences. K.R. and T.S. acknowledge the funding from Business Fin- [5] A. S. Jaffe, J. Ravkilde, R. Roberts, U. Naslund, F. S. Apple, M. Galvani,
land. CIISB research infrastructure project LM2018127 funded by MEYS H. Katus, Circulation 2000, 102, 1216.
CR is acknowledged for the financial support of the measurements at the [6] K. Thygesen, J. Mair, H. Katus, M. Plebani, P. Venge, P. Collinson, B.
CF Cryo-electron Microscopy and Tomography, and CF Nanobiotechnol- Lindahl, E. Giannitsis, Y. Hasin, M. Galvani, M. Tubaro, J. S. Alpert, L.
ogy. The authors thank Vít Vykoukal for taking the TEM images and Jaana M. Biasucci, W. Koenig, C. Mueller, K. Huber, C. Hamm, A. S. Jaffe,
Rosenberg (Department of Biotechnology, University of Turku) for provid- Eur. Heart J. 2010, 31, 2197.
ing biotin-isothiocyanate. [7] D. Westermann, J. T. Neumann, N. A. Sorensen, S. Blankenberg, Nat.
 Open access funding enabled and organized by Projekt DEAL. Rev. Cardiol. 2017, 14, 472.
 [8] F. S. Apple, Y. Sandoval, A. S. Jaffe, J. Ordonez-Llanos, Clin. Chem.
 2017, 63, 73.
Conflict of Interest [9] IFCC, https://www.ifcc.org/media/478592/high-sensitivity-cardiac-
 troponin-i-and-t-assay-analytical-characteristics-designated-by-
The authors declare no conflict of interest. manufacturer-v072020.pdf (accessed: July 2021).

Adv. Healthcare Mater. 2021, 2100506 2100506 (8 of 9) © 2021 The Authors. Advanced Healthcare Materials published by Wiley-VCH GmbH
www.advancedsciencenews.com www.advhealthmat.de

[10] E. Antman, J. P. Bassand, W. Klein, M. Ohman, J. L. Sendon, L. Rydén, [28] S. Lahtinen, A. Lyytikainen, N. Sirkka, H. Pakkila, T. Soukka,
 M. L. Simoons, M. Tendera, J. Am. Coll. Cardiol. 2000, 36, 959. Mikrochim. Acta 2018, 185, 220.
[11] F. S. Apple, C. A. Parvin, K. F. Buechler, R. H. Christenson, A. H. Wu, [29] N. Sirkka, A. Lyytikainen, T. Savukoski, T. Soukka, Anal. Chim. Acta
 A. S. Jaffe, Clin. Chem. 2005, 51, 2198. 2016, 925, 82.
[12] A. G. Katrukha, A. V. Bereznikova, V. L. Filatov, T. V. Esakova, O. V. [30] S. Eriksson, M. Junikka, P. Laitinen, K. Majamaa-Voltti, H. Alfthan, K.
 Kolosova, K. Pettersson, T. Lovgren, T. V. Bulargina, I. R. Trifonov, N. Pettersson, Clin. Chem. 2003, 49, 1095.
 A. Gratsiansky, K. Pulkki, L. M. Voipio-Pulkki, N. B. Gusev, Clin. Chem. [31] J. Ylikotila, J. L. Hellstrom, S. Eriksson, M. Vehniainen, L. Valimaa,
 1998, 44, 2433. H. Takalo, A. Bereznikova, K. Pettersson, Clin. Biochem. 2006, 39,
[13] M. Panteghini, W. Gerhardt, F. S. Apple, F. Dati, J. Ravkilde, A. H. Wu, 843.
 Clin. Chem. Lab. Med. 2001, 39, 175. [32] M. Pastucha, E. Odstrcilikova, A. Hlavacek, J. C. Brandmeier, V. Vyk-
[14] M. Panteghini, Clin. Chim. Acta 2009, 402, 88. oukal, J. Weisova, H. H. Gorris, P. Skladal, Z. Farka, IEEE J. Sel. Top.
[15] D. S. Herman, P. A. Kavsak, D. N. Greene, Am. J. Clin. Pathol. 2017, Quantum Electron. 2021, 27, 1.
 148, 281. [33] S. Lahtinen, M. Baldtzer Liisberg, K. Raikko, S. Krause, T. Soukka, T.
[16] F. S. Apple, P. O. Collinson, I. T. F. o. C. A. o. C. Biomarkers, Clin. Vosch, ACS Appl. Nano Mater. 2021, 4, 432.
 Chem. 2012, 58, 54. [34] L. Välimaa, K. Pettersson, M. Vehniäinen, M. Karp, T. Lövgren, Bio-
[17] C. Chenevier-Gobeaux, E. Bonnefoy-Cudraz, S. Charpentier, M. De- conjug. Chem. 2003, 14, 103.
 houx, G. Lefevre, C. Meune, P. Ray, S. F. C. S. T. w. Sfbc, Arch. Cardio- [35] A. Sedlmeier, A. Hlavacek, L. Birner, M. J. Mickert, V. Muhr, T. Hirsch,
 vasc. Dis. 2015, 108, 132. P. L. Corstjens, H. J. Tanke, T. Soukka, H. H. Gorris, Anal. Chem. 2016,
[18] Z. Farka, T. Jurik, D. Kovar, L. Trnkova, P. Skladal, Chem. Rev. 2017, 88, 1835.
 117, 9973. [36] T. Savukoski, J. Jacobino, P. Laitinen, B. Lindahl, P. Venge, N. Ris-
[19] Z. Farka, M. J. Mickert, A. Hlavacek, P. Skladal, H. H. Gorris, Anal. tiniemi, S. Wittfooth, K. Pettersson, Clin. Chem. Lab. Med. 2014, 52,
 Chem. 2017, 89, 11825. 1041.
[20] A. Hlavacek, Z. Farka, M. Hubner, V. Hornakova, D. Nemecek, R. [37] T. Savukoski, A. Twarda, S. Hellberg, N. Ristiniemi, S. Wittfooth, J.
 Niessner, P. Skladal, D. Knopp, H. H. Gorris, Anal. Chem. 2016, 88, Sinisalo, K. Pettersson, Clin. Chem. 2013, 59, 512.
 6011. [38] A. G. Katrukha, in Cardiac Markers (Ed.: A. H. B. Wu), 2nd Ed., Hu-
[21] V. Polachova, M. Pastucha, Z. Mikusova, M. J. Mickert, A. Hlavacek, mana Press, Totowa, NJ 2002, pp. 173.
 H. H. Gorris, P. Skladal, Z. Farka, Nanoscale 2019, 11, 8343. [39] G. Bozkaya, A. R. Sisman, Ann. Transl. Med. 2020, 8, 1237.
[22] R. Peltomaa, Z. Farka, M. J. Mickert, J. C. Brandmeier, M. Pastucha, [40] F. S. Apple, Y. Sandoval, A. S. Jaffe, J. Ordonez-Llanos, Clin. Chem.
 A. Hlavacek, M. Martinez-Orts, A. Canales, P. Skladal, E. Benito-Pena, 2017, 63, 73,.
 M. C. Moreno-Bondi, H. H. Gorris, Biosens. Bioelectron. 2020, 170, [41] F. S. Apple, M. M. Murakami, Clin. Chem. 2007, 53, 1558.
 112683. [42] S. Kim, S. J. Yoo, J. Kim, Clin. Biochem. 2020, 79, 48.
[23] U. Kostiv, V. Lobaz, J. Kucka, P. Svec, O. Sedlacek, M. Hruby, O. [43] F. S. Apple, R. Ler, A. Y. Chung, M. J. Berger, M. M. Murakami, Clin.
 Janouskova, P. Francova, V. Kolarova, L. Sefc, D. Horak, Nanoscale Chem. 2006, 52, 322.
 2017, 9, 16680. [44] https://www.thermofisher.com/elisa/product/Cardiac-Troponin-I-
[24] Z. Farka, M. J. Mickert, Z. Mikusova, A. Hlavacek, P. Bouchalova, W. TNNI3-Human-ELISA-Kit/EHTNNI3 (accessed: July 2021).
 Xu, P. Bouchal, P. Skladal, H. H. Gorris, Nanoscale 2020, 12, 8303. [45] D. Liu, X. Lu, Y. Yang, Y. Zhai, J. Zhang, L. Li, Anal. Bioanal. Chem.
[25] L. Xiong, T. Yang, Y. Yang, C. Xu, F. Li, Biomaterials 2010, 31, 7078. 2018, 410, 4285.
[26] M. J. Mickert, Z. Farka, U. Kostiv, A. Hlavacek, D. Horak, P. Skladal, [46] X. L. Fu, Y. Q. Wang, Y. M. Liu, H. T. Liu, L. W. Fu, J. H. Wen, J. W. Li,
 H. H. Gorris, Anal. Chem. 2019, 91, 9435. P. H. Wei, L. X. Chen, Analyst 2019, 144, 1582.
[27] Z. Farka, M. J. Mickert, M. Pastucha, Z. Mikusova, P. Skladal, H. H. [47] B. Rezaei, A. M. Shoushtari, M. Rabiee, L. Uzun, W. C. Mak, A. P. F.
 Gorris, Angew. Chem., Int. Ed. Engl. 2020, 59, 10746. Turner, Talanta 2018, 182, 178.

Adv. Healthcare Mater. 2021, 2100506 2100506 (9 of 9) © 2021 The Authors. Advanced Healthcare Materials published by Wiley-VCH GmbH
You can also read