Effects of interactivity and presentation on review-based explanations for recommendations
←
→
Page content transcription
If your browser does not render page correctly, please read the page content below
Effects of interactivity and presentation on
                                        review-based explanations for recommendations

                                                        Diana C. Hernandez-Bocanegra and Jürgen Ziegler

                                                       University of Duisburg-Essen, Duisburg 47057, Germany
                                                    {diana.hernandez-bocanegra,juergen.ziegler}@uni-due.de
arXiv:2105.11794v2 [cs.HC] 3 Sep 2021

                                                Abstract. User reviews have become an important source for recom-
                                                mending and explaining products or services. Particularly, providing ex-
                                                planations based on user reviews may improve users’ perception of a
                                                recommender system (RS). However, little is known about how review-
                                                based explanations can be effectively and efficiently presented to users
                                                of RS. We investigate the potential of interactive explanations in review-
                                                based RS in the domain of hotels, and propose an explanation scheme
                                                inspired by dialog models and formal argument structures. Additionally,
                                                we also address the combined effect of interactivity and different presen-
                                                tation styles (i.e. using only text, a bar chart or a table), as well as the
                                                influence that different user characteristics might have on users’ percep-
                                                tion of the system and its explanations. To such effect, we implemented
                                                a review-based RS using a matrix factorization explanatory method, and
                                                conducted a user study. Our results show that providing more interac-
                                                tive explanations in review-based RS has a significant positive influence
                                                on the perception of explanation quality, effectiveness and trust in the
                                                system by users, and that user characteristics such as rational decision-
                                                making style and social awareness also have a significant influence on
                                                this perception.

                                        Keywords: Recommender systems, explanations, user study, user characteris-
                                        tics

                                        1     Introduction
                                        Explaining the recommendations generated algorithmically by a recommender
                                        system (RS) has been shown to offer significant benefits for users with respect
                                        to factors such as transparency, decision support, or trust in the system [53,54].
                                        Many approaches to explaining the products or services suggested by an RS have
                                        been based on ratings provided by other users or properties of the recommended
                                        items, approaches related to collaborative and content-based filtering methods
                                        [24,56]. More recently, fueled by the advances in natural language processing,
                                        user-written reviews have received considerable attention as rich sources of in-
                                        formation about an item’s benefits and disadvantages, which can be utilized for
                                            The final publication is available at Springer via http://dx.doi.org/10.1007/
                                            978-3-030-85616-8_35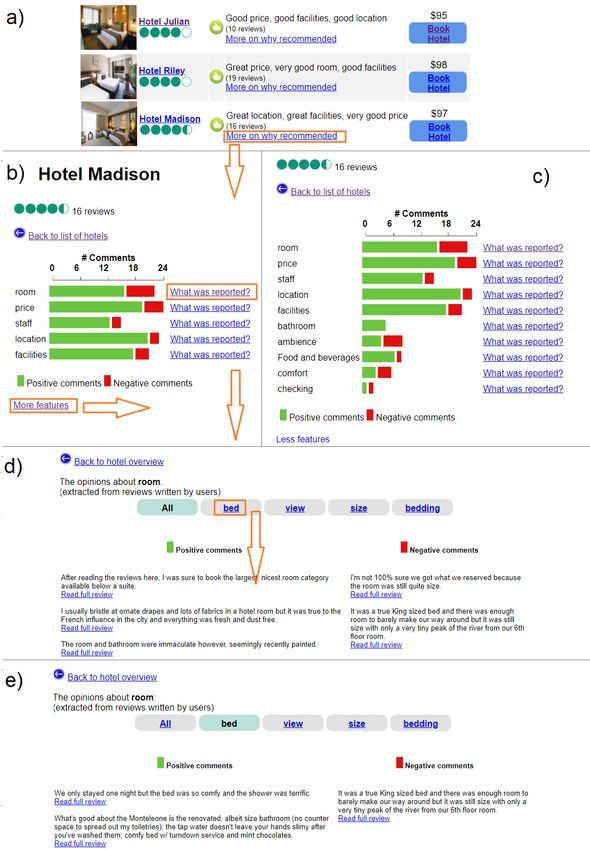
2      Hernandez-Bocanegra and Ziegler

explanatory purposes. Reviews are, however, subjective, and may be inconsistent
with the overall rating given by the user. Even when overcoming the challenge
of processing noisy review texts, the question of which review-based information
to show and how to present it is still largely open, partly due to the lack of
empirical conclusions on how to best present review-based explanations, just as
there is a general lack of user-centric evaluations of explanatory RS [43].
    While as yet no overall theoretical model of explainable recommendations has
been established, we propose to analyze explanations through the lens of argu-
mentation theory which has produced a wide range of models of argumentation
[5]. One class of argumentation models defines - with many variations - logical
structures of argumentative elements such as claims, evidence or facts support-
ing a claim, rebuttals and other components. A recommendation issued by a RS
can be considered a specific form of a claim, namely that the user will find the
recommended item useful or pleasing [18]. The role of an explanation is thus to
provide supportive evidence (or rebuttals) for this claim. Claims are, however,
also present in the individual user’s rating and opinions, which may require ex-
plaining their grounds as well, thus creating a complex multi-level argumentative
structure in an explainable RS, a concern also raised in [21]. A different branch
of argumentation theories [61] have abandoned the idea of static argumentation
models and propose a dialectical approach to argumentation, focusing more on
the process of exchanging arguments as part of a dialogue between two parties.
This approach has been applied in the formulation of models [26,60,37] that take
into account the social aspect of the explanatory process (an explainer transfers
knowledge to an explainee) [39]: a set of interactions, an exchange of questions
and answers. However, the practical application of these conceptual frameworks
and their actual benefit from the users’ perspective is yet to be determined,
mostly due to the lack of user-centered evaluations of implementations based on
such frameworks.
     Thus, we propose an interactive approach to argumentative explanations
based on reviews, which allows users to actively explore explanatory information,
while providing answers to some of their potential questions at different levels
of detail (i.e. why is this [item] recommended?, how customers rated [additional
features]?, what was reported on [feature]?). Moreover, we provide empirical
evidence of the effect that an implementation of this approach may have on
users’ perception, particularly in the hotels domain. More specifically, we aimed
to answer: RQ1: How do users perceive review-based explanations with different
degrees of interactivity, in terms of explanation quality, and of the transparency,
efficiency and trust in the system?
    Additionally, we also aimed to test the combined effect of explanation inter-
activity and different presentation styles, particularly: using only text, using a
bar chart or using a table, to show, among others, the distribution of positive
and negative comments on the quality of an item. Thus: RQ2: How do different
presentation styles influence users’ perception of review-based explanations with
different degrees of interactivity?
Effects of interactivity and presentation on review-based expl. for recomm. 3
Furthermore, we also addressed the influence that different user characteris-
tics might have on the perception of the proposed approach. Regardless of its
type, an explanation may not satisfy all possible explainees [50] . Moreover, in-
dividual user characteristics can lead to different perceptions of a RS [29,65], for
which we assumed that this would also be the case for explanations, as discussed
by [6,30,25]. Since a main objective of providing explanations is to support users
in their decision-making, investigating the effect of different personal styles to
perform such a process is of particular interest to us. Particularly, we focus on
the moderating effect of the rational and intuitive decision making styles [23],
the former characterized as a propensity to search for information and evalu-
ate alternatives exhaustively, and the latter by a quick processing based mostly
on hunches and feelings. Furthermore, since review-based explanations rely on
the expressed opinions of other users, we investigated the effects of the extent
to which users are inclined to adopt the perspective of others when making
decisions, a trait defined as social awareness by [10]. We also considered visual-
ization familiarity, i.e. the extent to which a user is familiar with graphical or
tabular representations of information. Consequently, RQ3: How do individual
differences in decision-making styles, social awareness or visualization familiarity
moderate the perception of review-based explanations with different degrees of
interactivity and presentation styles?
Finally, the contributions of this paper can be summarized as follows:
– We formulate a scheme for explanations as interactive argumentation in
review-based RS, inspired by dialogue models and formal argument struc-
tures.
– To test our research questions, we implemented an interface based on the
proposed scheme, and a RS based on a matrix factorization model (i.e. EFM,
[68]), and sentiment-based aspect detection, using the state of art natural
language processing model BERT ([15]).
– We provide empirical evidence of the effect of review-based interactive expla-
nations on users’ perception, as well as the influence of user characteristics
on such perception.
2 Related work
Review-based explanatory methods leverage user generated content, rich in de-
tailed evaluations on item features, which cannot be deduced from the general
ratings, thus enabling the generation of more detailed explanations, compared
to collaborative filtering (e.g. “Your neighbors’ ratings for this movie” [24]) and
content-based approaches (e.g. [56]). Review-based methods allow to provide:
1) verbal summaries of reviews, using abstractive summarization from natural
language generation (NLG) techniques [8,14], 2) a selection of helpful reviews
(or excerpts) that might be relevant to the user, detected using deep learning
techniques and attention mechanisms [11,17], 3) a statistical view of the pros
and cons of item features, usually using topic modelling or aspect-based sen-
timent analysis [64,68,16], information that is integrated to RS algorithms like4 Hernandez-Bocanegra and Ziegler
matrix or tensor factorization [68,4,62]) to generate both recommendations and
aspect-based explanations.
Our evaluation is based on the third approach, and is particularly related to
the model proposed by [68], since it facilitates getting statistical information on
users’ opinions, which has been proven to be useful for users [40,25], and can
be provided in explanations with different presentation styles (strictly verbal or
visual). Yet, the optimal way of presenting such information, either in a textual
(short summaries) or a graphical form (e.g., different types of bar charts) re-
mains unclear. In addition to information display factors, a second factor could
also influence users’ perception of the explanations: the possibility of interacting
with the system, to better understand the rationale for its predictions. Interac-
tive explanations have been already addressed in the field of explainable artificial
intelligence (XAI) (although to a much lesser extent compared to static expla-
nations [1]). Here, the dominant trend has been to provide mechanisms to check
the influence that specific features, points or data segments may have on the final
predictions of a machine learning (ML) algorithm, as in the work of [31,13,49].
However, despite the progress of XAI interactive approaches, their impact and
possibilities in explainable RS remain largely unexplored, as well as the empirical
validation of their effects on users. More specifically, the dominant ML interac-
tive approach differs from ours in at least two ways: 1) we use non-discrete and
non-categorical sources of information, subjective in nature and unstructured,
which, however, can be used to generate both textual and visual structured ar-
guments 2) such approach is designed to meet the needs of domain experts, i.e.
users with prior knowledge of artificial intelligence, while we aim to target the
general public.
Therefore, we explore in this paper an interactive explanation approach that
facilitates the exploration of arguments that support claims made by the system
(why an item is recommended). To this end, we adopted the definition of interac-
tivity stated by Steuer [52]: “extent to which users can participate in modifying
the form and content of mediated environment in real time”, and characterized
the degree of interactivity of proposed explanations through the Liu and Shrum
dimensions of interactivity [34]: active control and two-way communication. The
first is characterized by voluntary actions that can influence the user experi-
ence, while the second refers to the ability of two parties to communicate to
one another. Active control is reflected in our proposal by the possibility to use
hyperlinks and buttons, that allow users to access explanatory information at
different levels of detail at will, while two-way communication is represented by
the ability to indicate the system (through pre-defined questions) which are their
most relevant features, so the presentation of the explanatory content (answers)
is adjusted accordingly.
In order to formulate and test an interactive flow for review-based explana-
tions, we set our focus on argumentative models that may enable the two-way
communication desideratum. In contrast to static approaches to explanation, di-
alog models have been formulated conceptually [58,2,37,45], allowing arguments
over initial claims in explanations, within the scope of an interactive exchange ofEffects of interactivity and presentation on review-based expl. for recomm. 5
statements. Despite the potential benefit of using these models to increase users’
understanding of intelligent systems [39,63], their practical implementation in
RS (and in XAI in general) still lacks sufficient empirical validation [50,39,37].
This dialogical approach contrasts with other argumentative - though static -
explanation approaches [9,3,32,67,25] based on static schemes of argumentation
(e.g. [55,22]), where little can be done to indicate to the system that the explana-
tion has not been fully understood or accepted, and that additional information
is still required. Consequently, we formulated a scheme of interactive explana-
tions in review-based RS, combining elements from dialogue models and static
argument schemes (section 3), and conducted a user study to test the effect of
the proposed interactive approach.
Effects of interactivity have been studied widely in fields like online shopping
and advertising [34,51], and more specifically in the evaluation of critique-based
RS, where users are able to specify preferences for the system to recalculate
recommendations, which has been found to be beneficial for user experience
[12,36,35]. Despite the intuitive advantages that interactivity can bring, interac-
tivity does not always translate into a more positive attitude towards the system,
since it also depends on the context and the task performed [34]. Nevertheless,
it has also been shown that higher active control is beneficial in environments
involving information needs, and a clear goal in mind [34], which is actually our
case (i.e. deciding which hotel to book).
Furthermore, we hypothesized (in line with [34]) that a number of user char-
acteristics may moderate the effect of interactive functionalities, on the per-
ception of explanations. Particularly, we aimed to test the moderating effect of
decision-making styles and social awareness. In regard to the former, research has
shown that it is determined significantly by preferences and abilities to process
available information [19]. Particularly, we believe that users with a predomi-
nant rational decision making style would better perceive explanations with a
higher degree of interactivity, than explanations with less possibility of inter-
action, given their tendency to thoroughly explore information when making
decisions [23]. On the other hand, more intuitive users may not find the in-
teractive explanations very satisfactory, given their tendency to make decisions
through a quicker process [23], so that a first explanatory view would be suffi-
cient, and it would not be necessary to navigate in depth the arguments that
the system can offer. As for social awareness, and in line with results reported
by [25], we hypothesize that users with a higher social awareness may perceive
explanations with higher interactivity more positively, given their tendency to
take into account the opinions of others, and to adjust their own using those of
others, while choosing between various alternatives [48], which has been proved
to be beneficial during decision making [66], and is facilitated by our approach.
Finally, in regard to presentation styles, visual arguments (a combination
of visual and verbal information) may have a greater ”rhetorical power poten-
tial” than verbal arguments, due (among others) to their greater immediacy
(possibility of quick processing) [7]. This could especially benefit users with a
predominantly intuitive decision-making style, due to their usually quick manner6 Hernandez-Bocanegra and Ziegler
of making decisions, based mostly on first impressions [23]. However, users with
lower visual abilities might benefit less from a presentation based on images or
graphics [47,27]. Consequently, we believe that when exposed to graphic-based
explanation formats, higher interactive explanations may be beneficial to users
with lower visual familiarity, as they could access additional information to bet-
ter understand the explanations provided.
3 Scheme for explanations as interactive argumentation
in review-based RS
In order to evaluate our research questions, we designed an interaction scheme
for the exploration of explanatory arguments in review-based RS. This scheme
is inspired by dialog-based explanation models [59,60,37], in which instead of
a single issue of explanatory utterances, an explanation process is regarded as
an interaction, where a user could indicate when additional arguments are re-
quired, to increase their understanding of system claims. Walton [59,60] modeled
the possible actions as explanation requests or attempts, the former represent-
ing user questions, and the latter characterized as a set of assertions as system
response. On the other hand, Madumal et al. [37] noted that argumentation may
occur within explanation, and modeled the shift between explanatory and argu-
mentative dialogue, as well as the explanatory loops that can be triggered, when
follow-up questions arise. While this type of models may help to define the moves
allowed within an explanatory interaction, they offer little indication of how the
arguments within the interaction moves should be structured, to increase their
acceptance by users. To this end, we rely on the scheme by Habernal et al. [22],
an adaptation of the Toulmin model of argumentation [55], and formulated to
better represent the kind of arguments usually found in user-generated content.
This scheme involves: claim (conclusion of the argument), premise (a general
reason to accept a claim), backing (specific information or additional evidence
to support the claim), rebuttal (statement that attacks the claim) and refutation
(statement that attacks the rebuttal).
Our proposed scheme is shown in Figure 1. Unlike Walton, who modeled
explanatory movements as explanation requests and attempts, we considered an
explanation process as a sequence of argumentation attempts (the system intends
to provide arguments to explain something) followed by argument requests (the
user ask the system to provide - follow-up - arguments that support the claim
that user will find the recommended item useful). The realization of such a
scheme as a user interface developed for validation with users is depicted in
Figure 2.
As noted by [39] and [37], an explanatory dialogue can take place both
through verbal interactions and through a visual interface (non-verbal commu-
nication, or a combination of verbal and visual elements), which applies to both
questions and answers. As for argument presentation styles, while arguments
are usually associated with oral or written speech, arguments can also be com-
municated using visual representations (e.g. graphics or images) [7]. Thus, weEffects of interactivity and presentation on review-based expl. for recomm. 7 Fig. 1. Scheme for explanations as interactive argumentation in review-based RS. Blue boxes represent argumentation attempts by the system, green boxes the argument requests by users. Fig. 2. Screenshots of implemented system for user study. Orange arrows depict the sequence of allowed moves, pointing towards the next interface provided. Steps c,d,e are enabled only in study condition interactivity “high”. a) List of recommended hotels, and first level argumentation attempt; when clicking on “More on why recommended”, system displays: b-c) a second level argumentation attempt; when clicking on “What was reported?”, system shows d) a third level argumentation attempt on the chosen feature; when clicking on an feature button, system shows e) only statements on the fine-grained chosen feature.
8       Hernandez-Bocanegra and Ziegler

considered the following styles for the argumentation attempt “% of positive
and negative opinions”: 1) Table (Figures 3a, 3b), bar chart (Figures 3c, 3d),
and text (Figures 3e, 3f), the latter using the template proposed by [25], which
facilitates the display of rebuttal statements, which can hardly be represented
graphically.

Fig. 3. Manipulation of presentation style in combination with interactivity, in user
study. Top: table, middle bar chart, bottom text. Left: interactivity high, right: interac-
tivity low.

4    User study

To answer our research questions, we implemented a RS that reflects the scheme
described in section 3, and conducted a user study to compare users’ perception
of the overall system (in terms of transparency, effectiveness and trust), and of
the explanations (in terms of explanation confidence, transparency, persuasive-
ness, satisfaction and sufficiency). We considered the factor interactivity, and
the values “high” (users could make all possible argument requests (see Fig-
ures 1 and 2), and “low” (users could only make the initial argument request
“more on why recommended?”). To validate the effect of factor presentation
style, we considered the values: table (Figures 3 a,b), bar chart (Figures 3 c,d)
and text (Figures 3 e,f). The study follows a 3x2 between-subjects design, and
each participant was assigned randomly to one of six conditions (combination of
interactivity and presentation style). We hypothesized:
    H1: Users’ perception of the system and its explanations is more positive
when they are given explanations with higher interactivity.
    H2: Users with a predominantly rational decision style perceive explanations
with higher interactivity more positively than less rational decision makers.
    H3: Less intuitive users perceive explanations with higher interactivity more
positively, compared to more intuitive users.
    H4: Users with greater social awareness perceive higher interactive explana-
tions more positively than users with less social awareness.
    H5a: Users with a predominantly intuitive decision-making style or H5b
a greater visualization familiarity will prefer bar chart explanations over text
explanations, regardless of interactivity.
Effects of interactivity and presentation on review-based expl. for recomm. 9
H6: Users who are less familiar with data visualization will perceive explana-
tions with higher interactivity more positively, particularly in the case of more
challenging visualizations such as bar charts.
4.1 Participants
We recruited 170 participants (66 female, mean age 37.61 and range between 18
and 72) through Amazon Mechanical Turk. We restricted the execution of the
task to workers located in the U.S, with a HIT (Human Intelligence Task) ap-
proval rate greater than 98%, and a number of HITs approved greater than 500.
We applied a quality check to select participants with quality survey responses
(we asked validation questions to check attentiveness within questionnaires, and
questions related to the content of the system). We discard participants with less
than 10 (out of 12) correct answers, or no effective interaction with the system
(checked in logs). The responses of 27 of the 197 initial participants were then
discarded for a final sample of 170 subjects (statistical power of 90%, α =0.05).
Participants were rewarded with $1.4 plus a bonus up to $0.40 depending on the
quality of their response to the question “Why did you choose this hotel?” set
at the end of the survey. Time devoted to the task by participants (in minutes):
M=10.88, SD= 1.62.
4.2 Dataset and Implemented system
Dataset and aspect annotation: ArguAna [57], includes hotel reviews and rat-
ings from TripAdvisor; sentiment and explicit features are annotated sentence
wise. We categorized the explicit features in 10 general features (room, price,
staff, location, facilities, bathroom, ambience, food and beverages, comfort and
checking), with the help of 2 annotators (Krippendorff’s alpha of 0.72), aiming
to train a classifier to detect the main aspect addressed in a sentence (e.g. “I
loved the bedding” would be classified as room).
Aspect-based sentiment detection: We trained a BERT classifier [15] to detect
the general feature addressed within a sentence: we used a 12-layer model (Bert-
ForSequenceClassification), 6274 training sentences, 1569 test sentences, F-score
0.84 (macro avg.). We also trained a BERT classifier to detect the sentiment po-
larity, using a 12-layer model (BertForSequenceClassification), 22674 training
sentences, 5632 test sentences, F -score 0.94 (macro avg.). Classifier was used to
1) consolidate the quality of hotels and relevance of aspects to users (see Figures
2b, 2d), and 2) to present participants with negative and positive excerpts from
reviews regarding a chosen feature (Figures 2d, 2e).
Explainable RS method : We implemented the Explicit Factor Model (EFM)
[68], a review-based matrix factorization (MF) method to generate both recom-
mendations and explanations. The rating matrix consisted of 1284 items and
884 users extracted from the ArguAna dataset (only users with at least 5 writ-
ten reviews were included), for a total of 5210 ratings. Item quality and user
preferences matrices were consolidated using the sentiment detection described10 Hernandez-Bocanegra and Ziegler
previously. The number of explicit features was set to 10. Model-specific hyper-
parameters were selected via grid-search-like optimization. After 100 iterations,
we reached an RMSE of 1.27. Finally, values of predicted rating matrix were used
to sort the list of recommendations and also shown within explanations (average
hotel rating represented with 1-5 green circles). Values of the quality matrix
were also used to calculate the percentages of positive and negative comments
regarding different features (Figure 3).
Personalization mechanism: To reduce implications of the cold start prob-
lem [46] (system does not have enough information about the user to generate
an adequate profile and thus, personalized recommendations), participants were
asked for the five hotel features that mattered most to them, in order of im-
portance. The system calculated a similarity measure, to detect users within
the EFM preference matrix with a similar order of preferences. Then the most
similar user was used as a proxy to generate recommendations, i.e. we selected
the predicted ratings of this proxy user, and used them to sort recommendations
and features within explanations.
4.3 Questionnaires
Evaluation: We utilized items from [44] to evaluate the perception of system
transparency (construct transparency, user understands why items were recom-
mended), of system effectiveness [29] (internal reliability Cronbach’s α = 0.85,
construct perceived system effectiveness, system is useful and helps the user to
make better choices), and of trust in the system [38] (α = 0.90, constructs trusting
beliefs, user considers the system to be honest and trusts its recommendations;
and trusting intentions, user willing to share information). We used the user
experience items (UXP) of [30] to address explanations reception, which we will
refer to as explanation quality (α = 0.82), comprising: explanation confidence
(user is confident that she/he would like the recommended item), explanation
transparency (explanation makes the recommendation process clear), explana-
tion satisfaction (user would enjoy a system if recommendations are presented
this way), and explanation persuasiveness (explanations are convincing). We
added an item adapted from [17] (explanations provided are sufficient to make
a decision) to evaluate explanation sufficiency. All items were measured with a
1-5 Likert-scale (1: Strongly disagree, 5: Strongly agree).
User characteristics: We used all the items of the Rational and Intuitive
Decision Styles Scale [23] (internal reliability Cronbach’s α = 0.84 and α = 0.92,
respectively), the scale of the social awareness competency proposed by [10] (α
= 0.70), and the visualization familiarity items proposed by [30] (α = 0.86). All
items were measured with a 1-5 Likert-scale (1: Strongly disagree, 5: Strongly
agree).
4.4 Procedure
Instructions indicated that a list of hotels reflecting the results of a hypothetical
hotels’ search and within the same price range would be presented (i.e no filtersEffects of interactivity and presentation on review-based expl. for recomm. 11
to search hotels were offered to participants), and that they could click on the
name of a desired hotel to see general information about it. However, we asked,
as we were more interested in their views on the explanations given for each
recommendation, to click on the ”More on why recommended” links of hotels
they might be interested in, and to explore the information provided. No further
instructions were given regarding how to interact with the different interaction
options, since we were interested to address to what extent the users used them
or not. Users were instructed to indicate which hotel they would finally choose,
and to write a few sentences reporting their reasons for it, for which a bonus up
to $0.4 would be paid, depending on the quality of this response, with the aim of
achieving a more motivated choice by the participants, as well as to encourage
a more effective interaction with the system. We then presented a cover story,
which sought to establish a common starting point in terms of travel motivation
(a holiday trip). Next, we presented to the participants the system showing a list
of 30 recommended hotels (sorted by predicted rating), and their corresponding
personalized explanations (system implementation details in section 4.2). Finally,
evaluation and validation questions were presented, plus an open-ended one,
asking for general opinions and suggestions about the explanations.
4.5 Data analysis
We evaluated the effect that interactivity and presentation style (independent
variables IVs) may have on 2 different levels: 1) overall system perception, and
2) perception of specific aspects of explanations, and to what extent user charac-
teristics (regarded as moderators or covariates) could influence such perception
(rational and intuitive decision-making style, social awareness and visualization
familiarity).
In case 1) the dependent variables (DVs) are evaluation scores on: system
transparency (user understands why items were recommended), effectiveness
(system helps user to make better decisions), trust (user considers the system to
be honest and trusts its recommendations) and explanation quality, a variable
calculated as the average of scores reported on specific aspects of explanations:
satisfaction, transparency, persuasiveness, confidence and sufficiency.
In case 2) the DVs are addressed explanation-wise: confidence (explanation
makes user confident that she/he will like the recommendation), explanation
transparency (explanation makes the recommendation process clear), satisfac-
tion (user would enjoy a system if recommendations are presented this way),
persuasiveness (explanations are convincing), and sufficiency (explanations pro-
vided are sufficient to make a decision).
Scores of the rational and the intuitive decision making styles, social aware-
ness and visualization familiarity for each individual as the average of the re-
ported values for the items of every scale. Internal consistency (Cronbach’s al-
pha) was checked for system evaluation and user characteristics constructs (see
section 4.3).
Overall system perception: Given that DVs are continuous and correlated (see
Table 1), a MANCOVA analysis was performed. Subsequent ANCOVA were12 Hernandez-Bocanegra and Ziegler
performed to test main effects of IVs and covariates, as well as the effect of
interactions between them. Q-Q plots of residuals were checked to validate the
adequacy of the analysis.
Perception of explanations: DVs are ordinal (scores are the reported answers
to single questionnaire items), thus we performed ordinal logistic regressions
to test influence on DVs by predictor variables (IVs and covariates), no multi-
collinearity was tested, as well as Q-Q plots of residuals. DVs are also correlated
(see Table 2), so significant tests were conducted using Bonferroni adjusted alpha
levels of .01 (.05/5).
Use of interactive options: Calculated based on system activity logs. A Mann-
Whitney U test was used to compare distributions of users characteristics who
used or not use such options.
5 Results
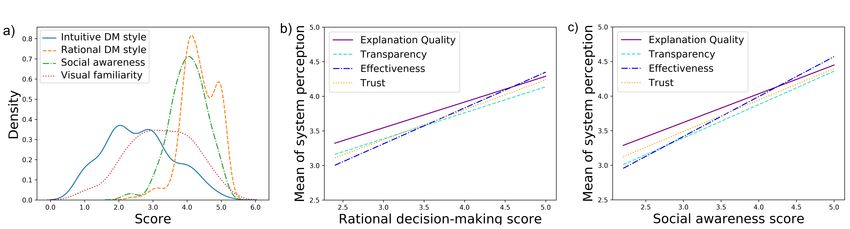
5.1 Evaluation and User Characteristics Scores
The average evaluation scores by presentation style and interactivity are shown
in Tables 1 and 2. Distributions of the scores of rational (M = 4.35, SD= 0.50)
and intuitive (M = 2.59, SD= 0.98) decision making styles, social awareness
(M = 4.04, SD= 0.53) and visualization familiarity (M = 3.23, SD= 0.95) are
depicted in Figure 4a.
Table 1. Mean values and standard deviations of perception on the overall system,
per presentation style and interactivity (n=170), pEffects of interactivity and presentation on review-based expl. for recomm. 13 Table 2. Mean values and standard deviations of perception on explanation specific aspects, per presentation style and interactivity (n=170), p
14     Hernandez-Bocanegra and Ziegler

5.3   Perception of Explanations

Interactivity: We found a main significant effect of interactivity; here, the odds of
participants reporting higher values of explanation sufficiency when interactivity
high was 2.30 (95% CI, 1.26 to 4.29) times that of interactivity low, a statistically
significant effect, Wald χ2(1) = 7.32, p = .007. We observed a similar pattern
in relation to explanation confidence (p = .017), explanation transparency (p =
.043) and explanation satisfaction (p = .041). However, this association (despite
p < .05) is non-significant after Bonferroni correction (corrected p < 0.01).
    Presentation style: We found no significant main effect of presentation style.
    Additionally, we observed a possible interaction (p
Effects of interactivity and presentation on review-based expl. for recomm. 15
Fig. 5. Interaction plots (fitted means of individual scores) for perception of expla-
nation: a) sufficiency, interaction between interactivity and rational decision-making
style. b) satisfaction, interaction between presentation and intuitive decision-making.
c) persuasiveness, interaction between interactivity and social awareness. d) satisfac-
tion, interaction between interactivity and visualization familiarity.
6 Discussion
Our results show that greater interactivity has a significantly positive effect on
users’ perception, in terms of system effectiveness and trust, as well as of explana-
tion quality, compared to explanations with lower interactivity, thus confirming
our H1. We believe that the interactivity aspects addressed in our proposal
could play a determining role in the observed effect, namely: active control and
two-way communication. The former, by enabling users to be in control of which
argumentative content to display; the latter by enabling them to indicate the
system which argumentative statements require further elaboration, and which
features are of real relevance at the time of making the decision, an approach
that might contribute to a better acceptance and understanding of explanations,
as predicted by dialog models of explanation [60,26].
However, the benefit and actual use of interactive options in review-based
explanations might be influenced by individual differences, as discussed by [34]
for the scope of online advertising and shopping. In particular, we found that
the way people process information when making decisions would play an im-
portant role in the perception of interactive review-based explanations. More
precisely, and in line with H2, we found that greater interactivity might have a
more positive effect on the perception of explanation sufficiency by more rational
users, which is explained by the propensity of people with a predominant ratio-
nal decision-making style, to search for information and evaluate alternatives16 Hernandez-Bocanegra and Ziegler
exhaustively [23]. However, and contrary to our expectations, we observed that
the degree of intuitive decision style did not moderate the effect of interactivity
on users’ perception, so we cannot confirm our H3. In this regard, despite the
predominant quick process based mostly on hunches that characterize more in-
tuitive decision-makers [23], we believe that looking at some verbatim excerpts
from other users’ reviews may also be of benefit to them, as they could corrob-
orate whether their hunches are aligned with the system’s assertions, although
they may not do so as extensively as less intuitive users would do.
Additionally, in line with our H4 and results reported by [25], we observed
that social awareness might moderate the effect of interactivity on explanation
persuasiveness. Here, results suggest that participants with a higher disposition
to listen and take into account others’ opinions, tend to perceive higher inter-
active explanations as more persuasive, which seems a consequence of the pos-
sibility to read reports of personal experiences by customers, who have already
made use of the recommended items. This represents a potential advantage in
the evaluation of experience goods like hotels, which is characterized by a greater
reliance on word-of-mouth [41,28].
In line with H5a, our observations suggest that intuitive decision style might
mediate the effect of presentation on explanation satisfaction, independent of in-
teractivity. Particularly, explanatory arguments presented as a bar chart seemed
to be perceived as more satisfactory to more intuitive users, than the presen-
tation using a table or only text, presumably due to their greater immediacy
[7], thus facilitating the rapid decision-making process that characterizes more
intuitive users. However, contrary to our expectations, we cannot conclude that
users with more visualization familiarity will perceive the bar chart explanations
better than the text-based ones (H5b). One possible reason could be that a text-
based format makes it easier to visualize argumentative components as rebuttal
and refutation, which could lead to a higher acceptance of an argument, as ad-
vocated by argumentation theory ([22]), but could hardly be expressed through
graph-based formats.
Additionally, although users with lower visualization familiarity tended to
use the interaction options more, we cannot confirm our hypothesis that those
users would perceive graphic-based explanations (i.e. bar chart) better when
more interactive options are offered, (H6). Actually, we found that users with
more experience with data visualization reported a more positive perception for
explanations with higher interactivity, independent of presentation style. We be-
lieve this is not due to difficulties understanding the explanations (as we thought
would be the case for users with less visualization familiarity), but because higher
interactivity facilitated a structured navigation and more appealing display of
the data, which would not be as easy to process or useful if presented on a single
static explanation.
Overall, we observed a main effect of rational decision-making style and social
awareness in the perception of the system and all the proposed explanations.
This suggests that review-based explanations seem to benefit more the users
who tend to evaluate information thoroughly and take into account the opinionsEffects of interactivity and presentation on review-based expl. for recomm. 17
of others when making decisions, compared to users who use a more shallow
information-seeking process.
Interactivity and transparency perception. Despite the main effect of inter-
activity on the overall perception of the system and its explanations, the mean
perception of system transparency (user understands why items were recom-
mended) is only slightly higher for the interactivity high condition than for the
low condition. We believe that the reason might be two-fold: 1) Walton’s [60]
suggests to include an explicit mechanism to confirm effective understanding by
the user, so that if this has not yet been achieved, the iterative cycle of user
questions and system responses may continue. In consequence, we believe that
a more flexible approach in which the user could, for example, write their own
questions, rather than the bounded link-based options, might contribute in this
regard. And 2) users may be also interested in understanding the reasons why
the hotel x is better than hotel y. This would not only be in line with the view
of authors who claim that the why-questions ask for a contrastive explanation
(“why P rather than Q?”) [26,33,39], but also concurs with some participants’
suggestions, that options for comparison would be very useful, e.g. “It’d be easier
if information wasn’t on each separate page, too. I’d like an option to compare
and contrast options”.
Use of interaction options. We observed that almost half of participants under
the condition interactivity “high” actually used the interaction options, although
participants were not explicitly instructed to use them, so it can reasonably be
inferred that their use was mainly voluntary. It is critical, however, that these
options are named appropriately, indicating clearly their destinations (as stated
by [20] guidelines), to increase the probability of their use, as evidenced by the
lack of use of the option to read reviews excerpts in the text condition (Fig. 3e).
Additionally, some of the users assigned to the low interactivity condition
pointed to 1) the lack of access to additional information in connection to the
explanations (particularly customer reviews) as a disadvantage, with about a
quarter of those participants writing suggestions on the subject, e.g. “I would
prefer to read the actual reviews and understand why ratings were what they
were”, or 2) insufficiency of aggregated percentages of positive and negative
opinions to adequately explain recommendations, e.g. “I feel they maybe could
have a lot more information more on SPECIFICALLY what they say about
the room instead of just an overall aggregation”. In this regard, it is important
to note though, that participants of all conditions had access to the full hotel
reviews (they were included in the general view of each hotel).
Practical implications. Our approach was specifically tested in hotels domain,
however, since it allows users to navigate from aggregated accounts of other
users’ opinions to detailed extracts of individual reviews, we believe it might
generalize adequately to domains that involve the evaluation of experience goods,
i.e. those whose attributes can only be evaluated when the product has already
been experienced [42], and where the search for information is characterized by
a greater reliance on word-of-mouth [41,28] for example restaurants, movies or
books. Additionally, our findings lead to the following practical implications,18 Hernandez-Bocanegra and Ziegler
to be considered in the design of review-based explanations in RS involving
experience goods:
– Providing interactive explanations resembling an argumentative communica-
tion between system and user could contribute to a better perception of the
system. This could be implemented using web navigation options, e.g. links
or buttons that indicate explicitly their destination, indicating if possible, a
why or what question that will be answered by the system afterwards.
– Presenting both aggregated opinion statistics and excerpts of comments fil-
tered by feature, as part of an interactive explanation, is a beneficial way
to provide explanations sufficient in content, while avoiding overwhelming
users with irrelevant data in a single step or screen.
– Given the practical difficulty of detecting user characteristics (e.g., decision-
making style or visualization familiarity) by the system, we suggest interac-
tive options to be considered, not only to provide in-depth arguments or to
detect the relevance of features to the user, but also to modify the presen-
tation style of argument components.
7 Conclusions and future work
In this paper, we have presented a scheme for explanations as interactive argu-
mentation in review-based RS, inspired by dialogue explanation models and for-
mal argument schemes, that allows users to navigate from aggregated accounts
of other users’ opinions to detailed extracts of individual reviews, in order to
facilitate a better understanding of the claims made by the RS. We tested an
implementation of the proposed scheme in the hotels domain, and found that
more interactive explanations contributed to a more positive perception of ef-
fectiveness and trust in the system. We also found that individual differences in
terms of user characteristics (e.g. decision-making style, social awareness and vi-
sualization familiarity) may lead to differences in the perception of the proposed
implementation.
While our proposal suggests a first step towards an effective implementation
of interactive explanations for review-based RS, some important improvements
can still be considered, to increase users’ perception of transparency, as pointed
out in the previous section. Here, the provision of links with predefined why,
how or what questions, while practical, could be improved, for example, with
the possibility for the user to ask more flexible questions, even in natural lan-
guage. Thus, as future work, we plan to leverage advances of conversational
agents (i.e. chatbots), natural language processing and natural language gener-
ation techniques, such as question answering and automatic summarization, to
enhance the implementation proposed in this paper.
It is important to note that our scheme entails an explanatory dialogue on
a single-item level. However, we plan in the future to investigate the effect of
contrastive dialogue-based explanations of the type “Why P rather than not-
P?”. In this respect, we believe that this type of explanation can be leveraged to
enable users further possibilities to influence the recommendation process itself,Effects of interactivity and presentation on review-based expl. for recomm. 19
e.g. requesting for a more refined set of recommendations that better suit their
preferences, based on an explanatory contrast between the different options. The
above might result in greater satisfaction with the overall system, as has been
proven with interactive RS in the past, but this time from the explanations as
such.
Acknowledgements This work was funded by the German Research Founda-
tion (DFG) under grant No. GRK 2167, Research Training Group “User-Centred
Social Media”.
References
1. Abdul, A., Vermeulen, J., Wang, D., Lim, B.Y., Kankanhalli, M.: Trends and
trajectories for explainable, accountable and intelligible systems: An hci research
agenda. In: Proceedings of the 2018 CHI Conference on Human Factors in Com-
puting Systems - CHI 18. p. 1–18 (2018)
2. Arioua, A., Croitoru, M.: Formalizing explanatory dialogues. Scalable Uncertainty
Management p. 282–297 (2015)
3. Bader, R., Woerndl, W., Karitnig, A., Leitner, G.: Designing an explanation inter-
face for proactive recommendations in automotive scenarios. In: Proceedings of the
19th International Conference on User Modeling, Adaptation, and Personalization
(UMAP’11). pp. 92–104 (2012)
4. Bauman, K., Liu, B., Tuzhilin, A.: Aspect based recommendations: Recommending
items with the most valuable aspects based on user reviews. In: Proceedings of the
23rd ACM SIGKDD International Conference on Knowledge Discovery and Data
Mining. p. 717–725 (2017)
5. Bentahar, J., Moulin, B., Belanger, M.: A taxonomy of argumentation models used
for knowledge representation. Artificial Intelligence Review 33(3), 211–259 (2010)
6. Berkovsky, S., Taib, R., Conway, D.: How to recommend?: User trust factors in
movie recommender systems. In: Proceedings of the 22nd International Conference
on Intelligent User Interfaces. p. 287–300 (2017)
7. Blair, J.A.: The possibility and actuality of visual arguments. Tindale C. (eds)
Groundwork in the Theory of Argumentation 21, 205–223 (2012)
8. Carenini, G., Cheung, J.C.K., Pauls, A.: Multi document summarization of evalu-
ative text. In: Computational Intelligence. vol. 29, pp. 545–574 (2013)
9. Carenini, G., Moore, J.D.: Generating and evaluating evaluative arguments. In:
Artif. Intell. vol. 170, pp. 925–952 (2006)
10. Casel: 2013 casel guide: Effective social and emotional learning programs -
preschool and elementary school edition, collaborative for academic social and
emotional learning (2013)
11. Chen, C., Zhang, M., Liu, Y., Ma., S.: Neural attentional rating regression with
review-level explanations. In: Proceedings of the 2018 World Wide Web Confer-
ence on World Wide Web. International World Wide Web Conferences Steering
Committee. p. 1583–1592 (2018)
12. Chen, L., Pu, P.: Critiquing-based recommenders: survey and emerging trends
22(1–2), 3085–3094 (2014)20 Hernandez-Bocanegra and Ziegler
13. Cheng, H.F., Wang, R., Zhang, Z., O’Connell, F., Gray, T., Harper, F.M., Zhu, H.:
Explaining decision-making algorithms through ui: Strategies to help non-expert
stakeholders. In: Proceedings of the 2019 CHI Conference on Human Factors in
Computing Systems. p. 1–12 (2019)
14. Costa, F., Ouyang, S., Dolog, P., Lawlor, A.: Automatic generation of natural
language explanations. In: Proceedings of the 23rd International Conference on
Intelligent User Interfaces Companion. p. 57:1–57:2 (2018)
15. Devlin, J., Chang, M.W., Lee, K., Toutanova, K.: Bert: Pre-training of deep bidi-
rectional transformers for language understanding (2019)
16. Dong, R., Mahony, M.P.O., Smyth, B.: Further experiments in opinionated prod-
uct recommendation. In: Case Based Reasoning Research and Development. p.
110–124. Springer International Publishing (2014)
17. Donkers, T., Kleemann, T., Ziegler, J.: Explaining recommendations by means
of aspect-based transparent memories. In: Proceedings of the 25th International
Conference on Intelligent User Interfaces. p. 166–176 (2020)
18. Donkers, T., Ziegler, J.: Leveraging arguments in user reviews for generating and
explaining recommendations. Datenbank-Spektrum 20(2), 181–187 (2020)
19. Driver, M.J., Brousseau, K.E., Hunsaker, P.L.: The dynamic decision maker (1990)
20. Farkas, D.K., Farkas, J.B.: Guidelines for designing web navigation 47(3), 341–358
(2000)
21. Friedrich, G., Zanker, M.: A taxonomy for generating explanations in recommender
systems 32(3), 90–98 (2011)
22. Habernal, I., Gurevych, I.: Argumentation mining in user-generated web discourse.
In: Computational Linguistics 43. vol. 1, p. 125–179 (2017)
23. Hamilton, K., Shih, S.I., Mohammed, S.: The development and validation of the ra-
tional and intuitive decision styles scale. Journal of Personality Assessment 98(5),
523–535 (2016)
24. Herlocker, J.L., Konstan, J.A., Riedl, J.: Explaining collaborative filtering recom-
mendations. In: Proceedings of the 2000 ACM conference on Computer supported
cooperative work. p. 241–250. ACM (2000)
25. Hernandez-Bocanegra, D.C., Donkers, T., Ziegler, J.: Effects of argumentative ex-
planation types on the perception of review-based recommendations. In: Adjunct
Proceedings of the 28th ACM Conference on User Modeling, Adaptation and Per-
sonalization (UMAP ’20 Adjunct) (2020)
26. Hilton, D.J.: Conversational processes and causal explanation 107(1), 65–81 (1990)
27. Kirby, J.R., Moore, P.J., Schofield, N.J.: Verbal and visual learning styles. Con-
temporary Educational Psychology 12(2), 169–184 (1988)
28. Klein, L.: Evaluating the potential of interactivemedia through a new lens: Search
versus experience goods. In: Journal of Business Research. vol. 41, p. 195–203
(1998)
29. Knijnenburg, B.P., Willemsen, M.C., Gantner, Z., Soncu, H., Newell, C.: Explain-
ing the user experience of recommender systems. In: User Modeling and User-
Adapted Interaction. p. 441–504 (2012)
30. Kouki, P., Schaffer, J., Pujara, J., O’Donovan, J., Getoor, L.: Personalized ex-
planations for hybrid recommender systems. In: Proceedings of 24th International
Conference on Intelligent User Interfaces (IUI 19). p. 379–390. ACM (2019)
31. Krause, J., Perer, A., Ng, K.: Interacting with predictions: Visual inspection of
black-box machine learning models. In: Proceedings of the 2016 CHI Conference
on Human Factors in Computing Systems. p. 5686–5697 (2016)Effects of interactivity and presentation on review-based expl. for recomm. 21
32. Lamche, B., Adigüzel, U., Wörndl, W.: Interactive explanations in mobile shop-
ping recommender systems. In: Proceedings of the 4th International Workshop on
Personalization Approaches in Learning Environments (PALE’14), held in con-
junction with the 22nd International Conference on User Modeling, Adaptation,
and Personalization (UMAP’14). pp. 92–104 (2012)
33. Lipton, P.: Contrastive explanation. Royal Institute of Philosophy Supplement 27,
247–266 (1990)
34. Liu, Y., Shrum, L.J.: What is interactivity and is it always such a good thing?
implications of definition, person, and situation for the influence of interactivity
on advertising effectiveness. Journal of Advertising 31(4), 53–64 (2002)
35. Loepp, B., Herrmanny, K., Ziegler, J.: Blended recommending: Integrating interac-
tive information filtering and algorithmic recommender techniques. In: Proceedings
of the 33rd Annual ACM Conference on Human Factors in Computing Systems -
CHI 15. p. 975–984 (2015)
36. Loepp, B., Hussein, T., Ziegler, J.: Choice-based preference elicitation for collab-
orative filtering recommender systems. In: Proceedings of the 32nd annual ACM
conference on Human factors in computing systems - CHI 14. p. 3085–3094 (2014)
37. Madumal, P., Miller, T., Sonenberg, L., Vetere, F.: A grounded interaction protocol
for explainable artificial intelligence. In: Proc. of the 18th International Conference
on Autonomous Agents and Multiagent Systems, AAMAS 2019. p. 1–9 (2019)
38. McKnight, D.H., Choudhury, V., Kacmar, C.: Developing and validating trust mea-
sures for e-commerce: An integrative typology. In: Information Systems Research.
vol. 13 (2002)
39. Miller, T.: Explanation in artificial intelligence: Insights from the social sciences.
Artificial Intelligence (2018)
40. Muhammad, K.I., Lawlor, A., Smyth, B.: A live-user study of opinionated expla-
nations for recommender systems. In: Intelligent User Interfaces (IUI 16). vol. 2,
p. 256–260 (2016)
41. Nelson, P.J.: Consumer information and advertising. In: Economics of Information.
p. 42–77 (1981)
42. Nelson, P.: Information and consumer behavior 78(2), 311–329 (1970)
43. Nunes, I., Jannach, D.: A systematic review and taxonomy of explanations in
decision support and recommender systems. User Model User-Adap 27, 393–444
(2017)
44. Pu, P., Chen, L., Hu, R.: A user-centric evaluation framework for recommender
systems. In: Proceedings of the fifth ACM conference on Recommender systems -
RecSys 11. pp. 157–164 (2011)
45. Rago, A., Cocarascu, O., Bechlivanidis, C., Toni, F.: Argumentation as a frame-
work for interactive explanations for recommendations. In: Proceedings of the Sev-
enteenth International Conference on Principles of Knowledge Representation and
Reasoning. p. 805–815 (2020)
46. Schein, A.I., Popescul, A., Ungar, L.H., Pennock, D.M.: Methods and metrics for
cold-start recommendations. In: Proceedings of SIGIR 2002. pp. 253–260 (2002)
47. Schnotz, W.: Integrated model of text and picture comprehension. In: The Cam-
bridge Handbook of Multimedia Learning (2nd ed.). p. 72–103 (2014)
48. Sniezek, J.A., Buckley, T.: Cueing and cognitive conflict in judge advisor decision
making. Organizational Behavior and Human Decision Processes 62(2), 159–174
(1995)
49. Sokol, K., Flach, P.: Limetree: Interactively customisable explanations based on
local surrogate multi-output regression trees 34(2), 1–46 (2020)22 Hernandez-Bocanegra and Ziegler
50. Sokol, K., Flach, P.: One explanation does not fit all: The promise of interactive
explanations for machine learning transparency 34(2), 235–250 (2020)
51. Song, J.H., Zinkhan, G.M.: Determinants of perceived web site interactivity. Jour-
nal of Marketing 72(2), 99–113 (2008)
52. Steuer, J.: Defining virtual reality: Dimensions determining telepresence. Journal
of Communication 42(4), 73–93 (1992)
53. Tintarev, N.: Explanations of recommendations. Proceedings of the 2007 ACM
conference on Recommender systems, RecSys 07 p. 203–206 (2007)
54. Tintarev, N., Masthoff, J.: Evaluating the effectiveness of explanations for recom-
mender systems. User Modeling and User-Adapted Interaction 22, 399–439 (2012)
55. Toulmin, S.E.: The uses of argument (1958)
56. Vig, J., Sen, S., Riedl, J.: Tagsplanations: explaining recommendations using tags.
In: Proceedings of the 14th international conference on Intelligent User Interfaces.
p. 47–56. ACM (2009)
57. Wachsmuth, H., Trenkmann, M., Stein, B., Engels, G., Palakarska, T.: A review
corpus for argumentation analysis. In: 15th International Conference on Intelligent
Text Processing and Computational Linguistics. p. 115–127 (2014)
58. Walton, D.: The place of dialogue theory in logic, computer science and commu-
nication studies 123, 327–346 (2000)
59. Walton, D.: A new dialectical theory of explanation 7(1), 71–89 (2004)
60. Walton, D.: A dialogue system specification for explanation 182(3), 349–374 (2011)
61. Walton, D., Krabbe, E.C.W.: Commitment in dialogue: Basic concepts of inter-
personal reasoning. State University of New York Press, New York (1995)
62. Wang, N., Wang, H., Jia, Y., , Yin, Y.: Explainable recommendation via multi-task
learning in opinionated text data. In: Proceedings of the 41st International ACM
SIGIR Conference on Research and Development in Information Retrieval, SIGIR
18. p. 165–174 (2018)
63. Weld, D.S., Bansal, G.: The challenge of crafting intelligible intelligence 62(6),
70–79 (2019)
64. Wu, Y., Ester, M.: Flame: A probabilistic model combining aspect based opinion
mining and collaborative filtering. In: Eighth ACM International Conference on
Web Search and Data Mining. p. 153–162. ACM (2015)
65. Xiao, B., Benbasat, I.: Ecommerce product recommendation agents: use, charac-
teristics, and impact. MIS Quarterly 31(1), 137–209 (2007)
66. Yaniv, I., Milyavsky, M.: Using advice from multiple sources to revise and improve
judgments. Organizational Behavior and Human Decision Processes 103, 104–120
(2007)
67. Zanker, M., Schoberegger, M.: An empirical study on the persuasiveness of fact-
based explanations for recommender systems. In: Joint Workshop on Interfaces
and Human Decision Making in Recommender Systems. p. 33–36 (2014)
68. Zhang, Y., Lai, G., Zhang, M., Zhang, Y., Liu, Y., Ma., S.: Explicit factor mod-
els for explainable recommendation based on phrase-level sentiment analysis. In:
Proceedings of the 37th international ACM SIGIR conference on Research and
development in information retrieval. p. 83–92 (2014)You can also read