End-to-End Deep Learning Model for Cardiac Cycle Synchronization from Multi-View Angiographic Sequences
←
→
Page content transcription
If your browser does not render page correctly, please read the page content below
End-to-End Deep Learning Model for Cardiac
                                               Cycle Synchronization from Multi-View
                                                      Angiographic Sequences*
                                             Raphal Royer-Rivard1 , Fantin Girard2 , Nagib Dahdah3 and Farida Cheriet1
                                                                                   September 8, 2020
arXiv:2009.02345v1 [cs.CV] 4 Sep 2020

                                                                                          Abstract
                                                  Dynamic reconstructions (3D+T) of coronary arteries could give important perfusion details
                                              to clinicians. Temporal matching of the different views, which may not be acquired simultane-
                                              ously, is a prerequisite for an accurate stereo-matching of the coronary segments. In this paper,
                                              we show how a neural network can be trained from angiographic sequences to synchronize dif-
                                              ferent views during the cardiac cycle using raw x-ray angiography videos exclusively. First, we
                                              train a neural network model with angiographic sequences to extract features describing the
                                              progression of the cardiac cycle. Then, we compute the distance between the feature vectors
                                              of every frame from the first view with those from the second view to generate distance maps
                                              that display stripe patterns. Using pathfinding, we extract the best temporally coherent asso-
                                              ciations between each frame of both videos. Finally, we compare the synchronized frames of an
                                              evaluation set with the ECG signals to show an alignment with 96.04% accuracy.

                                        1     INTRODUCTION
                                        Coronary Angiography (CA), a conventional catheter-based 2D x-ray imaging technique, has been
                                        widely used over the years and is still considered as the gold standard for diagnosing and guiding
                                        coronary artery interventions. Since a single view of CA cannot show every detail of the whole
                                        coronary tree, multiple sequences are recorded from different angles, which cannot always be taken
                                        simultaneously.
                                            A 3D reconstruction of the coronary tree from the angiographic sequences can help clinicians
                                        visualize morphological anomalies better than 2D images alone [1]. To obtain the most accurate
                                        3D model from 2D images, synchronization between the sequences is mandatory. For this purpose,
                                        ECG based gating is common practice to help prevent artifacts caused by the cardiac movement
                                        [2]. However, this method removes the temporal dimension of the angiographic sequences, which
                                        prevents the extraction of functional information [3]. Furthermore, artifacts in the ECG signals can
                                        mislead automated algorithms that identify expected waveforms for cardiac phases identification.
                                            *Research supported by the TransMedTech Institute and the National Sciences and Engineering Research Council
                                        of Canada.
                                            1 Department of Computer Engineering and Software Engineering of Polytechnique Montral, Montral, Canada

                                        raphael.royer.rivard@gmail.com
                                            2 Research  and Technology Unit at IDEMIA, Montral, Canada
                                            3 CHU   Sainte-Justine, Montral, Canada
A few recent works have tackled the cardiac phase synchronization task by relying on image
processing. The authors of [4] proposed a statistical method for cardiorespiratory gating on fluo-
roscopic images, which was also later used in [5], but that method fails when the contrast agent is
injected unevenly because of image intensity fluctuations. The work in [6] made use of multi-layer
matching for motion tracking to determine the cardiac phase by measuring the cardiac motion ve-
locity of local patches of coronary arteries. While this method was shown to work relatively well to
synchronize angiographic sequences, the method completely relies on the accurate tracking of the
vessel segments, which is not always possible.
Another recent work used a Deep Convolutional Neural Network (DCNN) to train a model
to identify cardiac phases using a training dataset of several thousand coronary angiographies [7].
Unfortunately, that amount of data is not always available. To overcome this problem, transfer
learning can be helpful. Some works have shown that transfer learning with finetuning made possible
the task of video synchronization, although these approaches used unsupervised learning on non-
cyclic videos [8, 9].
In this work, we introduce a robust and fast method for synchronizing two angiographic sequences
with respect to the phase in the cardiac cycle. The contributions are as follows: i) Training of the
DCNN model is done in an end-to-end manner to output correspondences between video frames
of different views from raw angiographic images. ii) The need for abundant angiographic data is
avoided by making use of transfer learning. iii) A novel loss function, called the soft pair loss, is
proposed for training a neural network from weakly annotated data to extract features describing
cyclic video frames.
2 METHOD
The proposed method consists of four steps. First, the training images are selected automatically
from angiographic sequences based on their global contrast and stacked in short sequences of 3
consecutive frames. Second, the short sequences are used as input to a pretrained and finetuned
DCNN to extract their features. Third, the features extracted from the short sequences from two
different views are compared using a cosine similarity measure to create a similarity matrix. Fourth,
pathfinding is used on the similarity matrix to identify the best temporally coherent synchronization
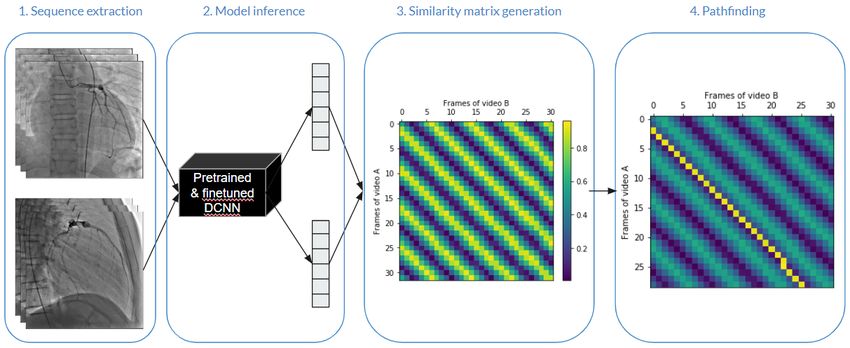
between the two videos. The described pipeline is shown in Fig. 1.
2.1 Sequence extraction
We utilize only the sections of the original CA videos in which the contrast agent is fully visible in
the coronary arteries. To this end, we keep only the frames between the point at which the global
pixel intensity gradient rises above the average of the video and the point at which it falls back
under the average. The images are downsized from 1024x1024 pixels to 224x224 or 248x248 pixels
to comply with the expected input size of the selected model. Additionally, images are stacked in
sets of 3 consecutive frames to create short sequences that are used as inputs to the model. This
is done in a sliding window fashion, so most of the images are present in different positions in 3
sequences.
2.2 Model inference
To extract meaningful features representing the coronary arteries’ movement, a network structure
capable of locally parsing multiple consecutive angiographic images is required. Convolutional neural
networks are well suited for this kind of task. Among the available pretrained models, we testedFigure 1: Overall Processing Pipeline. 1. Sequence extraction: Sequences of 3 consecutive frames from 2 videos in different viewing angles are given as inputs to the model. 2. Model infer- ence: Inputs are used for feedforward passes of a DCNN pretrained on ImageNet and finetuned on our data to output feature vectors (1 per sequence of 3 images). 3. Similarity matrix genera- tion: Every feature vector of video A is compared with every feature vector of video B to generate a similarity matrix. 4. Pathfinding: After inverting the intensities of the matrix to convert the similarity values into costs for the pathfinding algorithm, the best path is identified. Each point of the path represents a synchronized frame pair between the two videos. several of the best performing ones in the ImageNet Large Scale Visual Recognition Challenge [10], notably ResNet-50 [12], MobileNet-v2 [13] and EfficientNet [14]. To include the temporal aspect in our input data, we use the short sequences of 3 consecutive monochrome images. This approach also allows us to keep the first convolutional layer of the network as is, since it was designed to take as input three-channel (RGB) images. 2.3 Similarity matrix generation The finetuned neural network is used to generate feature vectors from every combination of short sequences for two distinct videos. From these feature vectors, a similarity matrix is generated by computing the cosine similarity between every feature vector of video A and those of video B. Note that this matrix displays a diagonal stripe pattern as seen in Fig. 1. 2.4 Pathfinding To find the optimal synchronization between the two videos, the diagonal lines of maximal similarity in the similarity matrix must be identified. For this purpose, Dijkstras algorithm is run multiple times on the matrix with different starting locations. At the first iteration, the starting points are located at every 5 pixels of the first row and at every 5 pixels of the first column. The pathfinding is allowed to search only in the downward, rightward and diagonal directions. A maximum of 3 consecutive steps in the same horizontal or vertical direction is enforced to prevent the pathfinding from diverging from a diagonal line, which can otherwise happen in low contrast portions of the videos. The pathfinding stops when it reaches the last row or last column of the matrix. Every
distinct ending point becomes a starting point for the second iteration, where the pathfinding is run
in the opposite direction. Every path of a sufficient length is considered for the selection of the best
path. Among the longest paths found, the straightest one is identified as the solution and is used
to evaluate the performance of the model.

2.5     Training strategy
2.5.1   ECG
To generate the ground truth used by the training process to improve the pretrained neural network,
an algorithm that parses ECG signals recorded with the angiographic sequences was developed. This
algorithm detects the peaks of the R-wave parts of the signal by locating the local maxima of the
smoothed and normalized signals using gaussian kernels and gradients. The detected peaks of the
R-waves were manually inspected to ensure their quality and the algorithm failed to identify the
peaks in only a few cases where the signal suffered from a measurement problem due to the sensors
sensitivity range. These errors were not manually corrected and were considered as tolerable noise
for the training process.

2.5.2   Ground truth
The R-waves peaks extracted from the ECG were used to generate a ground truth matrix where
every element (t, t0 ) represents the synchronization level ranging from 0 to 1 between frame t of video
A and frame t0 of video B. A synchronization level of 1 means that frames t and t0 are located at
exactly the same phase in their respective cardiac cycles, while 0 means there is half a cardiac cycle
in distance between their cardiac phases. The cardiac phase is computed from the cardiac cycle
progression using the R-wave peaks. More precisely, since a cardiac cycle is comprised of all video
frames between two consecutive R-wave peaks, the cardiac phase is the proportion of total frames
between frame t (resp. t0 ) and the peak preceding it. This method of creating the ground truth
matrix from the ECG signals of both videos allows for a good temporal correspondence at the end
of diastole phase, even when the difference between the heart rates is high.

2.5.3   Soft pair loss function
During DCNN training, for each mini-batch, N random frames are sampled in a random video, where
N is the size of the mini-batch. For every sampled frame, the 3-channel input image is created by
stacking that frame with the two previous frames of the video. Given i and j, two sampled input
images from the mini-batch, we generate the feature vectors a and b from forward passes of the
neural network. The cosine similarity is computed as the dot product of these feature vectors divided
by the product of their norms:
                                                          a·b
                                           cos(θ)i,j =                                              (1)
                                                         kakkbk
    This cosine similarity, ranging from -1 to 1, indicates the similarity between the directions of
the two feature vectors. The loss function used to finetune the network is simply equal to the
average squared distance between the normalized cosine similarity of every feature vector pair and
its respective ground truth similarity yi,j .
                                        N X N
                                       X       (0.5(cos(θ)i,j + 1) − yi,j )2
                              loss =                                                                (2)
                                       i=1 j=1
                                                           N2
Standard pair losses and triplet losses used by other siamese networks, i.e. networks that use
the same weights for processing two different inputs to produce comparable output vectors, generate
only a limited amount of valid feature vector combinations per mini-batch due to the fact that every
training example needs a positive and negative example. By contrast, our loss function, which we
call the soft pair loss, generates a richer learning signal from the sampled feature vectors since every
vector can be matched with all the others.
3 RESULTS & DISCUSSION
The dataset used to train the neural network was composed of 271 free breathing angiographic
sequences of the left or right coronary artery tree from 39 distinct pediatric patients at CHU Sainte-
Justine. The videos had 117.8 frames on average and were recorded over an average of 8.8 cardiac
cycles from a wide variety of angles at 15 or 30 frames per second using a Toshiba Infinix-CFI BP
system. After extracting the video sections with visible contrast agent, the resulting dataset had an
average of 53.6 frames per video and 4.2 cardiac cycles. 39 sequences from 5 patients were used to
create the validation set and 30 sequences from 5 other patients composed the testing set. The rest
of the data was used for training.
3.1 Score calculation
For every video combination of each patient in the test set, the similarity matrix is generated and
the best synchronization path is found. The score of the path is then defined as the average value
of its points mapped onto the corresponding ground truth matrix. To normalize the score, it is
then divided by the score of the path found directly on the ground truth matrix, i.e. the maximum
possible score for that specific synchronization.
3.2 Training hyperparameters
To optimize the model parameters, a random hyperparameter search was carried out. The explored
parameters included several standard ones, but some were related to the specific task of cardiac cycle
synchronization, namely the maximum number of cardiac cycles between two frames of a training
pair and the use of different videos to create training pairs (when disabled, training pairs were
created only with frames from the same video). The hyperparameters of the best model for each
architecture and the resulting overall scores are listed in Table 1. The whole finetuning process of
20 epochs took only 2 hours on a desktop PC with an Nvidia GeForce RTX 2070 graphics card with
8 GB of RAM.
3.3 Analysis
While the average score of the best model is 0.9604, the median is significantly higher at 0.979. By
extracting the path scores for all the video pairs in the test set, as shown in the cumulative histogram
of Fig. 2, we see that some of the scores are fairly low. Indeed, around 5% of the synchronization
paths have a score under 0.85 based on the ECG ground truth. Among the 124 video pairs of the
testing set, 8 of them are sequences acquired simultaneously with a biplane C-arm. As we could
expect, these pairs have a higher score of 0.9857, while the rest have a lower than average score of
0.9586.
Fig. 3 shows the individual path point values for an example of low-scoring path. Here, we
observe a tendency for path points to get higher values (in the ground truth matrix) near theTable 1: Hyperparameter comparison of our best models.
Model Type FC BS DR MC IVP DA Score
ResNet-50 64 32 0.183 0 false true 0.9549
MobileNet 128 32 0 2.02 false false 0.9558
EfficientNet-b0 8 16 0 0 true true 0.9581
EfficientNet-b1 4 12 0 0 false false 0.9604
FC: size of Fully Connected layer, BS: Batch Size, DR: Dropout Rate, MC: Max Cycles, IVP: Inter Video Pairs,
DA: Data Augmentation.
Figure 2: Cumulative histogram of normalized path scores for the video pairs in the test set.
synchronized R-wave peaks (end of diastole) than in-between (end of systole). When qualitatively
evaluating the synchronization accuracy from the video frame pairs, visual examination revealed
that the synchronization based on the selected path appeared more accurate than when based onFigure 3: Example of low-scoring path. The blue curve represents the unnormalized value of
each point in the path; the red curve shows the recorded ECG signal. The point values tend to be
lower in-between R-wave peaks.
the ECG ground truth. Indeed, the latter seemed to be off by a few frames at the end of systole
phases, while the former looked relatively well synchronized throughout the whole sequence. This
suggests that our method can outperform synchronization based solely on the R-wave peaks of the
ECG signals.
Additionally, the pathfinding algorithm tends to deviate from the ground truth at the boundaries
of the similarity matrix, which can be explained by the fact that imperfections in feature extraction
can be mitigated by the rest of the path at other locations but not at the extremities. A simple
solution would be to trim the first and last few frames of the synchronized pairs. Indeed, removing
the first and last points of every path slightly increases the average score from 0.9604 to 0.9607.
4 CONCLUSION
In this paper, we demonstrate that cardiac cycle synchronization of multi-view angiographic se-
quences can be performed with better accuracy using our novel method than using ECG signal
gating on R-wave peaks. Our deep learning method needs only few training examples, curtails prob-
lems related to ECG signal quality and availability by focusing on image sequence analysis instead,
and provides a basis for new approaches to 3D reconstruction of the coronary tree from angiography.
References
[1] J. A. Garcia, Three-Dimensional Imaging for Coronary Interventions, Cardiac Interv. Today
40, pp. 5560, Jan. 2013.[2] P. B. Dattilo, S.-Y. J. Chen, J. D. Carroll, and J. C. Messenger, 3D fluoroscopy-based imag-
ing in the cardiovascular catheterization laboratory: past, present and future, Interventional
Cardiology, vol. 5, no. 1, pp. 101111, Feb. 2013, doi: 10.2217/ica.12.84.
[3] M. Benovoy, ”Automatic Spatiotemporal Analysis of Cardiac Image Series.” Order No.
10806450, Ecole Polytechnique, Montreal (Canada), Ann Arbor, 2016.
[4] M. Panayiotou et al., A statistical method for retrospective cardiac and respiratory motion
gating of interventional cardiac x-ray images: Retrospective cardiorespiratory motion gat-
ing of interventional x-ray images, Med. Phys., vol. 41, no. 7, p. 071901, Jun. 2014, doi:
10.1118/1.4881140.
[5] D. Toth et al., 3D/2D Registration with superabundant vessel reconstruction for cardiac
resynchronization therapy, Medical Image Analysis, vol. 42, pp. 160172, Dec. 2017, doi:
10.1016/j.media.2017.08.001.
[6] S. Song et al., Deep motion tracking from multiview angiographic image sequences for syn-
chronization of cardiac phases, Phys. Med. Biol., vol. 64, no. 2, p. 025018, Jan. 2019, doi:
10.1088/1361-6560/aafa06.
[7] C. Ciusdel et al., Deep Neural Networks for ECG-free Cardiac Phase and End-Diastolic Frame
Detection on Coronary Angiographies, p. 16.
[8] P. Wieschollek, I. Freeman, and H. P. A. Lensch, Learning Robust Video Synchronization
without Annotations, arXiv:1610.05985 [cs], Sep. 2017.
[9] D. Dwibedi, Y. Aytar, J. Tompson, P. Sermanet, and A. Zisserman, Temporal Cycle-
Consistency Learning, arXiv:1904.07846 [cs], Apr. 2019.
[10] O. Russakovsky et al., ImageNet Large Scale Visual Recognition Challenge, Int J Comput Vis,
vol. 115, no. 3, pp. 211252, Dec. 2015, doi: 10.1007/s11263-015-0816-y.
[11] H.-C. Shin et al., Deep Convolutional Neural Networks for Computer-Aided Detection: CNN
Architectures, Dataset Characteristics and Transfer Learning, IEEE Trans. Med. Imaging, vol.
35, no. 5, pp. 12851298, May 2016, doi: 10.1109/TMI.2016.2528162.
[12] He, Kaiming, Xiangyu Zhang, Shaoqing Ren, and Jian Sun. Deep Residual Learning for Image
Recognition. arXiv:1512.03385 [Cs], 10 December 2015.
[13] M. Sandler, A. Howard, M. Zhu, A. Zhmoginov, and L.-C. Chen, MobileNetV2: Inverted
Residuals and Linear Bottlenecks, arXiv:1801.04381 [cs], Mar. 2019.
[14] M. Tan and Q. V. Le, EfficientNet: Rethinking Model Scaling for Convolutional Neural Net-
works, arXiv:1905.11946 [cs, stat], Nov. 2019.You can also read