Environmental determinants of COVID 19 transmission across a wide climatic gradient in Chile
←
→
Page content transcription
If your browser does not render page correctly, please read the page content below
www.nature.com/scientificreports
OPEN Environmental determinants
of COVID‑19 transmission
across a wide climatic gradient
in Chile
Francisco Correa‑Araneda1,2*, Alfredo Ulloa‑Yáñez1, Daniela Núñez3, Luz Boyero4,5,
Alan M. Tonin6, Aydeé Cornejo7, Mauricio A. Urbina8,9, María Elisa Díaz10,
Guillermo Figueroa‑Muñoz8,9 & Carlos Esse1
Several studies have examined the transmission dynamics of the novel COVID-19 disease in different
parts of the world. Some have reported relationships with various environmental variables, suggesting
that spread of the disease is enhanced in colder and drier climates. However, evidence is still scarce
and mostly limited to a few countries, particularly from Asia. We examined the potential role of
multiple environmental variables in COVID-19 infection rate [measured as mean relative infection
rate = (number of infected inhabitants per week / total population) × 100.000) from February 23
to August 16, 2020 across 360 cities of Chile. Chile has a large climatic gradient (≈ 40º of latitude,
≈ 4000 m of altitude and 5 climatic zones, from desert to tundra), but all cities share their social
behaviour patterns and regulations. Our results indicated that COVID-19 transmission in Chile
was mostly related to three main climatic factors (minimum temperature, atmospheric pressure
and relative humidity). Transmission was greater in colder and drier cities and when atmospheric
pressure was lower. The results of this study support some previous findings about the main climatic
determinants of COVID-19 transmission, which may be useful for decision-making and management
of the disease.
On the last day of 2019, a viral outbreak of unknown origin was detected in a seafood market in Wuhan City,
Hubei Province, C hina1. This virus, later named severe acute respiratory syndrome coronavirus 2 (SARS-CoV-2;
Coronaviridae) and responsible for the clinical disease known as COVID-19, has now spread around the globe
and declared a pandemic by the World Health Organization (WHO) on March 12, 2020. To date (March 1,
2021), it has been detected in 219 countries, with about > 115 million people infected and > 2.5 millions deaths
worldwide2. The global scale and severity of the impacts of this disease, despite being at an intermediate stage of
development, is unprecedented, and studies have suggested that it might take more than a decade for the world
to recover from its effects, both socially and economically3.
Upon appearance of COVID-19, several studies have examined the transmission dynamics of this d isease4.
While some have documented the route of transmission through human-to-human contact, others have exam-
ined the role that some environmental factors may play in facilitating the rate of spread of the disease through
1
Unidad de Cambio Climático y Medio Ambiente, Instituto Iberoamericano de Desarrollo Sostenible, Universidad
Autónoma de Chile, Temuco, Chile. 2Facultad de Ciencias de la Salud, Universidad Autónoma de Chile, Temuco,
Chile. 3Programa de Doctorado en Ciencias Mención en Ecología y Biología Evolutiva, Facultad de Ciencias,
Universidad de Chile, Santiago, Chile. 4Department of Plant Biology and Ecology, Faculty of Science and
Technology, University of the Basque Country (UPV/EHU), 48940 Leioa, Spain. 5IKERBASQUE, Basque Foundation
for Science, Bilbao, Spain. 6Aquariparia/Limnology Lab, Department of Ecology, IB, University of Brasília (UnB),
Brasília, Brazil. 7Aquatic Ecology and Ecotoxicology Laboratory. Zoological Collection Eustorgio Mendez, Gorgas
Memorial Institute for Health Studies (COZEM-ICGES), Ave. Justo Arosemena and Calle 35, 0816‑02593 Panama
City, Panama. 8Departmento de Zoología, Facultad de Ciencias Naturales y Oceanográficas, Universidad de
Concepción, P.O. Box 160‑C, Concepción, Chile. 9Instituto Milenio de Oceanografía (IMO), Universidad de
Concepción, PO Box 1313, Concepción, Chile. 10Departamento de Ciencias Ambientales, Facultad de Recursos
Naturales, Universidad Católica de Temuco, Temuco, Chile. *email: francisco.correa@uautonoma.cl
Scientific Reports | (2021) 11:9849 | https://doi.org/10.1038/s41598-021-89213-4 1
Vol.:(0123456789)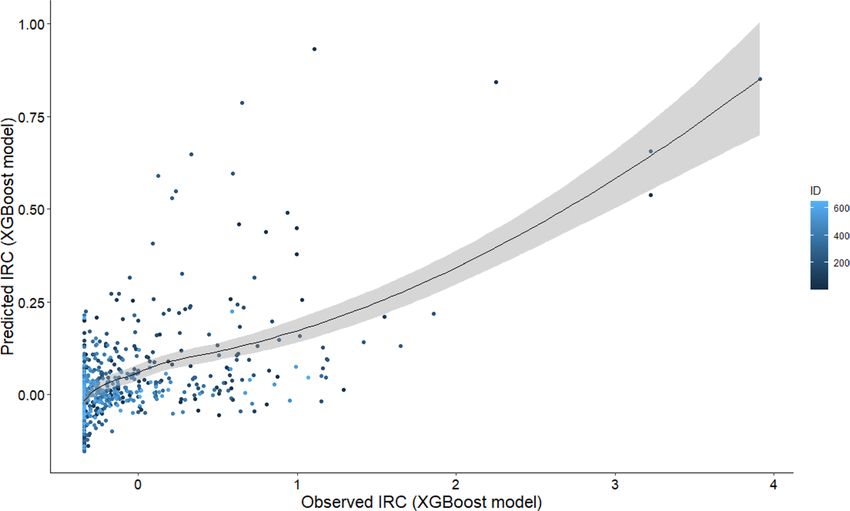
www.nature.com/scientificreports/
Mediterranean Marine South West
Desert (n = 650) Semiarid (n = 350) (n = 5925) (n = 1225) Tundra (n = 500)
Altitude (m a.s.l.) 1298 (1300.2) 439 (336) 285.2 (247.7) 88.0 (92.5) 139.2 (152.5)
Population size (n°
60,309.2 (104,458.6) 57,790.3 (85,457.7) 64,774.9 (94,591.6) 29,500.1 (48,398.9) 14,203 (32,593.9)
inhabitants)
Pop. density (inhabit-
17.62 (45.21) 29.55 (52.94) 1482.2 (3779.1) 29.0 (41.1) 1.1 (2.4)
ants km−2)
Maximum temperature
20.2 (4.4) 19.6 (4.7) 18.0 (6.0) 14.2 (4.6) 8.9 (5.8)
(°C)
Minimum temperature
7.0 (8.3) 8.9 (4.2) 6.2 (3.4) 5.7 (2.7) 2.0 (4.4)
(°C)
Mean temperature (°C) 13.6 (5.4) 14.3 (4.0) 12.1 (4.3) 9.9 (3.3) 5.5 (4.9)
Relative humidity (%) 53.2 (24.07) 56.0 (20.7) 71.9 (11.8) 81.9 (6.9) 77.6 (9.4)
Accumulated precipita-
0.4 (1.6) 0.3 (1.1) 2.6 (4.1) 8.5 (12.8) 2.4 (4.3)
tion (mm)
Atmospheric pressure
857.4 (150.1) 890.5 (127.3) 987.7 (40.6) 1001 (21.8) 994.5 (21.7)
(mbar)
Solar radiation (Mj
17.75 (4.8) 14.1 (4.9) 10.8 (5.9) 7.9 (4.9) 5.6 (3.7)
m−2)
Wind speed (km h−1) 5.95 (3.55) 6.7 (4.0) 4.8 (3.1) 5.5 (3.5) 10.2 (8.1)
−3)
MP2.5 (µg m 10.6 (3.9) 11.6 (2.9) 27.6 (17.5) 42.8 (25.8) 19.8 (17.9)
−3)
MP10 (µg m 36.41 (12.3) 34.3 (11.1) 50.3 (23.2) 49.3 (26.2) N.D.
Mean relative infection
122.4 (273.5) 37.8 (63.6) 53.9 (85.5) 13.6 (28.9) 9.0 (35.7)
rate
Table 1. Mean values (standard error) of the variables recorded between February 23 to August 16, 2020 in
relation to climates. N.D. no data.
the analysis of temporal and spatial relationships of these factors with COVID-19 transmission rate. Most of
these studies have reported a negative relationship between transmission rate and several proxies of temperature
and humidity, suggesting that the disease spread is enhanced in colder and drier c limates5–9.Other environmen-
tal variables have received less attention and results have been inconclusive or differed among countries. For
example, one study reported an inverse relationship between COVID-19 transmission and wind speed in I ran10,
while global studies have found no significant association between both variables11,12. A negative relationship
of the disease transmission with solar radiation has been reported in Iran10, and a positive relationship with the
concentration of atmospheric pollutants was found in China13. Overall, and despite the rapid response of the
scientific community to understand the transmission of COVID-19, the role that environmental variables play
in the disease dynamics remains an open question that requires further evidence across the world.
The goal of this study was to examine the potential role of multiple environmental variables in COVID-19
transmission rates and patterns in Chile. Environmental variation within Chile is unique due to the particular
geography of this country, which includes an altitudinal range of ≈ 7000 m from the sea level to the top of
Aconcagua mountain, and a ≈ 40º latitudinal gradient that covers 6 climatic zones, including desert, semiarid,
mediterranean, marine west coast, tundra and ice sheet. At the same time, population across the country shares
a common social behaviour, and regulations are established by a single national authority, allowing the evalua-
tion of environmental variables under relatively consistent socio-economic c onditions14. We thus aim to provide
information about COVID-19 transmission across a wide range of environmental variation within a single
country that may help understanding the dynamics of this disease.
Results
Summary of study area characteristics and COVID‑19 transmission data. Mean temperature
varied between − 11.99 °C (polar macroclimate) and 23.69 °C (semi-arid); relative humidity, between 2.56%
(desert) and 96.83% (polar); atmospheric pressure, between 600.29 mbar (semi-arid) and 1062.71 mbar (marine
south west); and wind speed, between 0 km h−1 (mediterranean) and 64.01 km h−1 (polar) (Table 1). Absolute
population size ranged from 137 inhabitants (Antarctica) to 645,909 inhabitants (Puente Alto, mediterranean)
(Fig. 1; see Supplementary Table S1 online). The first registered COVID-19 infection case in Chile occurred on
February 23, 2020; to the data collection date (August 16, 2020), more than 387,000 infected inhabitants and
10,500 deaths have been reported. The mean infection rate ranged from 0 (several cities) to 4444 in General
Lagos (desert) in week 32, and the number of weekly infections from 0 (several cities) to 2549 (Puente Alto) (see
Supplementary Table S1 online).
Relationship between COVID‑19 and predictive variables matrices. The major statistical asso-
ciations between the variables were registered without the time lags analyzed (0 days). The correlation analysis
showed a strong relationship between the average, maximum and minimum temperatures, as well as between
altitude and relative humidity, atmospheric pressure and solar radiation. There was no correlation between pop-
ulation density, wind speed and IR, and low correlation between precipitation and all other variables (Fig. 1).
According to multicollinearity analysis, the variables of greatest importance were minimum and mean tempera-
Scientific Reports | (2021) 11:9849 | https://doi.org/10.1038/s41598-021-89213-4 2
Vol:.(1234567890)www.nature.com/scientificreports/
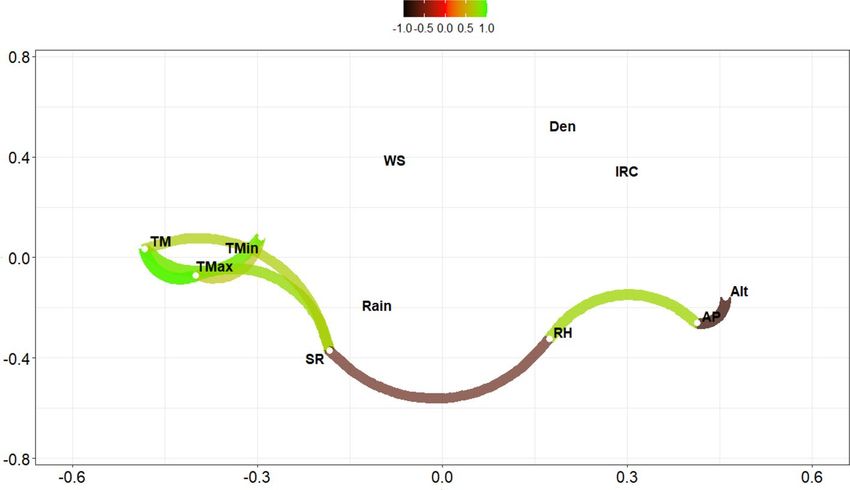
Figure 1. Correlations plot of environmental database COVID-19. Green paths indicate positive correlations,
brown paths negative correlations. TM= Average atmospheric temperature; TMax = Maximum atmospheric
temperature; TMin = Minimum atmospheric temperature; RH = Relative humidity; Rain = Accumulated
precipitation; AP = Atmospheric pressure; SR = Ultraviolet solar radiation; WS = Wind speed; Alt = Elevation;
Den = Population density; IRC = Infection rate.
Parameter Description Range Optimum value
n_estimators Number of iterations in training 10–1000 56
Eta Model learning rate 0.02–0.05 0.03
max_depth Maximum depth of the tree 4–8 4
Minimal loss reduction required to perform an additional partition on a leaf node
Gamma 0 0
of the tree
colsample_bytree The last parameter that we need to config 0.5–0.9 0.5
min_child_weight Sum of sample weight of the smallest leaf nodes to prevent overfitting 1–2 1
subsample Sampling rate of all training samples 1–3 1
Table 2. Extreme Gradient Boosting regression modeling hyperparameters from the grid search. Optimum
value = hyperparameter selected for the improved model (tuning).
Week/days Best iteration RMSE-test RMSE-prediction 1 RMSE-prediction 2
0/0 56 0.8239 0.5345 0.5238
1/7 34 0.7017 1.4153 1.4449
2/14 14 0.843 0.7641 0.8434
Table 3. Root mean square error (RMSE) obtained for each database from the adjusted predictive
model. RMSE-test = error of the model fitted by default; RMSE-prediction 1 = error of prediction without
hyperparameters; RMSE-prediction 2 = error with use of hyperparameters.
ture (variance inflation factor, VIF > 10) and the least important was maximum temperature (VIF < 10). Given
the above, the reduced the data matrix excluded mean and maximum temperature and altitude as predictor
variables.
The training model was adjusted using the database with 3368 observations and 7 predictive variables. The
hyperparameter selection allowed improving the predictions. The final tuning values used for the model were
n_estimators (number of iterations in training) = 56, max_depth (maximum depth of the tree) = 4, eta (model
learning rate) = 0.03, gamma (Minimal loss reduction required to perform an additional partition on a leaf node
of the tree) = 0, colsample_bytree (the last parameter that we need to config) = 0.5, min_child_weight (sum of
sample weight of the smallest leaf nodes to prevent overfitting) = 1 and subsample (sampling rate of all train-
ing samples) = 1 (Table 2). The predictions corresponding to week 0 showed a lowest error with 56 iterations
(Table 3). The scatter plot of predicted mean relative infection (IR) versus observed values using the final model
Scientific Reports | (2021) 11:9849 | https://doi.org/10.1038/s41598-021-89213-4 3
Vol.:(0123456789)www.nature.com/scientificreports/
Figure 2. Scatter plot of predicted IRC versus observed values using the XGBoost method.
Figure 3. Top 7 most important variables based on the Gain Score (impurity) metric. TMin = Minimum
atmospheric temperature; AP = Atmospheric pressure; RH = Relative humidity; SR = Ultraviolet solar radiation;
Den = Population density; WS = Wind speed; Rain = Accumulated precipitation.
is illustrated in Fig. 2. The scatterplot considering all parameters demonstrate an acceptable prediction of IR with
a R2 = 0.32 (R = 0.57). The Gain Score showed that the most important variables were minimum temperature
(Tmin), atmospheric pressure (AP) and relative humidity (RH) (Fig. 3). All these final selected variables showed
a highly significant negative relationship with the infection rate (p < 0.0001; Tmin r = − 0.25, AP r = − 0.23, RH
r = − 0.21).
Discussion
Our results demonstrate that COVID-19 infection rate in Chile to date has been linked to 3 main environmen-
tal variables: minimum temperature, atmospheric pressure and relative humidity. Firstly, we found a negative
relationship between infection rate and minimum temperature. Other studies have reported a similar, negative
relationship between air temperature and the transmission of COVID-1915–18 and other respiratory diseases such
as SARS19. However, a positive correlation with average and minimum temperature has been reported in Singa-
pore, especially in the initial phase of t ransmission20. Others have found an indirect, positive effect of average
temperature on the spread of the SARS-CoV-2 virus due to enhanced people’s mobility at higher t emperatures21.
Scientific Reports | (2021) 11:9849 | https://doi.org/10.1038/s41598-021-89213-4 4
Vol:.(1234567890)www.nature.com/scientificreports/
These findings are particularly concerning at present in the southern hemisphere, which is entering winter and
therefore lower temperatures are expected in the coming months, which could drive an upsurge of the disease.
Atmospheric pressure was the second relevant variable and it was negatively related with the spread of the
SARS-CoV-2 virus. The link between atmospheric pressure and the spread of the SARS-CoV-2 virus has been
studied in several countries20–26, since atmospheric pressure is responsible for air movement (wind), cloud for-
mation, precipitation and humidity. Therefore, this variable has strong influence on climatic variation, generat-
ing favourable conditions for the virus spread in some cases (drought and light wind) but not in others (high
humidity and strong wind). Others have provided evidence for a direct link between atmospheric pressure and
the virus spread, indicating that the unusual persistence of an anticyclonic atmospheric situation (i.e., abnor-
mally strong positive phase of the North Atlantic and Arctic oscillation) in southwestern Europe, centered in
Spain and Italy during February 2020, generated conditions of drought and light wind that could have favored
the faster spread of the virus compared to other European c ountries22. This is reinforced by the positive correla-
tion found between atmospheric pressure and the frequency of COVID-19 cases in Mozambique25, and with
several spread parameters (infection rate, effective reproduction number and compound growth rate) in 487
cities in the United S tates23. Such positive relationship could be related to an increase in fog associated to high
pressure, which increases the humidity of the air and surfaces. However, other studies have found an inverse link
between atmospheric pressure and the spread of the SARS-CoV-2 virus in Singapore and C hina20,26, which could
be explained by the fact that high pressures can limit suspension time of viral particles in the environment26.
Indirectly, atmospheric pressure could also reduce the virus spread by limiting people’s m obility21. Overall, there
is no consensus on the link between atmospheric pressure and the spread of the SARS-CoV-2 virus since there
is evidence that describes both direct and inverse correlations, even both within the same country (e.g., Italy)24.
The negative relationship that we observed between relative infection rate and relative humidity is consist-
ent with former evidence that high relative humidity reduces the COVID-19 viability27,28 and transmission
rates7,29. Similarly, high relative humidity has been reported to reduce the survival of the influenza v irus30 and
the incidence of this disease8. Environmental humidity can affect viral transmission through its interaction with
respiratory droplets, which act as virus containers and can remain longer in dry a ir31,32. Additionally, high relative
humidity leads to inactivation of the viral lipid membrane, and consequently a decrease in the virus stability and
transmission33,34. However, a study found a direct link between average relative humidity and the SARS-CoV-2
basic reproductive ratio in China26. Again, relative humidity can indirectly contribute to the spread of the SARS-
CoV-2 virus due to its influence on people’s m obility21.
In conclusion, our study shows that climate plays a key role in the transmission of COVID-19 in Chile, a
country that comprises a particularly high variation of environmental conditions. Importantly, it is highly likely
that climatic conditions expected for the coming months in the southern hemisphere (i.e., lower temperature,
humidity and atmospheric pressure) can favour a higher disease transmission speed. Our study and others pro-
viding information about how climatic factors can influence the spread of the disease may serve as the basis for
predictive models of COVID-19 transmission through space and time, which will be highly relevant to decision-
making and management of the disease.
Materials and methods
Study area. We examined data from 360 ‘communes’ or cities in Chile, which are distributed across 4200 km
from north to south. Latitudes of our study area range from 17° S (Arica) to 56° S of latitude (Cabo de Hornos),
and altitudes range from 8 m a.s.l. (Pacific Ocean coast) to 3962 m a.s.l. (San Pedro de Atacama, Andean moun-
tain range). The study area covers the following five climatic zones: (i) desert (17°30′–26°00′ S), (ii) semiarid
(26°00′–32°00′), (iii) mediterranean (32°00′–39°00′), (iv) marine west coast (39°00′–44°00′ S) and (v) tundra
(44°00–56°00′ S); the only climatic zone excluded from the study was the ice sheet (located in the highest areas
of the Andes mountain range) because of the absence of human population. In terms of macroclimates, ca. 41%
of the country is temperate, 31% arid and the remaining 28% has a polar climate36 (Fig. 4).
Chilean population is 19.11 million inhabitants, of which 51% are women and 49% men. Life expectancies
are 83 (women) and 78 (men) years old; 68.7% of the population is between 15 and 64 years old and 11.9% over
65 years old. The 88% of inhabitants live in urban areas and the estimated international migration rate is 12 per
thousand inhabitants. The 13% of the population belongs to indigenous or native groups; 80% Mapuche, 7%
Aymara and 4% Diaguita37. The population is aging as a result of the decline in fertility and the increased life
expectancy38.
Chile has 16 administrative r egions3539, of which the Metropolitana region concentrates the largest population
(7.1 million inhabitants), followed by the Valparaiso region (1.8 million inhabitants). In contrast, the Aysén and
Magallanes regions, located in the southern extreme of Chile, have the smallest population (< 200,000 inhabit-
ants). Inhabitants > 65 years old mainly inhabit the areas with mediterranean climate in the cities of Santiago,
Valparaíso and Concepción, and correspond to 6.28% of the total employed inhabitants in the c ountry40. By
2050 it is projected that total population size reaches 21.6 million (i.e., an increase of 15.3% compared to 2020)
under assumptions of birth and immigration surpassing mortality and emigration, with inhabitants > 65 years
old predicted to exceed 3 million (25% of the population)38.
COVID‑19 transmission data and predictive variables. We characterized the COVID-19 trans-
mission in Chile from February 23 to August 16, 2020, based on mean relative infection rate [IR; (number of
infected inhabitants per week/total population) × 100,000) of 360 cities. Data were obtained from official sources
of the Government of Chile41. We extracted daily climatic data from the databases of 159 meteorological stations
in Chile42 corresponding to cities with and without presence of COVID-19, for the same period; these data were
averaged per week to make them comparable with variables quantifying the disease transmission. The data of
Scientific Reports | (2021) 11:9849 | https://doi.org/10.1038/s41598-021-89213-4 5
Vol.:(0123456789)www.nature.com/scientificreports/
Figure 4. Map of Chilean distribution of (A) infection rate, (B) minimum temperature (°C), (C) atmospheric
pressure (kPa), and (D) relative humidity (%).
the climatic variables recorded every 1 h at meteorological stations were extracted and average weekly express-
ing them as follows: weekly average, maximum and minimum atmospheric temperature (°C); weekly average
relative humidity (%; moisture content (i.e., water vapor) of the atmosphere, expressed as a percentage of the
amount of moisture that can be retained by the atmosphere (moisture-holding capacity) at a given tempera-
ture and pressure without condensation)43, absolute humidity (g m −3), accumulated precipitation (mm), atmos-
pheric pressure (mbar), ultraviolet solar radiation (Mj m−2) and wind speed (km h−1). Additionally, we obtained
data for other relevant environmental, demographic and geographic variables, those that were averaged and
expressed as follows: air pollutant data, including particulate matter with aerodynamic diameter ≤ 10 μm (PM10)
and ≤ 2.5 μm (PM2.5), obtained from a database of 30 air quality s tations44; and city area ( km−2), population size
(ind), population density (ind km −2), latitude (absolute degrees), longitude (absolute degrees) and altitude (m
a.s.l.), obtained from CONAF45 and IDE C hile46.
Statistical analyses. In order to analyze time lags in the transmission of the virus, three databases were
built using environmental information with different time lags of contagion with respect to the response variable
(IR), these being: (a) 0 days, (b) 7 days and (c) 14 days. Each database was subjected to an exploratory analysis,
which allowed the identification of missing, influential or out of range data, and elimination of variables that
were non-influential and/or highly correlated with others. This allowed reducing dimensionality by eliminating
redundant information. For this, a correlation matrix was constructed and a boosting model was fitted using the
VIF criterion47. For the final variables selection were modeled through extreme gradient boosting (XGBoost48).
This model consists of a successful machine learning library based on a gradient boosting algorithm proposed
by Chen48, which sequentially processes the data with a loss or cost function, minimizing the error iteration
after iteration and increasing predictive power compared to other sequential tree models. We used VIFs to iden-
tify multicollinearity46 and data were normalized, which is important for machine-learning estimators. Dataset
records were shuffled and split to 80% for the training and 20% for the test.
The model was trained with the original parameters adjusting the depth (max_depth) between 1 and 1049.
Once the best iteration was identified, we proceeded to predict on the validation set. The model was tuned using
hyperparameters (Table 2). We used a grid search on hyperparameters, parallelizing the search, with threefold
cross-validation was carried out to find the best model based on, root mean square error (RMSE), R 2 metrics and
mean absolute error (MAE). The xgboost and caret libraries of the R software50 were used for the analyzes. Once
the most important variables were selected, a spatial representation of each of them and climates was generated
for each city, which was adapted from Sarricolea et al.36. For this, the existing spatial coverage in shape format in
the national database of the Spatial Data Infrastructure IDE-Chile46 was used. For the management and analysis
of spatial data, the ArcMap software version 10.8.1 (ESRI Inc., Redlands, California, USA) was used.
Scientific Reports | (2021) 11:9849 | https://doi.org/10.1038/s41598-021-89213-4 6
Vol:.(1234567890)www.nature.com/scientificreports/
Data availability
The raw data was supplied as a Supplementary Information File.
Received: 17 May 2020; Accepted: 6 April 2021
References
1. Sarkodie, S. A. & Owusu, P. A. Investigating the cases of novel coronavirus disease (COVID-19) in China using dynamic statistical
techniques. Heliyon 6, e03747. https://doi.org/10.1016/j.heliyon.2020.e03747 (2020).
2. WHO. Coronavirus disease (COVID-19) Pandemic. https://www.who.int/emergencies/diseases/novel-coronavirus-2019 (2021).
3. United Nations. Launch of Global Humanitarian Response Plan for COVID-19. https://www.un.org/sg/en/content/sg/press-encou
nter/2020-03-25/launch-of-global-humanitarian-response-plan-for-covid-19 (2021).
4. Li, Q. et al. Early transmission dynamics in Wuhan, China, of novel coronavirus-infected pneumonia. N. Engl. J. Med. 382,
1199–1207 (2020).
5. Liu, J. et al. Impact of meteorological factors on the COVID-19 transmission: A multi-city study in China. Sci. Total Environ. 726,
138513 (2020).
6. Luo, W. et al. The role of absolute humidity on transmission rates of the COVID-19 outbreak. medRxiv 2020.02.12.20022467.
https://doi.org/10.1101/2020.02.12.20022467 (2020).
7. Ma, Y. et al. Effects of temperature variation and humidity on the death of COVID-19 in Wuhan, China. Sci. Total Environ. 138226.
https://doi.org/10.1016/j.scitotenv.2020.138226 (2020).
8. Park, J. E. et al. Effects of temperature, humidity, and diurnal temperature range on influenza incidence in a temperate region.
Influenza Other Respir. Viruses 14, 11–18 (2020).
9. Shi, P. et al. The impact of temperature and absolute humidity on the coronavirus disease 2019 (COVID-19) outbreak—Evidence
from China. medRxiv 2020.03.22.20038919. https://doi.org/10.1101/2020.03.22.20038919 (2020).
10. Ahmadi, M., Sharifi, A., Dorosti, S., Ghoushchi, S. J. & Ghanbari, N. Investigation of effective climatology parameters on COVID-
19 outbreak in Iran. Sci. Total Environ. 138705. https://doi.org/10.1016/j.scitotenv.2020.138705 (2020).
11. Chen, B. et al. Roles of meteorological conditions in COVID-19 transmission on a worldwide scale. medRxiv 11,
2020.03.16.20037168. https://doi.org/10.1101/2020.03.16.20037168 (2020).
12. Oliveiros, B., Caramelo, L., Ferreira, N. & Caramelo, F. Role of temperature and humidity in the modulation of the doubling time
of COVID-19 cases. medRxiv. https://doi.org/10.1101/2020.03.05.20031872 (2020).
13. Zhu, Y., Xie, J., Huang, F. & Cao, L. Association between short-term exposure to air pollution and COVID-19 infection: Evidence
from China. Sci. Total Environ. 727, 138704 (2020).
14. Fernández Richard, J. La administración del Estado y las municipalidades en Chile. Rev. IUS 7(32), 148–160 (2013).
15. Luo, Y. et al. Lagged effect of diurnal temperature range on mortality in a subtropical megacity of China. PLoS ONE 8, e55280
(2013).
16. Pinheiro, S. de L. L. de, Saldiva, P. H. N., Schwartz, J. & Zanobetti, A. Isolated and synergistic effects of PM10 and average tem-
perature on cardiovascular and respiratory mortality. Rev. Saude Publ. 48, 881–888 (2014).
17. Ficetola, G. F. & Rubolini, D. Climate affects global patterns of COVID-19 early outbreak dynamics. medRxiv 2020.03.23.20040501.
https://doi.org/10.1101/2020.03.23.20040501 (2020).
18. Xie, J. & Zhu, Y. Association between ambient temperature and COVID-19 infection in 122 cities from China. Sci. Total Environ.
724, 138201 (2020).
19. Tan, J. et al. An initial investigation of the association between the SARS outbreak and weather: with the view of the environmental
temperature and its variation. J. Epidemiol. Commun. Health 59, 186–192 (2005).
20. Pani, S. K., Lin, N.-H. & RavindraBabu, S. Association of COVID-19 pandemic with meteorological parameters over Singapore.
Sci. Total Environ. 740, 140112. https://doi.org/10.1016/j.scitotenv.2020.140112 (2020).
21. Zhu, Y., Xie, J., Huang, F. & Cao, L. The mediating effect of air quality on the association between human mobility and COVID-19
infection in China. Environ. Res. 189, 109911. https://doi.org/10.1016/j.envres.2020.109911 (2020).
22. Sanchez-Lorenzo, A. et al. Did anomalous atmospheric circulation favor the spread of COVID-19 in Europe?. Environ. Res 194,
110626. https://doi.org/10.1016/j.envres.2020.110626 (2021).
23. Yan, W. et al. Atmospheric pressure and population density as super-factors influencing the transmission of coronavirus disease
2019 (COVID-19). https://doi.org/10.21203/rs.3.rs-93707/v1 (2020).
24. Lolli, S. et al. Impact of meteorological conditions and air pollution on COVID-19 pandemic transmission in Italy. Sci. Rep. 10,
16213. https://doi.org/10.1038/s41598-020-73197-8 (2020).
25. Cambaza, E. M., Viegas, G. C. & Cambaza, C. M. Potential impact of temperature and atmospheric pressure on the number of
cases of COVID-19 in Mozambique, Southern Africa. JPHE 12, 246–260. https://doi.org/10.5897/JPHE2020.1258 (2020).
26. Lin, S. et al. Region-specific air pollutants and meteorological parameters influence COVID-19: A study from mainland China.
Ecotoxicol. Environ. Saf. 204, 111035. https://doi.org/10.1016/j.ecoenv.2020.111035 (2020).
27. Yuan, J. et al. A climatologic investigation of the SARS-CoV outbreak in Beijing, China. Am. J. Infect. Control 34, 234–236 (2006).
28. Chan, K. H. et al. The effects of temperature and relative humidity on the viability of the SARS coronavirus. Adv. Virol. 2011 (2011).
29. Wang, J., Tang, K., Feng, K. & Lv, W. High temperature and high humidity reduce the transmission of COVID-19. SSRN Electron.
J. https://doi.org/10.2139/ssrn.3551767 (2020).
30. Metz, J. A. & Finn, A. Influenza and humidity—Why a bit more damp may be good for you!. J. Infect. 71, S54–S58 (2015).
31. Lowen, A. C., Mubareka, S., Steel, J. & Palese, P. Influenza virus transmission is dependent on relative humidity and temperature.
PLoS Pathog 3, e151 (2007).
32. Yang, W. & Marr, L. C. Dynamics of airborne influenza A viruses indoors and dependence on humidity. PLoS One 6 (2011).
33. De Jong, J. C., Trouwborst, T. & Winkler, K. C. Mechanisms of inactivation of viruses and macromolecules in air. Airborne Transm.
Airborne Infect. 124–130 (1973).
34. Moriyama, M., Hugentobler, W. J. & Iwasaki, A. Seasonality of respiratory viral infections. Annu. Rev. Virol. https://doi.org/10.
1146/annurev-virology-012420-022445 (2020).
35. Bukhari, Q. & Jameel, Y. Will coronavirus pandemic diminish by summer? SSRN Electron. J. https://doi.org/10.2139/ssrn.35569
98 (2020) .
36. Sarricolea, P., Herrera-Ossandon, M. & Meseguer-Ruiz, Ó. Climatic regionalisation of continental Chile. J. Maps 13, 66–73 (2017).
37. INE. Síntesis de Resultados Censo 2017. https://www.censo2017.cl/descargas/home/sintesis-de-resultados-censo2017.pdf (2018).
38. INE. Estimaciones y Proyecciones de la Población de Chile 2002–2035. Totales Regionales, Población Urbana y Rural. Síntesis de
Resultados Instituto Nacional de Estadísticas Junio 2019 (2019).
39. DGA. Atlas del Agua Chile 2016 (2016).
40. INE. Adultos Mayores en Chile: ¿Cuántos Hay? ¿Dónde Viven? ¿Y en qué Trabajan? https://www.ine.cl/prensa/detalle-prensa/2020/
04/15/adultos-mayores-en-chile-cuántos-hay-dónde-viven-y-en-qué-trabajan (2020).
Scientific Reports | (2021) 11:9849 | https://doi.org/10.1038/s41598-021-89213-4 7
Vol.:(0123456789)www.nature.com/scientificreports/
41. MINSAL. Informe Epidemiológico Enfermedad por SARS-Cov-2 (COVID-19) Chile 17–08–2020. https://www.minsal.cl/wp-conte
nt/uploads/2020/08/Informe-epidemiologico-43-MINSAL.pdf.
42. INIA. Agrometereología Red Agrometereológica de Inia. https://agrometeorologia.cl/ (2020).
43. Yahia, E. M. Introduction. In Postharvest Technology of Perishable Horticultural Commodities 1–41. https://doi.org/10.1016/B978-
0-12-813276-0.00001-8 (Elsevier, 2019).
44. SINCA-MMA. SINCA Sistema de Información Nacional de Calidad del Aire. https://sinca.mma.gob.cl/index.php/ (2020).
45. CONAF. Proyecto Catastro y Evaluación de los Recursos Vegetacionales Nativos de Chile. http://sit.conaf.cl/ (2013).
46. IDE Chile. IDE Chile Infraestructura de Datos Geoespaciales. http://www.ide.cl/ (2020).
47. Marquardt, D. W. Generalized inverses, ridge regression, biased linear estimation, and nonlinear estimation. Technometrics 12,
591–612. https://doi.org/10.1080/00401706.1970.10488699 (1970).
48. Chen, T. & Guestrin, C. XGBoost: A scalable tree boosting system. Proc. ACM SIGKDD Int. Conf. Knowl. Discov. Data Min. 13–17,
785–794 (2016).
49. Mousavi, S. S., Schukat, M. & Howley, E. Deep reinforcement learning: An overview. Lect. Notes Netw. Syst. 16, 426–440 (2018).
50. R Core Team. R: A Language and Environment for Statistical Computing. https://www.R-project.org. (R Foundation for Statistical
Computing v. 3.2.5, 2018).
Acknowledgements
Funding was provided by the Initiation Fondecyt project 11170390 to F.C.A. D.N. received a CONICYT-PFCHA/
Doctorado Nacional/2019-21191862 scholarship. A.C. received a scholarship of the National Secretariat of Sci-
ence, Technology and Innovation (SENACYT, Panama) and by the National Research System of Panama (SNI;
doctoral student category). We thank Francisco Encina, Sergio Muñoz, Demian Arancibia, Rodrigo Correa,
Ministry of Science and Technology and Ministry of Health of the Government of Chile for information sup-
port in data search and comments. F.C.A. dedicates this study to his grandmother -Tencha- for her constant
support and inspiration.
Author contributions
Conceptualization: F.C.A. and C.E. Formal analysis: F.C.A., A.U.Y., L.B., M.A.U., A.T. and C.E. Literature revision:
F.C.A., M.A.U., A.U.Y., M.E.D., G.F.M. and D.N. Data curation: A.U.Y. and D.N. Visualization: F.C.A., A.U.Y.,
D.N. and C.E. Wrote the manuscript: F.C.A. and L.B. All authors reviewed and edited the manuscript.
Competing interests
The authors declare no competing interests.
Additional information
Supplementary Information The online version contains supplementary material available at https://doi.org/
10.1038/s41598-021-89213-4.
Correspondence and requests for materials should be addressed to F.C.-A.
Reprints and permissions information is available at www.nature.com/reprints.
Publisher’s note Springer Nature remains neutral with regard to jurisdictional claims in published maps and
institutional affiliations.
Open Access This article is licensed under a Creative Commons Attribution 4.0 International
License, which permits use, sharing, adaptation, distribution and reproduction in any medium or
format, as long as you give appropriate credit to the original author(s) and the source, provide a link to the
Creative Commons licence, and indicate if changes were made. The images or other third party material in this
article are included in the article’s Creative Commons licence, unless indicated otherwise in a credit line to the
material. If material is not included in the article’s Creative Commons licence and your intended use is not
permitted by statutory regulation or exceeds the permitted use, you will need to obtain permission directly from
the copyright holder. To view a copy of this licence, visit http://creativecommons.org/licenses/by/4.0/.
© The Author(s) 2021
Scientific Reports | (2021) 11:9849 | https://doi.org/10.1038/s41598-021-89213-4 8
Vol:.(1234567890)You can also read