Evidence paper to accompany: Scotland's Strategic Framework Update - COVID-19 1. Heading
←
→
Page content transcription
If your browser does not render page correctly, please read the page content below
1. Heading

 COVID-19

 Evidence paper to accompany:
 Scotland’s Strategic Framework Update

 February 2022

This publication will be available in accessible HTML on the gov.scot website
Evidence paper to accompany: Coronavirus (COVID-19)
Scotland’s Strategic Framework Update – February 2022
Contents
List of Figures and Tables ....................................................................................... 3
1. Outline of the paper............................................................................................. 5
2. Where we are now .............................................................................................. 5
2.1 Introduction ................................................................................................... 5
2.2 The pattern of the epidemic since November 2021 ....................................... 5
2.3 An overview of Omicron .............................................................................. 13
2.4 The impact of BA.2 ...................................................................................... 17
2.5 Changes in testing ...................................................................................... 18
2.6 Measures in Scotland to reduce the effect of Omicron ................................ 21
2.7 Summary ..................................................................................................... 22
3. Health and Social Care in Scotland................................................................... 23
3.1 Introduction ................................................................................................. 23
3.2 Hospital and GP services ............................................................................ 23
3.3 Population Health ........................................................................................ 26
3.4 Mental Health .............................................................................................. 27
3.5 Summary ..................................................................................................... 28
4. Impact on society .............................................................................................. 29
4.1 Introduction ................................................................................................. 29
4.2 Personal wellbeing ...................................................................................... 29
4.3 Work............................................................................................................ 31
4.4 Cost of living................................................................................................ 35
4.5 Education (or Children and Young People) ................................................. 36
4.6 Loneliness ................................................................................................... 37
4.7 Social connections ...................................................................................... 38
4.8 Cultural engagement ................................................................................... 39
4.9 Summary ..................................................................................................... 40
5. Impact on the economy ..................................................................................... 41
5.1 Introduction ................................................................................................. 41
5.2 The recovery of the economy ...................................................................... 41
5.3 Economic output has fallen in periods of restrictions .................................. 42
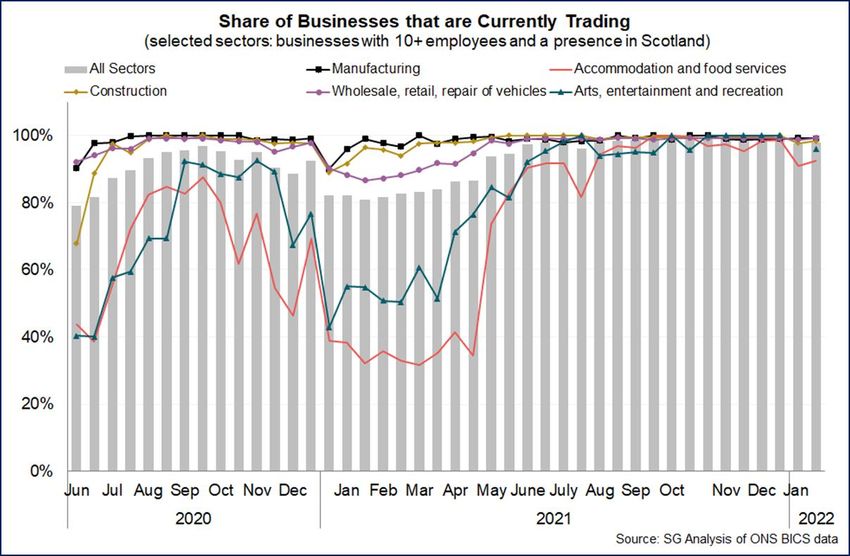
5.4 Sectoral differences in trading patterns ....................................................... 42
5.5 Sectoral differences in economic output and recovery ................................ 43
1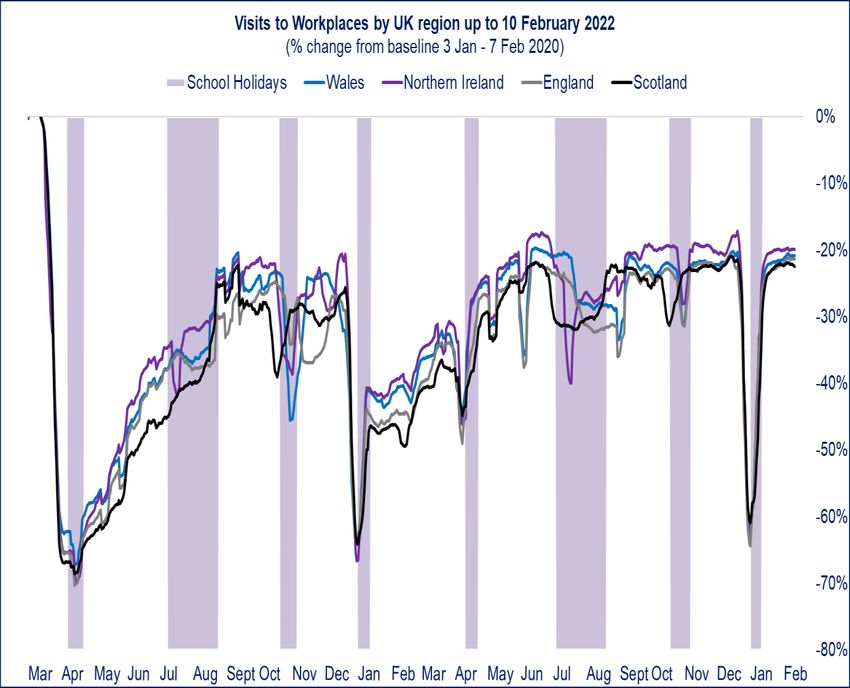
5.6    Turnover and business resilience have been impacted .............................. 44
     5.7    Labour market headline indicators are strong ............................................. 46
     5.8    Labour shortages ........................................................................................ 46
     5.9    Working from home and city centre economies .......................................... 47
     5.10      Summary ................................................................................................. 48
6.     Looking to the future ......................................................................................... 50
     6.1    Introduction ................................................................................................. 50
     6.2    The evolving science and trajectory of the epidemic ................................... 50
     6.3    Variant surveillance ..................................................................................... 54
     6.4    Vaccinations ................................................................................................ 55
     6.5    Treatments .................................................................................................. 57
     6.6    The efficacy of different interventions .......................................................... 59
     6.7    Public attitudes and expectations ................................................................ 63
     6.8    Persistent inequalities ................................................................................. 63
     6.9    International experiences ............................................................................ 65
       6.9.1      Lifted restrictions .................................................................................. 65
       6.9.2      Levels approach to Covid regulation .................................................... 66
       6.9.3      International perspectives on the future. ............................................... 69
     6.10      Summary ................................................................................................. 71
7.     Plausible scenarios ........................................................................................... 72
     7.1    The four worlds ........................................................................................... 72
       7.1.1      Immune World ...................................................................................... 73
       7.1.2      Waning world ........................................................................................ 75
       7.1.3      Polarised world ..................................................................................... 76
       7.1.4      Variant world – vaccine escape with same severity as Delta................ 78
       7.1.5      Variant world – vaccine escape with increased severity compared to
       Delta      80
       7.1.6      Background levels of COVID-19 ........................................................... 81
     7.2    Summary ..................................................................................................... 82
8.     Data and Analysis ............................................................................................. 83
     8.1    Introduction ................................................................................................. 83
     8.2    Signals and indicators ................................................................................. 83
     8.3    COVID-19 Recovery Learning and Evaluation ............................................ 84
     8.4    Summary ..................................................................................................... 85
9.     Conclusion ........................................................................................................ 86
Annex A .................................................................................................................... 87

                                                                                                                             2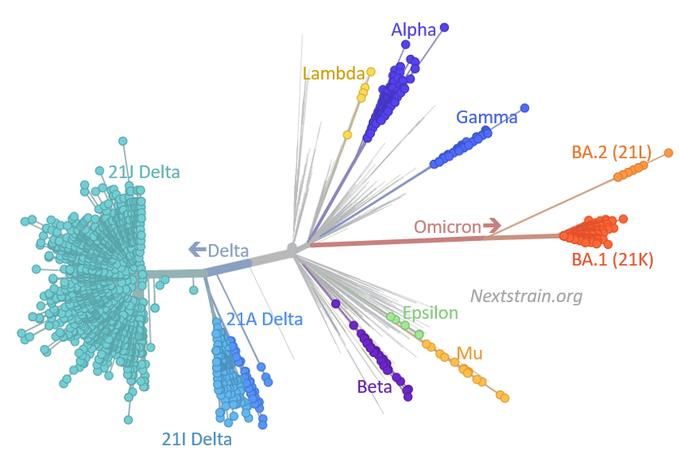
List of Figures and Tables
Figure 1: Number of new cases of COVID-19 in Scotland per day: October 2021 to
February 2022 ............................................................................................................ 6
Figure 2: Positive COVID-19 cases per 100,000 population by age (28 February
2020 to 13 February 2022) ........................................................................................ 8
Figure 3: Positive COVID-19 cases by deprivation category (SIMD) (28 February
2020 to 13 February 2022) ....................................................................................... 9
Figure 4: COVID-19 case numbers, hospital admissions and deaths. ................... 11
Figure 5: Total vaccination coverage by day (data to 18 January 2022) ................. 13
Figure 6: Vaccine effectiveness (VE) against symptomatic disease. ....................... 15
Figure 7: Vaccine effectiveness (VE) against hospitalisation. .................................. 16
Figure 8: Self-Isolation and Testing Guideline for positive cases. ............................ 20
Figure 9: Number of unplanned attendances at all A&E sites in NHS Scotland, April
2019 to December 2021 ........................................................................................... 23
Figure 10: Number of patients waiting for a new outpatient appointment at month
end, NHS Scotland, 30 September 2013 to 30 September 2021 [Source: Stage of
treatment waiting times - Inpatients, day cases and new outpatients 30 November
2021] ........................................................................................................................ 24
Figure 11: “I would avoid contacting a GP practice at the moment even if I had an
immediate medical concern (not related to Coronavirus)” [Source: YouGov] ........... 25
Figure 12: Anxiety and Happiness in Scotland ........................................................ 30
Figure 13: Employment by age and sector 2020 ...................................................... 33
Figure 14: Percentage of employees (18+) earning less than the Real Living Wage,
2021, Scotland. ........................................................................................................ 34
Figure 15: Workforce status by industry, Business Insights and Conditions Survey 35
Figure 16: Loneliness July 2021 – January 2022, Source: YouGov ......................... 38
Figure 17: Social contacts August 2020 - February 2022 (Source: Scottish Contact
Survey) ..................................................................................................................... 39
Figure 18: Economic Output Compared to Pre-Pandemic Levels ............................ 41
Figure 19: Scottish Monthly GDP over the Period of the Pandemic ......................... 42
Figure 20: Share of businesses Trading Over the Period of the Pandemic .............. 43
Figure 21: Changes in economic Output by Sector in Initial Lockdown and Compared
to Pre-Pandemic Levels ........................................................................................... 44
Figure 22: Business Views on Levels of Turnover Compared to What Would
Normally be Expected, By Sector ............................................................................. 45
Figure 23: Business Views on Cash Reserves, By Sector ....................................... 45
Figure 24: Trend in Employment and Unemployment Rate 2008-2021.................... 46
Figure 25: Business Views on Staff Shortages, By Sector ....................................... 47
Figure 26: Visits to Workplaces Compared to Pre-Pandemic Levels Over the Period
of the Pandemic ....................................................................................................... 48
Figure 27: Diagram showing variants of concern and the genetic distance between
them (where distance is in mutations). ..................................................................... 52
Figure 28: Diagram of number of sequences of each lineage in Scotland, as well as
7 day case numbers. ................................................................................................ 53
Figure 29: A composite of maps of Scotland showing LA cumulative cases,
cumulative deaths, booster coverage and proportion of datazones amongst the most
deprived. Data to 14 Feb 2022 ............................................................................... 64
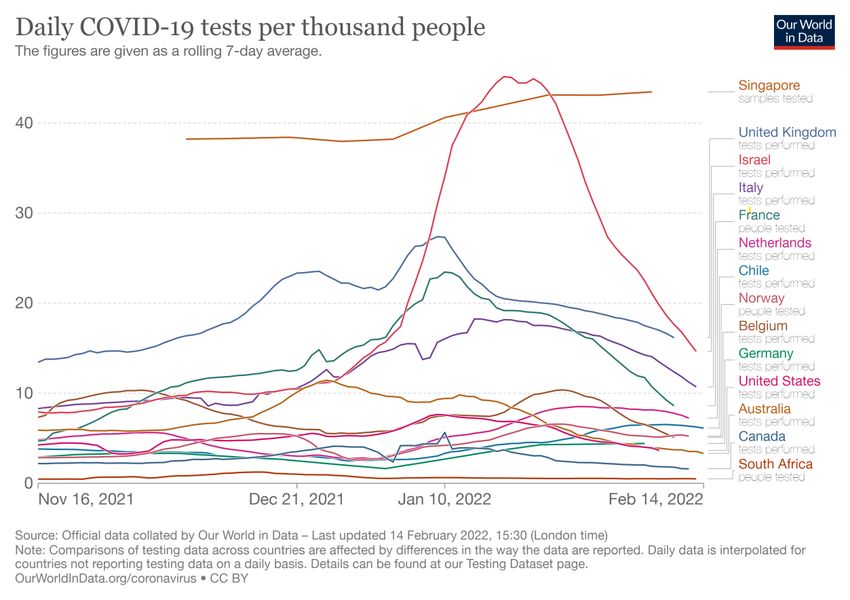
Figure 30: Daily COVID-19 tests per thousand people since 16 November 2021 in
the UK and comparator counties (Australia, Belgium, Canada, Chile, France,
Germany, Italy, Israel, Netherlands, Norway, Singapore, S. Africa and USA). ......... 68
3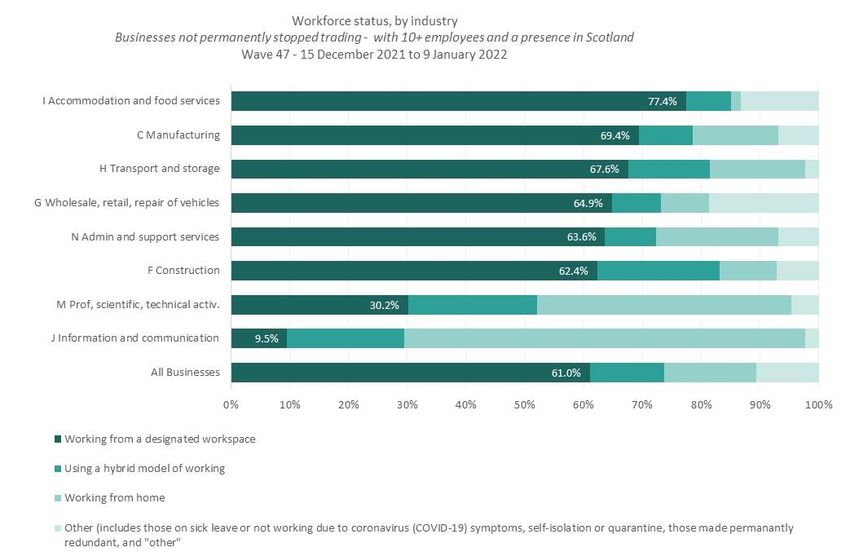
Figure 31: Potential scenarios for the future............................................................. 72
Figure 32: Potential infections, hospital occupancy, ICU occupancy, and deaths
trajectory in Immune World ...................................................................................... 74
Figure 33: Potential infections, hospital occupancy, ICU occupancy, and deaths
trajectory in Waning World ....................................................................................... 75
Figure 34: Potential infections, hospital occupancy, ICU occupancy, and deaths
trajectory in Polarised World .................................................................................... 77
Figure 35: Potential infections, hospital occupancy, ICU occupancy, and deaths
trajectory in Variant World with the same severity as Delta...................................... 79
Figure 36: Potential infections, hospital occupancy, ICU occupancy, and deaths
trajectory in Variant World with the increased severity compared to Delta ............... 81
Figure 37: Potential background level of infections over Summer 2022 under
different Worlds scenarios ........................................................................................ 82

                                                                                                                    4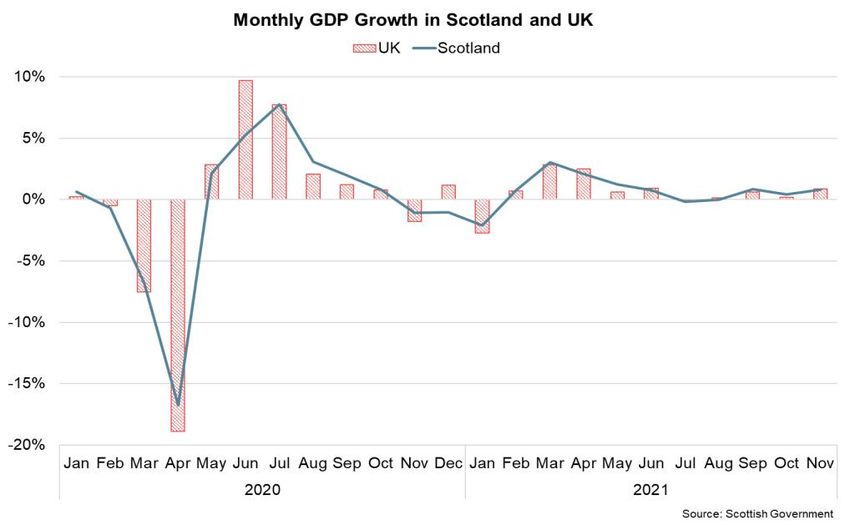
1.     Outline of the paper

The purpose of this evidence paper is to provide an overview of the key analysis and
evidence underpinning the latest refresh of the Strategic Framework.

The paper is split into two main sections. The first section establishes the current
position across all four harms as previously identified in the December 2020 paper
“Framework for decision making – assessing the four harms of the crisis”1. The
second section of the paper looks forward presenting the latest evidence
underpinning the approaches proposed in the updated Strategic Framework for
managing the epidemic as it moves into the next stage. It then sets out 4 plausible
futures to illustrate how the future may unfold. Finally the paper considers how the
epidemic could be monitored and reported in the future.

2.     Where we are now

2.1    Introduction

This section starts off by describing the pattern of the epidemic since November
2021, the date of the last Strategic Framework update. It then considers the impact
of new variants, recent changes in testing practice and the range of measures
applied in Scotland to reduce the impact of Omicron.

The analysis continues to set out the current position regarding health and social
care, society and the economy to complete the 4 harms analysis.

2.2    The pattern of the epidemic since November 2021

The November publication of the Strategic Framework followed a period of fairly
level number of cases which fluctuated throughout the month of October 2021, see
Figure 1.

The average number of PCR (polymerase chain reaction) confirmed cases each day
remained fairly level throughout November, see Figure 1. By 30 November 2021
there was an average of 2,656 PCR confirmed daily cases by specimen date.
Omicron was first reported in Scotland on 29 November 2021 (based on a sample
from 23 November)2 and became the dominant strain on 17 December. Throughout
December cases rapidly increased to a peak on 3 January 2022 of 16,407 (7-day
average) PCR confirmed cases per day by specimen date. This peak was
considerably higher than previous peaks in September 2021 (6,439 average daily
PCR cases) and July 2021 (3,318 average daily PCR cases).

1
  Coronavirus (COVID-19): framework for decision making - assessing the four harms - gov.scot
(www.gov.scot)
2
  Omicron variant - gov.scot (www.gov.scot)
                                                                                                5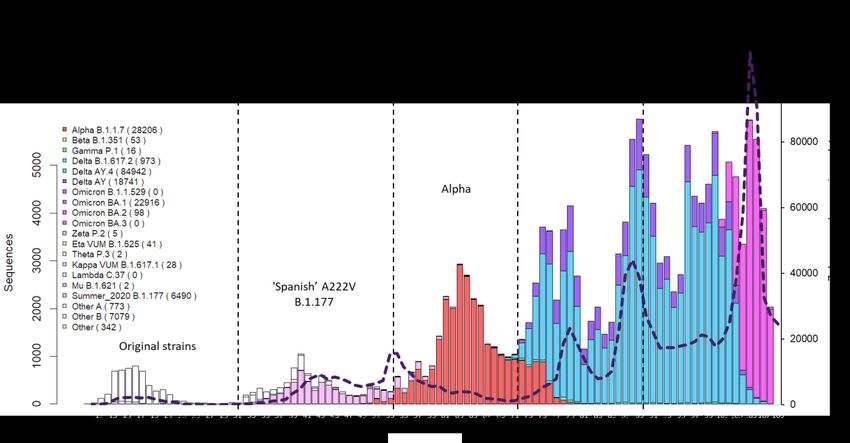
Figure 1: Number of new cases of COVID-19 in Scotland per day: October 2021 to February 20223

3
    COVID-19 Daily Dashboard | Tableau Public

                                                                                                6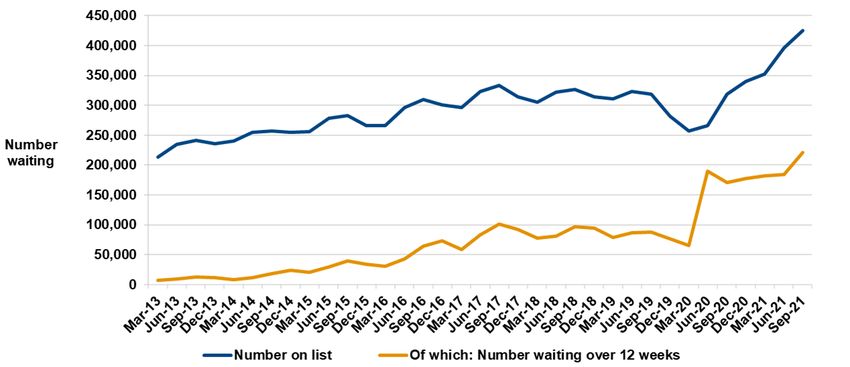
On 5 January 2022, the Scottish Government announced4 that people who do not
have symptoms of COVID-19 would no longer be asked to take a PCR test to
confirm a positive Lateral Flow Device (LFD) result. Instead, anyone with a positive
LFD, who does not have symptoms, is required to report the result online as soon as
the test is done. This means that those without symptoms who previously would
have taken a confirmatory PCR test, no longer do so. Data has been updated to
reflect the new case definition for those who have recorded a first positive PCR or
LFD from 5 January 2022, see Figures 1 and 4.

Since the peak in early January 2022 there has been a decreasing trend in both
PCR confirmed cases and in PCR and LFD cases reported to mid-January. The
seven-day average number of combined PCR or LFD daily cases has levelled off
since around 18 January, with a slight overall decrease in the most recent two
weeks, see Figure 4. The Covid-19 Infection Survey also shows that the number of
people in the private residential population testing positive for COVID-19 decreased
from a peak on 3 and 4 January 2022 and then fluctuated from mid to late January5.

Since November 2021, those aged 60 and over have consistently had lower case
rates, than those aged under 60. The peak in case rates in early January 2022 was
largely driven by those in the 20-39 age group, followed by those aged 40-59 and
those aged under 206. PCR and LFD case rates have levelled off for those aged 25
and over since mid-January, and have remained at similar levels with minor
fluctuations throughout the weeks. Among those aged 19 or younger, weekly case
rates increased from mid-January, peaking on 26 January. The weekly case rate for
this age group has since decreased, but in the week to 12 February the weekly case
rate for those aged 16 to 17 remained similar to the previous week 7.

Overall, males and females have typically had a similar case rate, with females
having a slightly higher number of cases per 100,000, see Figure 2. Females aged
64 and under tend to have higher levels of Covid case rates than males in the same
age groups, and the trend is reversed for those aged 65 to 84. The Equalities Impact
Assessment, will be published at a later date and provides more detail on COVID-19
inequalities.

4
  Self-Isolation and testing changes - gov.scot (www.gov.scot)
5
  Coronavirus (COVID-19): infection survey - gov.scot (www.gov.scot)
6
  Coronavirus (COVID-19): state of the epidemic - gov.scot (www.gov.scot)
7
  Coronavirus (COVID-19) state of the epidemic 18 February 2022 - gov.scot (www.gov.scot)
                                                                                            7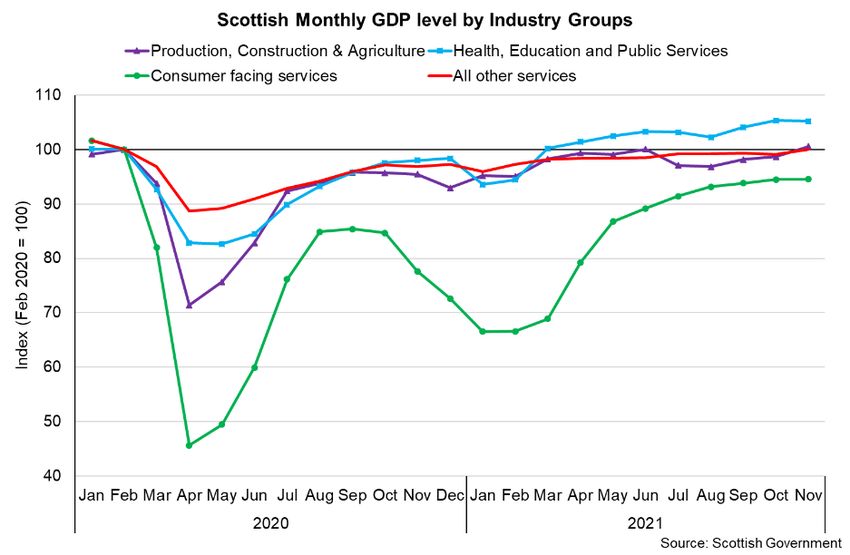
Figure 2: Positive COVID-19 cases per 100,000 population by age (28 February
2020 to 13 February 2022) 8

                                   45,000.00
    Cases per 100,000 population

                                   40,000.00
                                   35,000.00
                                   30,000.00
                                   25,000.00
                                   20,000.00                                              Female
                                   15,000.00                                              Male
                                   10,000.00                                              Total
                                    5,000.00
                                          -
                                               0-4 5-14 15- 20- 25- 45- 65- 75- 85+
                                                        19 24 44 64 74 84
                                                               Age group

Over the course of the pandemic, the total rate of positive cases per 100,000 in
Scotland is highest in the most deprived quintile, followed by the second most
deprived, see Figure 3.

8
 Dashboard - COVID-19 statistical report - 16 February 2022 - COVID-19 statistical report -
Publications - Public Health Scotland
                                                                                                   8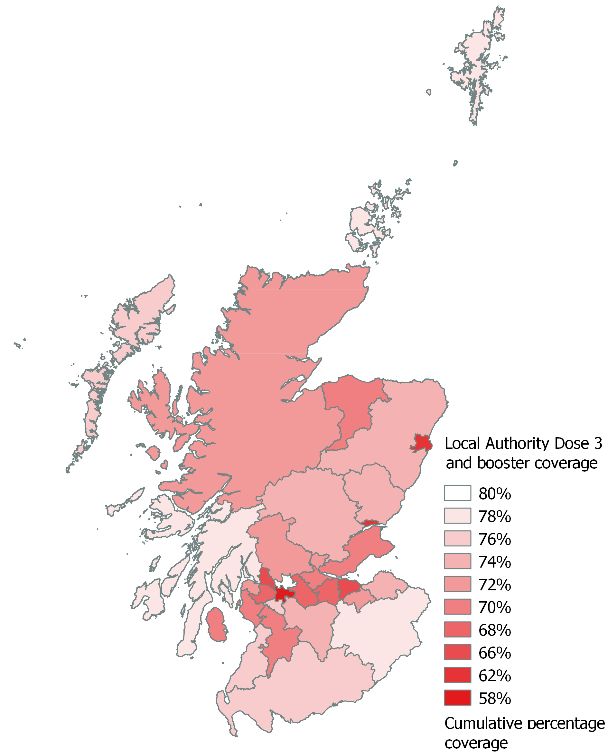
Figure 3: Positive COVID-19 cases by deprivation category (SIMD) (28 February
2020 to 13 February 2022) 9 10

                                           300,000
    Cases by deprivation category (SIMD)

                                           250,000

                                           200,000

                                           150,000

                                           100,000

                                            50,000

                                                0
                                                      1 (most    2           3            4     5 (least
                                                     deprived)                                 deprived)
                                                                 Deprivation category (SIMD)

The relationship between infections and serious health harms has weakened
significantly compared to earlier stages of the pandemic. Serious health harm
continues but at much lower levels for a given number of cases than in the past.
However, the rapid increase in PCR confirmed cases as a result of the spread of the
Omicron variant translated into a high level of COVID-19 hospital admissions,
peaking at a seven day average of over 160 per day at the beginning of January
2022. This was at a similar level to the previous peaks in September 2021 (peaking
at an average of over 160 per day) and lower than the peak in January 2021
(peaking at an average of over 200 per day), see Figure 4. COVID-19 hospital
admissions have continued to decrease since the peak in early January 2022.

In general, throughout the pandemic, older age groups have had the highest COVID-
19 admissions to hospital11. Those aged 65 and over have had more admissions to
hospital per 100,000 compared to the average for all ages (899 admissions per
100,000), while those aged 85 and over have had over 5,400 admissions to hospital
per 100,000.

Overall, through the course of the pandemic, males and females have typically had a
similar hospital admissions rate, with males having a slightly higher number of
COVID-19 related hospital admissions per 100,000. Females aged between 5 and

9
  Dashboard - COVID-19 statistical report - 16 February 2022 - COVID-19 statistical report -
Publications - Public Health Scotland
10
   Based on the Scottish Index of Multiple Deprivation (SIMD): Scottish Index of Multiple Deprivation
2020 - gov.scot (www.gov.scot)
11
   Dashboard - COVID-19 statistical report - 16 February 2022 - COVID-19 statistical report -
Publications - Public Health Scotland
                                                                                                           9
44 have tended to have higher levels of admissions than males in the same age
groups, and the trend is reversed for those aged 45 and over12.
COVID-19 admissions to hospital have also been highest for those in the most
deprived quintile, and lowest for those in the least deprived quintile 13 14. The latest
data available shows that as at 30 September 2021, compared to White Scottish,
rates of hospitalisation or death were estimated to be around 4-fold higher in
Pakistani and Mixed groups, and around 2-fold higher in Indian, Other Asian,
Caribbean or Black, and African groups. Higher rates were also observed in White
Other. Lower rates were observed in patients recorded as White Irish 15 16.
In the past four weeks, from 8 January 2022 to 4 February 2022, the age-
standardised rate of hospital admissions per 100,000 were 2.9 to 3.8 times lower in
individuals with their third dose or booster dose of vaccine compared to
unvaccinated individuals or have received one or two doses of a COVID-19
vaccine17.
Deaths were on a decreasing trend throughout November and December 2021,
there was an average of 18 daily deaths in the first week in November, compared to
over 8 in the last week in December 2021. Deaths have increased in January 2022
to over 21 deaths per day on 19 January 2022 and have since decreased, see
Figure 4.
Throughout the pandemic, deaths involving COVID-19 have been highest for those
aged 75 and over18. From the start of the vaccination programme, there have been
6,268 confirmed COVID-19 related deaths with a positive PCR result and where
COVID-19 was recorded as an underlying or contributory cause on the death
certificate19. In the week from 29 January to 4 February 2022, 74 individuals tested
positive for COVID-19 more than fourteen days after receiving their booster or third
dose of vaccine and subsequently died with COVID-19 recorded as underlying or
contributory cause of death. The majority of these individuals had several
comorbidities which contributed to their deaths and the mean age was 82 years
old20.
12
COVID-19 & Winter Statistical Report (publichealthscotland.scot)
13
COVID-19 Daily Dashboard | Tableau Public
14
Based on the Scottish Index of Multiple Deprivation (SIMD): Scottish Index of Multiple Deprivation
2020 - gov.scot (www.gov.scot)
15
Public Health Scotland COVID-19 Statistical Report
16
This release includes analysis of 34,199 COVID-19 related admissions and deaths where ethnic
group was available. For more details on the methodology please see Public Health Scotland COVID-
19 Statistical Report
17
COVID-19 & Winter Statistical Report (publichealthscotland.scot)
18
Deaths involving coronavirus (COVID-19) in Scotland | National Records of Scotland
(nrscotland.gov.uk)
19
COVID-19 & Winter Statistical Report (publichealthscotland.scot)
20
COVID-19 & Winter Statistical Report (publichealthscotland.scot)
10Figure 4: COVID-19 case numbers, hospital admissions and deaths.21 22 23
In response to Omicron, the booster vaccination roll out was scaled up during
November and December, see Figure 5. In line with advice from the Joint Committee
on Vaccination and Immunisation (JCVI), a booster dose or a third dose of the
vaccine is now available in Scotland, including all adults aged over 16 for whom it
has been at least 12 weeks since their second dose24. Over 3.3 million people
(70.6% of those over 12 years of age) have received their dose 3 or booster vaccine
by 18 February 202225. Antibody data indicates that Scotland’s COVID-19 antibody
levels in adults have remained high26.
Booster vaccine uptake is at least 92% amongst both males and females aged 60 or
over, and around 90% for those aged 55 to 59. However, there is a difference
between male and female vaccine uptake among those aged between 18 and 49
with females showing a higher uptake compared to males27. The analysis shows that
21
Seven-day moving averages of cases by specimen date and reporting date (left-hand axis) and
deaths and hospitalisation (right-hand axis). Source: Public Health Scotland, data available at: Weekly
COVID-19 Statistical Data in Scotland - Datasets - Scottish Health and Social Care Open Data
(nhs.scot)
22
Cases data includes Lateral Flow Device (LFD) test results from 5th January 2022 to reflect the
revised testing strategy. A case is now defined as a person’s first LFD or PCR positive test.
23
Seven-day moving averages of cases by specimen date (left-hand axis) and deaths and
hospitalisation (right-hand axis). Data up to 12/02/2022. Source:
https://www.opendata.nhs.scot/dataset/covid-19-in-scotland/resource/2dd8534b-0a6f-4744-9253-
9565d62f96c2 and Coronavirus (COVID-19): trends in daily data - gov.scot (www.gov.scot)
24
Coronavirus (COVID-19) booster vaccination | The coronavirus (COVID-19) vaccine
(nhsinform.scot)
25
Public Health Scotland COVID-19 dashboard:
https://public.tableau.com/profile/phs.covid.19#!/vizhome/COVID-
19DailyDashboard_15960160643010/Overview
26
Coronavirus (COVID-19) Infection Survey, antibody and vaccination data, UK - Office for National
Statistics
27
State of the Epidemic in Scotland – 21 January 2022 (www.gov.scot)
11across all age groups, vaccination uptake for the third or booster dose has been the
highest among White ethnic groups. Vaccine uptake was lowest in African ethnic
groups, except for those aged 40 to 49 and 50 to 54 years. In these two age groups,
vaccination uptake was the lowest among the Caribbean or Black group. There is
variation across age within each ethnic group, with higher uptake in older age
groups. These trends mirror the uptake of the second dose of the vaccine, as the
third or booster dose relies on previous doses being administered.
In their report published on 2 February 202228, Public Health Scotland (PHS),
provided an analysis on vaccination equality in Scotland29. Vaccination data are from
8 December 2020 to 30 January 2022, and the analysis contains comparisons by
ethnicity and socio-economic deprivation by age bands. These analyses highlight
differences in uptake between demographic groups and areas, but they do not
examine causative factors for the inequalities, which will be numerous and complex.
In the four weeks from 8 January 2022 to 4 February 2022, in an age-standardised
population, the death rate in individuals that received a booster or third dose of a
COVID-19 vaccine was between 4.6 and 9.5 times lower than individuals
who are unvaccinated, or have only received one or two doses of a COVID-19
vaccine.30 31
28
Public Health Scotland COVID-19 & Winter Statistical Report
29
Uptake rates presented in the analysis use different denominators than those in the Public Health
Scotland COVID-19 Daily Dashboard and will show lower rates than the daily publication. The
estimates used to calculate population denominators by ethnicity and deprivation are from the CHI
registration and may over-estimate the population size as they will include, for example, some
individuals no longer resident in Scotland who have not deregistered with a GP in Scotland
30
in an age-standardised population
31
COVID-19 & Winter Statistical Report (publichealthscotland.scot)
12Figure 5: Total vaccination coverage by day (data to 18 January 2022)32 33
2.3 An overview of Omicron
Omicron was first reported in Scotland on 29 November 2021 from a sample taken
on 23 November and it quickly became the dominant variant, with more than half of
COVID-19 cases being Omicron on 17 December 2021 34 35 36 37. It has spread
rapidly around the world and caused large waves of infections in many countries38.
Omicron has a significant growth advantage over Delta, the previous dominant
variant in Scotland39. Omicron can infect people who have been vaccinated or who
have had a previous infection more readily compared to Delta. Omicron has multiple
genetic mutations allowing it to evade antibodies and other immune responses
developed through vaccination or natural infection40.
The Office for National Statistics (ONS) estimates the risk of reinfection was 16 times
higher in the Omicron-dominant period (20 December 2021 to 9 January 2022)
compared with the Delta-dominant period (17 May to 19 December 2021)41. The risk
of reinfection with Omicron was estimated in a modelling study carried out by
32
Public Health Scotland COVID-19 dashboard:
https://public.tableau.com/profile/phs.covid.19#!/vizhome/COVID-
19DailyDashboard_15960160643010/Overview
33
From Thursday 11 November 2021, ‘booster & dose 3’ are combined under one number. Until then,
the numbers reported were for booster vaccine.
34
Omicron variant - gov.scot (www.gov.scot)
35
Public Health Scotland COVID-19 & Winter Statistical Report (5 January)
36
Public Health Scotland COVID-19 & Winter Statistical Report (20 December)
37
Omicron in Scotland - Evidence Paper (www.gov.scot)
38
Coronavirus (COVID-19) Cases - Our World in Data
39
*12 January 2022 Risk assessment for SARS-CoV-2 variant: Omicron VOC-21NOV-01 (B.1.1.529)
(publishing.service.gov.uk)
40
*12 January 2022 Risk assessment for SARS-CoV-2 variant: Omicron VOC-21NOV-01 (B.1.1.529)
(publishing.service.gov.uk)
41
Coronavirus (COVID-19) Infection Survey, characteristics of people testing positive for COVID-19,
UK - Office for National Statistics
13Imperial College London, where results suggested that due to the immune evasion
properties of Omicron, protection against infection reduced to 19%42.
However, Omicron infections are generally less severe and less likely to result in
hospital admission than Delta43 44 45. Preliminary data from the UK Health Security
Agency (UKHSA) indicated that the risk of attending hospital or emergency care is
estimated at around half for Omicron compared to Delta, and the risk of being
admitted from emergency care around one third of Delta46 47. Early data also
indicated that the severity of disease once in hospital, assessed by, for example
admission to ICU, is lower than observed in early phases of previous waves 48. The
most recent analysis showed that the risk of hospital admission with Omicron
compared to Delta varied by age, with similar risk of hospital admission among
children aged under 10 years old, with an approximate 75% reduction in the risk of
hospital admission among those 60 to 69 years old. The risk of death was
approximately 60% lower among Omicron cases compared to Delta 49.
Vaccine effectiveness against symptomatic disease with the Omicron variant is lower
compared to the Delta variant and wanes rapidly. Protection against symptomatic
disease from two doses of vaccine is very low (10% or less) after 20 weeks. With a
booster, vaccine effectiveness varies according to the vaccine administered but
ranges from around 60 to 75% two to four weeks after vaccination dropping to
between 25-40% after 15 weeks50, see Figure 6.
Protection against hospitalisation from vaccination is greater than that against
symptomatic disease, in particular after a booster dose, with data showing vaccine
effectiveness over 75% 10 to 14 weeks after receiving a Pfizer/BioNTech booster
dose. Vaccine effectiveness against hospitalisation remains at 90-95% up to 9
weeks post-vaccination when receiving a Moderna booster dose51, see Figure 7.
Protection against mortality from vaccination drops to 59% 25 weeks after the
second dose. Two weeks after the booster dose protection is restored to 95% for
people aged 50 or over52.
42
Omicron largely evades immunity from past infection or two vaccine doses | Imperial News |
Imperial College London
43
12 January 2022 Risk assessment for SARS-CoV-2 variant: Omicron VOC-21NOV-01 (B.1.1.529)
(publishing.service.gov.uk)
44
SARS-CoV-2 variants of concern and variants under investigation- Technical briefing 34
(publishing.service.gov.uk)
45
SAGE 102 minutes: Coronavirus (COVID-19) response, 7 January 2022 - GOV.UK (www.gov.uk)
46
*12 January 2022 Risk assessment for SARS-CoV-2 variant: Omicron VOC-21NOV-01 (B.1.1.529)
(publishing.service.gov.uk)
47
SARS-CoV-2 variants of concern and variants under investigation (publishing.service.gov.uk)
48
*S1476_SAGE_102_minutes.pdf (publishing.service.gov.uk)
49
SARS-CoV-2 variants of concern and variants under investigation (publishing.service.gov.uk)
50
COVID-19 vaccine surveillance report - week 6 (publishing.service.gov.uk)
51
COVID-19 vaccine surveillance report - week 6 (publishing.service.gov.uk)
52
COVID-19 vaccine surveillance report - week 4 (publishing.service.gov.uk)
14Figure 6: Vaccine effectiveness (VE) against symptomatic disease.
VE by period after the second and third (booster) doses for Delta (black squares)
and Omicron (grey circles) for a) recipients of 2 doses of Oxford/AstraZeneca
(ChAdOx1-S) vaccine as the primary course and Pfizer/BioNTech (BNT162b2) or
Moderna (mRNA-1273) as a booster; b) recipients of 2 doses of Pfizer/BioNTech
vaccine as the primary course and Pfizer/BioNTech or Moderna as a booster, and c)
2 doses of Moderna as a primary course and Pfizer/BioNTech or Moderna as a
booster53.
53
COVID-19 vaccine surveillance report - week 6 (publishing.service.gov.uk)
15Figure 7: Vaccine effectiveness (VE) against hospitalisation.
VE by period after the second and booster doses for Delta (black squares) and
Omicron (grey circles) for a) recipients of 2 doses of Oxford/AstraZeneca (ChAdOx1-
S) vaccine as the primary course and Pfizer/BioNTech (BNT162b2) or Moderna
(mRNA-1273) as a booster; b) recipients of 2 doses of Pfizer/BioNTech vaccine as
the primary course and Pfizer/BioNTech or Moderna as a booster54.
54
COVID-19 vaccine surveillance report - week 6 (publishing.service.gov.uk)
162.4 The impact of BA.2
A sub-lineage of Omicron, termed BA.2, was designated a VUI by the UKHSA (VUI-
22JAN-01) on 19 January 202255. BA.2 does not have the spike gene deletion at 69-
70 that causes S gene target failure (SGTF), seen in the Omicron BA.1 sub-
lineage56. BA.1 and BA.2 share 38 nucleotide and amino-acid mutations and BA.2
contains an additional 28 mutations and a deletion at 25-2757 58; BA.1 has additional
20 mutations59.
As of 18 February, there had been 893 cases of BA.2 reported in Scotland60. BA.2
has spread globally, overtaking the BA.1 lineage and making up the majority of
sequenced cases in Denmark, India, Philippines, South Africa, Qatar and Sri Lanka
as of 7 February 202261 62.
The UKHSA risk assessment 63 of 9 February identifies with a moderate confidence,
that BA.2 has an overall growth advantage over BA.1 with preliminary data showing
increased household secondary attack rates in the UK (13.4% vs 10.3% in other
Omicron cases)64. Evidence also suggests that the transmissibility of BA.2 is greater
than BA.1 and/or serial interval (time from symptom onset of a primary case to
55
COVID-19 vaccine surveillance report - week 5 (publishing.service.gov.uk)
56
SARS-CoV-2 variants of concern and variants under investigation (publishing.service.gov.uk) 28
January 2022
57
SARS-CoV-2 variants of concern and variants under investigation- Technical briefing 34
(publishing.service.gov.uk)
58
CoVariants
59
SARS-CoV-2 variants of concern and variants under investigation (publishing.service.gov.uk)
60
Variants: distribution of case data, 18 February 2022 - GOV.UK (www.gov.uk)
61
Nextstrain / ncov / gisaid / global
62
CoVariants
63
Risk assessment for SARS-CoV-2 variant: VUI-22JAN-01 (BA.2) 9 February 2022
(publishing.service.gov.uk)
64
SARS-CoV-2 variants of concern and variants under investigation (publishing.service.gov.uk) 28
January 2022
17symptom onset in their identified contacts) of BA.2 is shorter than BA.1, however
there is currently no evidence to suggest that immune evasion is different between
the two lineages of Omicron. There is also currently insufficient data to determine
any difference in infection severity65.
Current evidence suggests vaccine effectiveness against symptomatic disease is
similar for BA.1 and BA.2 sub-lineages of Omicron. After 2 doses effectiveness was
10% (9-11%) and 18% (5-29%) respectively for BA.1 and BA.2, after 25+ weeks.
This increased to 69% (68-69%) for BA.1 and 74% (69-77%) for BA.2 at 2 to 4
weeks following a booster vaccine and decreased to 49% (48-50%) for BA.1 and to
46% (37-53%) for BA.2 after 10 weeks post vaccination66. Preliminary (not yet peer
reviewed) analysis of transmission of BA.1 and BA.2, in Danish households indicate
that transmissibility from unvaccinated primary cases in BA.2 households was
increased compared to BA.1 households with an odds ratio of 2.62 (95%-CI 1.96-
3.52). This pattern of increased transmission in BA.2 households was not observed
for fully vaccinated and booster-vaccinated primary cases. Susceptibility of infection
with BA.2 was increased when compared to BA.1 regardless of vaccination status 67.
2.5 Changes in testing
In the last few months since the November update to the Strategic Framework, the
Omicron variant has emerged and cases rates increased steeply. Part of the
response was a shift in guidance to encourage the use of lateral flow testing with
lateral flow devices (LFDs). Current guidance is to use LFD tests regularly when you
have no symptoms. You should test twice a week, as well as before socialising or
travelling68.
Although LFDs are less sensitive than molecular tests such as PCR, they are easier
to perform and provide a rapid test result, within 15-30 minutes.
How well LFDs work at detecting SARS-CoV-2 in a person, depends on many
factors, such as how infectious the person is, if they have symptoms, the time since
their symptoms started and how well they do the test. Although estimates for how
sensitive the LFDs are when detecting COVID-19 vary between studies and
situations, numerous studies found that LFDs are around 95% effective at detecting
SARS-CoV-2 when used at the onset of symptoms or for cases with high viral
65
Risk assessment for SARS-CoV-2 variant: VUI-22JAN-01 (BA.2) 9 February 2022
(publishing.service.gov.uk)
66
COVID-19 vaccine surveillance report - week 6 (publishing.service.gov.uk)
67
Transmission of SARS-CoV-2 Omicron VOC subvariants BA.1 and BA.2: Evidence from Danish
Households | medRxiv
68
Coronavirus (COVID-19): getting tested in Scotland - gov.scot (www.gov.scot)
18concentrations 69 70 71 72 73 74 75 76. These studies were done before Omicron
emerged. However, initial data from laboratory studies indicates a comparable
sensitivity of LFDs to Omicron as to that observed for previous strains of SARS-CoV-
2 including Delta77.
In general, LFDs are less sensitive than PCR at detecting the virus and it is possible
to miss an infection just before the peak of infectiousness that a PCR test would pick
up78 79 80. Therefore it is best to take a LFD test as close as possible before meeting
other people for the best chance of detecting infectious individuals and avoiding
transmission81 82 83.
Current guidance is to isolate for 10 days if you've had a positive PCR or LFD test
result but no symptoms. You may be able to end self-isolation early if you have 2
negative LFD test results in a row from day 6 onwards, taken 24 hours apart. The
key to this regimen is that people should not end isolation early without the two
negative LFD tests as there is significant risk that they could still be infectious84 85 86,
see Figure 8.
69
Comparing the diagnostic accuracy of point-of-care lateral flow antigen testing for SARS-CoV-2
with RT-PCR in primary care (REAP-2) - EClinicalMedicine (thelancet.com)
70
Comparative performance of SARS CoV-2 lateral flow antigen tests demonstrates their utility for
high sensitivity detection of infectious virus in clinical specimens | medRxiv
71
Real-life validation of the Panbio™ COVID-19 antigen rapid test (Abbott) in community-dwelling
subjects with symptoms of potential SARS-CoV-2 infection - EClinicalMedicine (thelancet.com)
72
UK evaluation_PHE Porton Down University of Oxford_final.pdf
73
Lateral flow device performance data - GOV.UK (www.gov.uk)
74
Frontiers | Factors that Influence the Reported Sensitivity of Rapid Antigen Testing for SARS-CoV-2
| Microbiology (frontiersin.org)
75
Rapid, point‐of‐care antigen and molecular‐based tests for diagnosis of SARS‐CoV‐2 infection -
Dinnes, J - 2021 | Cochrane Library
76
Diagnostic accuracy of rapid antigen tests in asymptomatic and presymptomatic close contacts of
individuals with confirmed SARS-CoV-2 infection: cross sectional study | The BMJ
77
SARS-CoV-2 variants of concern and variants under investigation (publishing.service.gov.uk)
78
Diagnostics for COVID-19: moving from pandemic response to control - The Lancet
79
Discordant SARS-CoV-2 PCR and Rapid Antigen Test Results When Infectious: A December 2021
Occupational Case Series | medRxiv
80
20220110_Self-isolation_Scientific-Summary_Final-clean.pdf (koha-ptfs.co.uk)
81
https://www.ecdc.europa.eu/sites/default/files/documents/Options-for-the-use-of-rapid-antigen-
tests-for-COVID-19-first-update.pdf
82
Schools COVID-19 operational guidance - GOV.UK (www.gov.uk)
83
A cluster randomised trial of the impact of a policy of daily testing for contacts of COVID-19 cases
on attendance and COVID-19 transmission in English secondary schools and colleges
84
Mitigating isolation: The use of rapid antigen testing to reduce the impact of self-isolation periods
(medrxiv.org)
85
Test to release from isolation after testing positive for SARS-CoV-2 | medRxiv
86
20220110_Self-isolation_Scientific-Summary_Final-clean.pdf (koha-ptfs.co.uk)
19Figure 8: Self-Isolation and Testing Guideline for positive cases87.
Positive LFD tests no longer require a confirmatory PCR test. This
applies regardless of vaccine status unless advised to or are applying for
the self-isolation support grant
According to the Scottish Contact survey from 3 – 9 February, approximately 76% of
individuals had taken at least one LFD within the last 7 days. This decreased from
87
changes-to-self-isolation-flowchart_fp_360x268-lores-final-14jan22.pdf (nhsinform.scot)
2078% for the survey from two weeks prior. Polling data shows that the proportion who
reported taking a COVID-19 test ‘in the past week’ declined slightly – from 64% (18-
19 January) to 58% (1-2 February 2022), although reporting of results has remained
stable (47%).
After a decrease in the number of LFD tests that were reported between 27
December 2021 and 9 January 2022, there was a peak in reported LFD tests on 16
January 2022, with 810,225 reported tests88. The weekly total of tests reported in the
week to 13 February decreased by 5% from the previous week leading up to 6
February. There were 714,319 reported tests in the week to 13 February 89.
2.6 Measures in Scotland to reduce the effect of Omicron90
The overall objective of these measures when implemented, were to slow the spread
of the Omicron variant, to ensure that the National Health Service (NHS) could cope
with potential patient numbers and to try and limit workforce absences from less
serious illness. As data emerged that Omicron was less severe than Delta, resulting
in reduced hospital admissions and patients requiring treatment within ICU, a lifting
of the additional measures occurred in a stepwise manner.
The World Health Organisation (WHO) declared Omicron as a variant of concern on
26 November 202191, and in order to slow the introduction of Omicron into Scotland,
11 South African countries had a temporary travel ban imposed and were added to
the UK red travel list meaning all travellers returning to Scotland from these countries
were required to quarantine on arrival at a managed hotel for 10 days 92 93 94 95.
These countries were removed from the UK red list on 15 December96. From 7
December 97 all arrivals into Scotland required pre-departure and arrival tests, which
was scaled back to just unvaccinated individuals from 7 January 2022, with
vaccinated travellers only requiring an arrival test 98. From 11 February, fully
vaccinated travellers no longer required to test99.
On 29 November the first case of Omicron was reported in Scotland, from a sample
taken on 23 November 100 101. In response to Omicron, the booster vaccination roll
out was scaled up during November and December with those aged 18+ able to
book an appointment from 15 December 2021102.
88
Show all releases - Publications - Public Health Scotland
89
COVID-19 & Winter Statistical Report (publichealthscotland.scot)
90
See Annex A for a timeline of legislative requirements and guidance.
91
Classification of Omicron (B.1.1.529): SARS-CoV-2 Variant of Concern (who.int)
92
https://www.gov.scot/news/tackling-the-threat-of-new-covid-19-variant/
93
Red list of countries and territories - GOV.UK (www.gov.uk) (Edit from 25 November)
94
Tackling the threat of new COVID-19 variant - gov.scot (www.gov.scot)
95
Pre-departure test requirement for travel - gov.scot (www.gov.scot)
96
11 countries removed from international travel red list - gov.scot (www.gov.scot)
97
Pre-departure test requirement for travel - gov.scot (www.gov.scot)
98
Easing of restrictions on international travellers - gov.scot (www.gov.scot)
99
UK open for travel with all restrictions removed for eligible vaccinated arrivals - GOV.UK
(www.gov.uk)
100
Omicron variant - gov.scot (www.gov.scot)
101
Public Health Scotland COVID-19 & Winter Statistical Report
102
Boosting support for the vaccination programme - gov.scot (www.gov.scot)
21From 11 December 2021, all household contacts of confirmed positive cases were
required to isolate for 10 days103. On 6 January, this regulation was ended for triple
vaccinated individuals with daily testing required instead and self-isolation for
positive individuals could end with two consecutive negative LFD tests from day 6
taken 24 hours apart. The need for a confirmatory PCR test was also removed 104.
On 17 December 2021, as Omicron became the dominant variant in Scotland, legal
requirements were introduced for businesses to take reasonable measures to
minimise transmission of coronavirus and guidance was given to limit indoor
socialising to 3 households with LFD testing before meeting105 106 107.
On 26 and 27 December 2021, legislation was introduced that cancelled large
events, 1m physical distancing and table service was required in hospitality and
leisure facilities and nightclubs were closed108. Limitations on large scale outdoor
events were removed on 17 January 2022 with the rest of the restrictions
implemented after Christmas being lifted on 24 January, along with the guidance to
limit socialising indoors to 3 households109 110. Vaccine certification remains in place
for these events including the use of a negative test and the requirement for a third
dose which were added to the certification scheme on 6 December 2021 and 17
January 2022 respectively111 112.
For the start of the January school term, children aged 12-15 were encouraged to
get their second dose, staff and pupils were advised to perform LFD tests before
returning to school and more guidance was given to schools to grouping students
and increase ventilation113 114 115.
2.7 Summary
This section of the paper traces the development of the pandemic since November
2021 when the previous update of the Strategic Framework was published. It covers
a period of change as Omicron BA.1 emerged and became the dominant variant
followed by BA.2. Over this period changes were implemented in testing and in the
measures introduced to manage the emergence of Omicron which were
strengthened and subsequently relaxed in a staged approach.
103
Evidence paper on rapid rise of Omicron cases - gov.scot (www.gov.scot)
104
Self-Isolation and testing changes - gov.scot (www.gov.scot)
105
Coronavirus (COVID-19) update: First Minister's speech – 17 December 2021 - gov.scot
(www.gov.scot)
106
Limiting the spread of Omicron - gov.scot (www.gov.scot)
107
New measures required to slow the spread of Coronavirus - gov.scot (www.gov.scot)
108
Omicron restrictions take effect - gov.scot (www.gov.scot)
109
Large outdoor events resume from 17 January - gov.scot (www.gov.scot)
110
Omicron measures to be lifted - gov.scot (www.gov.scot)
111
Negative test added to certification - gov.scot (www.gov.scot)
112
Large outdoor events resume from 17 January - gov.scot (www.gov.scot)
113
COVID vaccine for 12-15 year olds - gov.scot (www.gov.scot)
114
Returning to school safely - gov.scot (www.gov.scot)
115
Keeping schools safe - gov.scot (www.gov.scot)
223. Health and Social Care in Scotland
3.1 Introduction
The COVID-19 pandemic has affected demand, attendances, planned and
unplanned care and waiting times across NHS Scotland and social care in a number
of ways. Approaching two years of the NHS being on an emergency footing, demand
continues to be very significant. System capacity has been impacted by COVID-19
infection control requirements, redeployment of staff, capacity to treat COVID-19
patients, delayed discharges and COVID-19 related staff absences. The Scottish
Government has published the NHS Recovery Plan that sets out key ambitions and
actions to be delivered now and over the 5 years to address the backlog in care and
meet ongoing healthcare needs for people across Scotland.
3.2 Hospital and GP services
Large decreases in attendances at A&E services in NHS Scotland were observed in
spring 2020 and winter 2020/21. Since spring 2021 attendances at A&E have been
rising and are getting closer to the pre-COVID levels. From the summer of 2021
performance against the four hour standard has dropped below 80%. During
December 2021, there were 110,934 attendances at A&E services in Scotland; of
these, 75.7% of attendances at A&E services were seen and resulted in a
subsequent admission, transfer or discharge within 4 hours.116
Figure 9: Number of unplanned attendances at all A&E sites in NHS Scotland, April
2019 to December 2021
[Source: A&E activity and waiting times - Month ending 31 December 2021]
There has been a large increase in the number of people waiting to be seen as
outpatients.117 At 30 September 2021, 425,242 patients were waiting to be seen as
outpatients, 33% higher than at 30 September 2020. People are also typically
waiting longer to be seen. For example, 48% of people had been waiting 12 weeks
or less at the quarter ending 30 September 2021, markedly down on the 73%
reported on average in 2019. During the quarter ending 30 September 2021,
286,935 new outpatients were seen. This is 121% higher than the 129,944 patients
116
A&E activity and waiting times - Month ending 31 December 2021
117
Stage of treatment waiting times - Inpatients, day cases and new outpatients 30 November 2021
23seen in the quarter ending 30 June 2020, during the first wave of the pandemic, but
22% lower than the quarterly average of 367,226 during 2019, prior to the onset of
the pandemic.
Figure 10: Number of patients waiting for a new outpatient appointment at month
end, NHS Scotland, 30 September 2013 to 30 September 2021 [Source: Stage of
treatment waiting times - Inpatients, day cases and new outpatients 30 November
2021]
There has also been an increase in the number of patients waiting to be admitted as
inpatients or day cases covered by the Treatment Time Guarantee (TTG).118 At 30
September 2021, 106,496 patients were waiting to be admitted for treatment, 25%
higher than at 30 September 2020. Of those waiting, 37% had been waiting 12
weeks or less, markedly down on the 69% reported at the end of quarters in 2019.
The reduction in activity is also reflected in the number of patients admitted for
treatment under TTG. During the quarter ending 30 September 2021, 45,449
patients were admitted for treatment. This is 210% higher than the 14,673 patients
seen in the quarter ending 30 June 2020, during the first wave of the pandemic, but
36% lower than the quarterly average of 70,594 during 2019, prior to the onset of the
pandemic.
During quarter ending 30 September 2021, there were 4,011 eligible referrals for the
62-day cancer treatment standard, a 31.6% increase compared with quarter ending
30 September 2020.119 During quarter ending 30 September, 83.1% of patients
started treatment within the 62-day standard compared to 87.3% for quarter ending
30 September 2020. There were 6,329 eligible referrals within the 31-day standard
during quarter ending 30 September 2021, a 27.4% increase compared with quarter
ending 30 September 2020. During quarter ending 30 September, 96.7% of patients
started treatment within the 31-day standard compared to 98.4% for quarter ending
30 September 2020.
118
Stage of treatment waiting times - Inpatients, day cases and new outpatients 30 November 2021
119
Cancer waiting times - 1 July to 30 September 2021
24GP services, and the progress with plans to redesign120 these, have been impacted
by the COVID-19 pandemic. Some services were paused or altered during 2020,
including the reduction of appointment times, restrictions to patient capacity and
workforce reallocation. Many appointments shifted to telephone or video
consultations, with face-to-face appointments offered following telephone triage
where necessary.
There has been a reluctance among some to seek non-COVID-19 healthcare
treatment during the COVID-19 pandemic. Since the end of October 2021 between
20-29% of people agreed or strongly agreed that they would avoid contacting a GP
practice at the moment even if they had an immediate medical concern (not related
to Coronavirus)121. Responses were broadly similar across different groups of the
population. The most recent data shows that in early February 2022, the proportion
of people who agree that they would avoid contacting a GP practice for immediate
non-COVID-19 health concerns was 24%.
Figure 11: “I would avoid contacting a GP practice at the moment even if I had an
immediate medical concern (not related to Coronavirus)” [Source: YouGov]
The COVID-19 pandemic has resulted in severe and sustained impacts on social
care services over the last two years, with the latest comparable data showing
COVID-19 deaths in care homes, since the start of the pandemic up to 6 February
2022, as amounting to 29% of all COVID-19 deaths in Scotland. The effects of the
pandemic have been wide-ranging and have impacted on current wider social care
system pressures, with for example, the number of people whose discharge from
hospital was delayed increasing to almost 1,400 in December 2021, up from around
1,000 in the first half of 2021.
120
Primary care improvement plans - implementation: progress summary - March 2021 - gov.scot
(www.gov.scot)
121
Public attitudes to coronavirus - gov.scot (www.gov.scot)
253.3 Population Health
The COVID-19 pandemic has seen the introduction of a range of restrictions at
various stages of the pandemic that has affected our day to day lives in our
communities and has affected how our health, education and other public services
have functioned. This likely to have impacted in different ways on population health
at various stages in the life-course, well beyond the direct impacts of COVID-19.
Many people who have experienced severe COVID-19 disease, or died with COVID-
19, have pre-existing health conditions including dementia, Alzheimer’s disease,
diabetes, cardiovascular disease, chronic obstructive pulmonary disease, kidney
disease and other chronic conditions. Further, and to some extent associated with
multi-morbidity, the health impact of COVID-19 has not been shared equally. After
adjusting for age, up to December 2021, people in the most deprived areas were 2.5
times more likely to die with COVID-19 than those living in the least deprived
areas122. Recent work by PHS and partners showed that the extent of inequality due
to COVID-19 was similar to averting all annual Disability Adjusted Life Years
(DALYs) due to diabetes123.
The impact of Long-COVID has yet to be fully understood and has implications for
health care in the future. An estimated 1.3 million people living in private households
in the UK (2% of the population) were experiencing self-reported Long-COVID
symptoms according to the ONS Infection Survey as of 2 January 2022. The
equivalent estimate for Scotland, is 100,000 people and 1.9% of the population124.
These are symptoms persisting for more than four weeks after the first suspected
coronavirus (COVID-19) infection that were not explained by something else125.
Notably, receiving two doses of a coronavirus (COVID-19) vaccine at least two
weeks before a first test-confirmed COVID-19 infection was associated with a 41%
decrease in the odds of self-reported Long-COVID at least 12 weeks later, relative to
similar study participants who were not vaccinated when infected.
The most recently published evidence on the impact of COVID-19 on health
behaviours that impact on population health is mixed. It shows a mix of both stable,
positive and negative change on health behaviours, such as alcohol and tobacco
consumption, diet and physical activity.
For example:
• A range of survey studies suggest that up to around a fifth of the adult
population self-report drinking more than prior to the pandemic with a similar
proportion drinking less126. This may explain why the evidence suggests an
122
Deaths involving coronavirus (COVID-19) in Scotland | National Records of Scotland
(nrscotland.gov.uk)
123
Inequalities in population health loss by multiple deprivation: COVID-19 and pre-pandemic all-
cause disability-adjusted life years (DALYs) in Scotland | International Journal for Equity in Health |
Full Text (biomedcentral.com)
124
Confidence limits for UK and Scotland overlap
125
Prevalence of ongoing symptoms following coronavirus (COVID-19) infection in the UK - Office for
National Statistics (ons.gov.uk) Estimates presented in this analysis relate to self-reported long
COVID, as experienced by study participants who responded to a representative survey, rather than
clinically diagnosed ongoing symptomatic COVID-19 or post-COVID-19 syndrome in the full
population.
126
» Portman Group-YouGov research on pandemic drinking and the return to pubs
26You can also read