Fabricating a Raman spectrometer using an optical pickup unit and pulsed power - Nature

Page created by Melissa Potter
 
CONTINUE READING
Fabricating a Raman spectrometer using an optical pickup unit and pulsed power - Nature
www.nature.com/scientificreports

            OPEN            Fabricating a Raman spectrometer
                            using an optical pickup unit
                            and pulsed power
                            Young Chai Cho & Sung Il Ahn*

                            Although Raman spectroscopy is a major analytical tool in modern chemical experiments, commercial
                            Raman spectrometers remain very pricey for educational and research purposes in individual
                            university laboratories. Thus, this study focused on the structural similarity between the Raman
                            spectrometer and an optical pickup unit (OPU), which is an inexpensive compact optical device used
                            for a part of optical discs. The study investigated whether or not a full set of Raman spectrometer can
                            be developed at a cost of less than 1,000 US$. The OPU-based Raman spectrometer was fabricated
                            using 3D printer-made components, a Raman edge filter, and a laser diode with a wavelength of
                            520 nm as the light source. A function generator was used as a pulsed power source to analyze the
                            characteristics of the OPU Raman spectrometer according to various frequencies and duty ratios.
                            When using a pulsed DC power supply, the laser wavelength tended to move to a longer wavelength
                            with increases in duty ratios. That is, the higher the frequency at the same duty ratio, the weaker the
                            background light intensity compared with the scattered Raman signal intensity. The findings illustrate
                            that Raman signal strength can be adjusted by adjusting the focal length of the objective lens of the
                            OPU through an external adjustment of an additional DC power. In the Raman spectra of all solid and
                            liquid samples used, the maximum error rate reached approximately 11 cm−1, whereas the maximum
                            intensity deviation reached approximately ± 6%. The cost of the complete OPU Raman spectrometer
                            is less than 1,100 US$ using a function generator as power source and less than 930 US$ using a DC
                            adapter. If the optical density (OD) 6 filter can be replaced with the OD 4 filter, then the costs are
                            expected to decrease to approximately 730 US$.

                            Raman spectrometers are very powerful tools used for the simple and rapid identification of chemical species
                            in chemical-related laboratories. In particular, it is considered one of the essential spectroscopic methods along
                            with the research and development of low-dimensional carbon compounds, such as carbon nanotubes, graphene,
                            and carbon d  ­ ots1–6. Since C. V. Raman discovered Raman scattering in 1­ 9287, various Raman spectrometers
                            have been developed after extensive research and improvement. Light scattering can be classified into Mie and
                            Rayleigh scatterings dependent on the size of scattering m     ­ aterials8. Mie scattering is a phenomenon in which
                            the light of all colors is scattered evenly regardless of the wavelength due to particle sizes that are larger than the
                            incident wavelengths of lights. When the size of the scattering matter is much smaller than the wavelength of
                            light, the difference lies in the degree of scattering according to the wavelength of the incident light. The second
                            form, namely, Rayleigh scattering, causes the sky to appear blue. Most photon incidents on a molecule undergo
                            Rayleigh scattering at the same wavelength as the incident light. However, a few photons scatter inelastically,
                            where the wavelength of the scattered light changes due to the interaction with the molecules. When such a
                            Raman scattering occurs, the wavelengths of the scattered light may decrease or increase, and such a scattering
                            is called Stokes Raman scattering or anti-Stokes Raman scattering, respectively (Fig. 1). Anti-Stokes Raman scat-
                            tering consistently holds lesser intensity than Stokes Raman scattering because it is a phenomenon that occurs
                            in molecules in the excitation state. Therefore, most Raman spectrometers are manufactured using the Stokes
                            Raman scattering, which occurs in ground-state molecules. When Raman scattering occurs, the wavelength of
                            the incident light shifts due to the difference in the intrinsic vibrational energy of the molecule. Each molecule
                            has a specific vibrational energy, such that this frequency difference has its own value. Therefore, the composition

                            Department of Chemistry Education, Graduate Department of Chemical Materials, Institute for Plastic Information
                            and Energy Materials, Pusan National University, Busandaehakro 63‑2, Busan 46241, Republic of Korea. *email:
                            sungilahn@pusan.ac.kr

Scientific Reports |   (2020) 10:11692                 | https://doi.org/10.1038/s41598-020-68650-7                                              1

                                                                                                                                            Vol.:(0123456789)
www.nature.com/scientificreports/

                                                 Stokes shift                              Rayleigh Scattering                                Anti-Stokes Shift
                                                  Virtual State

                                      Photons

                                                                          2                                               2                                          2
                                                                          1                                               1
                                           S0                                                                                                                        1
                                                                          0                                               0                                          0
                                                                              Vibration energy
                                                                                 level ( vib)               Rayleigh

                                                                               Stokes
                                                            Intensity
                                                                                                                          Anti-Stokes

                                                                                   ex      vib         ex (excitation)            ex+   vib

                                      Figure 1.  Rayleigh scattering versus Stokes Raman and anti-Stokes Raman scattering.

                                       a                                                                     b
                                         Laser                                                                                                        Detector
                                                                Focusing
                                                                  Lens

                                                                                                                                                  Focusing lens
                                           Beam Splitter                                Spectrometer                                              Beam splitter
                                                                                                               Laser Diode

                                                                          Notch
                                                                                                                         Grating                    Objective lens
                                                                          Filter
                                           Microscope                                                           Collimator lens
                                            Objective                                                                                                 Voice coil motor

                                            Sample                                                                                        Disc

                                      Figure 2.  Simplified Raman spectrometer and OPU structure comparison: (a) Raman spectrometer. (b) OPU
                                      of a compact disc player.

                                      or structure of a chemical can be confirmed through Raman scattered light. Figure 2a provides the structure of
                                      a simplified Raman spectrometer.
                                          Raman spectrometers have been commercialized in various means dependent on the wavelength of laser light
                                      sources, optical paths, or slightly different arrangements in the interior space. However, commercialized Raman
                                      spectrometers are difficult to use in individual university labs or educational purposes because of their prices. To
                                      solve the cost problem, various studies have been conducted to directly manufacture a Raman spectrometer at
                                      a low ­price9–12. Mohr et al. studied a Raman spectrometer and assembled optical components and a green laser
                                      point at 532 nm applicable to undergraduate education and research p     ­ urposes9. In addition, Rossi et al. studied
                                      a Raman spectrometer using a commercially available camera and various optical ­filters12. Although previous
                                      studies reported cheaper prices than commercially available Raman spectrometers, cost and structural problems
                                      remained due to problems in the light path control and use of expensive spectrometers.

          Scientific Reports |   (2020) 10:11692 |                      https://doi.org/10.1038/s41598-020-68650-7                                                       2

Vol:.(1234567890)
www.nature.com/scientificreports/

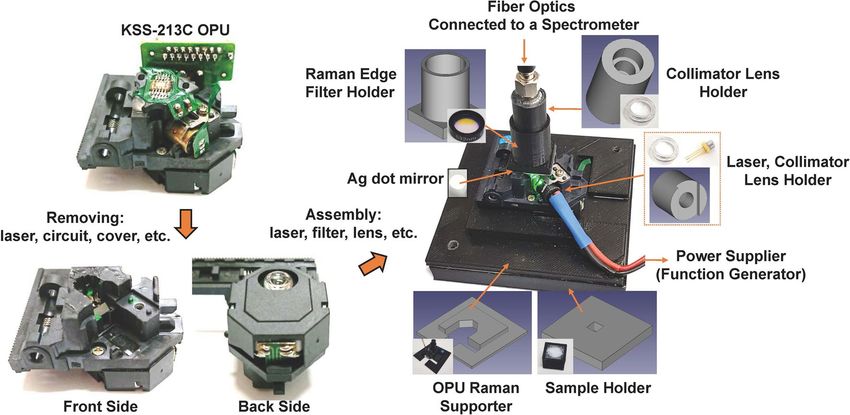
                            Figure 3.  Schematics of the Raman spectrometer manufacturing process and optical images of each part.

                                The optical pickup unit (OPU) used in the optical disk in Fig. 2b is an extremely small and precise optical
                            device. Many studies have applied it as an optical device, such as an optical ­microscope13, for measuring the
                            thermal vibration of a microcantilever for atomic force m­ icroscopy14. The OPU is also useful for refractive index
                            measurement at the femtoliter ­scale and a biological sensor at the nano- and micro-scale ­levels16 due to its
                                                                    15

                            various functions. It has also been applied in micropatterning ­devices17, optical fluid scanning to detect protein
                            aggregation in m ­ icrofluidics18, and DNA replication using magnetic nano-beads19. As previously described, the
                            OPU has been applied to various optical devices and research, but it has been rarely used on a Raman spectrom-
                            eter. In fact, the structure of the OPU has a large similarity with that of a Raman probe. Therefore, the present
                            study fabricated a Raman spectrometer using the OPU to overcome the aforementioned problems, such as dif-
                            ficulty in controlling optical paths and cost.

                            Results and discussion
                            Figure 3 shows the process of manufacturing the Raman spectrometer using the OPU (KSS-213C) for a compact
                            disc player. Figure 3 shows that the OPU Raman was manufactured using a laser diode (LD), essential optical
                            parts, and connecting parts made of 3D printers, while maintaining the optical path, lens, and focal length adjust-
                            ment functions of the OPU. We analyzed the OPU Raman spectrometer using various electrical signals formed
                            by the function generator as the power source (see the Experiments section and Supplementary Information
                            for detailed descriptions of the fabrication method). The LD is frequently operated by a direct current power
                            source. However, we controlled the electrical signal to reduce the power consumption of the LD, which leads
                            to a reduced risk of eye damage. In addition, this feature can enhance resolution and reproducibility by reduc-
                            ing heat formation during the operation of LD, which causes a wavelength shift in the laser. Toward this end,
                            the Raman spectrometer was analyzed using a square-pulsed DC made from a function generator as the power
                            source. First, the frequency was fixed at 100 Hz to analyze the effect of the duty ratio on the OPU Raman, and
                            the duty ratio was adjusted from 10 to 80% to analyze the shift in the center wavelength of the laser and benzene
                            spectrum according to each duty ratio.
                                After the measurement, the horizontal axis indicated by the wavelength was changed in wavenumber units
                            based on the laser wavelength. Raman spectra were acquired after baseline fitting using MagicPlot Student (ver.
                            2.7.2, Magicplot Systems, LLC; see Supplementary Information on how to correct the baseline). Figure 4a shows
                            that the center wavelength of the laser increases with the increase in the duty ratio. This result is considered a
                            phenomenon that occurs as the current amount increases, whereas the internal temperature of the LD increases
                            with the increase in the duty ratio. Although this case differs from the LD, similar wavelength changes have been
                            reported in light-emitting diodes in terms of the duty r­ atio20.
                                The graph in Fig. 4b denotes the Raman spectra of benzene obtained with the increase in the duty ratio. When
                            comparing the position of the 992 cm−1 peak as the reference peak, the intensity of the peak gradually increased
                            with the increase in the duty ratio, and the position of the peak indicated a shift similar to the wavelength shift
                            of the laser.
                                To understand the characteristics of the OPU Raman according to the frequency, the duty ratio was fixed.
                            By contrast, the frequency was varied to measure the change in the center wavelength of the LD and reference
                            peak position of benzene. The deformation of the voltage waveform was observed at a high frequency. Thus, the
                            frequency dependency of the OPU Raman was analyzed within a range of 500 Hz or less.
                                First, after setting the duty ratio to 10%, frequency was increased by 50 Hz to measure the change in the center
                            wavelength of the laser. Figure 4c illustrates that the laser wavelength had slight changes with the increase in the
                            frequency. In contrast to the Raman spectrum of benzene, which is dependent on the duty ratio, the main peak

Scientific Reports |   (2020) 10:11692 |               https://doi.org/10.1038/s41598-020-68650-7                                             3

                                                                                                                                         Vol.:(0123456789)
www.nature.com/scientificreports/

                                                                       526                                                                         600

                                                                                     a                                                                                                        b

                                              Laser Peak Wavelength (nm)
                                                                                                                                                                           80 %
                                                                       524                                                                         450                     70 %

                                                                                                                               Intensity (a. u.)
                                                                                                                                                                           60 %
                                                                                                                                                                           50 %
                                                                       522                                                                         300                     40 %
                                                                                                                                                                           30 %
                                                                                                                                                                           20 %
                                                                       520                                                                         150
                                                                                                                                                                            10 %
                                                                                                                                                                                  900 1000 1100 1200

                                                                       518                                                                           0
                                                                                 0   10 20 30 40 50 60 70 80 90 100                                      600      1200     1800      2400      3000
                                                                                               Duty Cycle (%)                                                            Wavenumber (cm-1)

                                                                           521                                                                     180

                                                                                     c                                                                                                        d
                                     Laser Peak Wavelength (nm)

                                                             520.8                                                                                             Frequency Increase
                                                                                                                                                                  (50 ~ 500 Hz)

                                                                                                                              Intensity (a. u.)
                                                                                                                                                   120
                                                             520.6

                                                             520.4
                                                                                                                                                    60

                                                             520.2
                                                                                                                                                                          800       1000     1200

                                                                           520                                                                       0
                                                                                 0       100   200     300     400    500                                600      1200     1800      2400      3000
                                                                                               Frequency (Hz)                                                            Wavenumber (cm-1)

                                        Figure 4.  Spectral characteristics of laser and benzene according to pulsed DC signals: (a) Wavelength shift of
                                        LD according to duty ratio. (b) Raman spectra of benzene according to the duty ratio. (c) Wavelength shift of the
                                        LD according to the frequency at 10% duty ratio. (d) Raman spectra of benzene dependent on frequency at 10%
                                        duty ratio.

                                        of benzene at 992 cm−1 was nearly unchanged with the increase in the frequency (Fig. 4d). However, although
                                        the position and relative intensity of the Raman peak were the same, the intensity of the Rayleigh scattering was
                                        reduced under the high-frequency conditions. These results indicate that Raman scattering intensity increases
                                        at the same laser power when measured at high frequencies at the same duty ratio.
                                            Any device using an OPU has the advantage of focusing through vertical and horizontal distance adjustments
                                        when voltage is applied to the coil around the objective lens of the OPU. The study investigated the effect of
                                        focal length adjustment by controlling the applied voltage using a variable resistor (100 Ω) and a battery (3 V).
                                        Experiments were conducted using liquid benzene and the solid powder form of anthracene. The sample was
                                        placed at a distance similar to the known focal length of the objective lens (an aspheric lens with a focal length
                                        of 3.86 mm, working distance of 2.1 mm, and 0.45 numerical aperture), and the Raman spectrum according
                                        to resistance change was analyzed. Figure 5a shows changes in the Raman spectra of liquid benzene with the
                                        increase in resistance, where little change was observed within a certain focal length. Conversely, in the case of
                                        anthracene, a nonuniform solid sample was noted in Fig. 5b, where the intensity of the peak at 1,402 cm−1 varies
                                        depending on the resistance value. After passing the critical resistance (25 Ω), the figure shows that nearly the
                                        same intensity of the peak is obtained. This result shows that the focal length of the OPU Raman can be adjusted
                                        by simply adjusting the external voltage for the coil of the OPU.
                                            Considering the characteristics of the OPU Raman obtained in the basic experiment, Raman spectra were
                                        obtained for solid (anthracene and naphthalene) and liquid (benzene and acetone) samples. Afterward, Raman
                                        spectra were analyzed after a baseline correction of the spectrum for each sample. The Raman spectrum was
                                        obtained for the liquid sample under the following conditions: 400 Hz, duty ratio of 10%, and 20,000 ms integral
                                        time. Figure 6a illustrates the baseline corrected Raman spectrum of benzene, and Table 1 provides data on the
                                        major peaks of the known Raman peaks of b    ­ enzene21. The spectrum shows a difference of up to 6 cm−1 compared
                                        with known Raman peaks. In the case of acetone, the Raman signal was weakly measured at a low duty ratio and
                                        under a duty cycle of 40%, 100 Hz, and 15,000 ms integral time. After measurement, a baseline correction of
                                        the Raman spectrum was carried out after the correction of the laser wavelength measured at a 40% duty ratio.
                                        A difference of up to 3 cm−1 was observed compared with each reference peak position in Fig. 6b22. For solid
                                        samples, measurements were performed under 400 Hz, duty ratio of 10%, and 6,000 ms integration time. Raman
                                        spectra were obtained and analyzed after the baseline adjustment in the same manner as the liquid samples. The

          Scientific Reports |   (2020) 10:11692 |                                                   https://doi.org/10.1038/s41598-020-68650-7                                                        4

Vol:.(1234567890)
www.nature.com/scientificreports/

                                                200                                                                                             700

                                                                   a                                                                            560
                                                                                                                                                                 b
                                                150

                           Intensity (a. u.)

                                                                                                                           Intensity (a. u.)
                                                                                                                                                420

                                                100

                                                                                                                                                280

                                                        50
                                                                                                                                                140
                                                                                     800       1000     1200     1400                                                                 1200        1400     1600      1800

                                                         0                                                                                             0
                                                             600           1200       1800            2400       3000                                      600           1200          1800             2400        3000
                                                                                    Wavenumber (cm-1)                                                                             Wavenumber (cm-1)

                             Figure 5.  Raman spectrum obtained by adjusting focal length using a variable resistor. (a) Liquid benzene. (b)
                             Anthracene in solid powder form.

                             a                          400
                                                                           992       - As-measured
                                                                                                                             b                        400
                                                                                                                                                                          - As-measured
                                                                                     - After base-line correction                                                         - After base-line correction             2959

                                                        300                                                                                           300

                                                                                                                                  Intensity (a. u.)
                                    Intensity (a. u.)

                                                                                                                                                                  818

                                                        200                                                                                           200                      1435
                                                                                                                 3062
                                                                                                                                                                                      1739

                                                                          1171     1590
                                                        100                                                                                           100

                                                          0                                                                                             0
                                                              600         1100      1600       2100      2600      3100                                     600         1100      1600           2100      2600       3100
                                                                                  Wavenumber (cm-1)                                                                             Wavenumber (cm-1)
                                                                                                                                                                                                                   (cm-1)
                                                              Measured             Reference            Difference                                          Measured             Reference                Difference

                                                                    992               993                    1                                                    788                  790                     2

                                                                   1171               1177                   6                                                1435                    1432                     3

                                                                   1590               1587                   3                                                1709                    1710                     1

                                                                   3062               3061                   1                                                2929                    2926                     3

                             Figure 6.  Comparison of Raman spectra and reference Raman peak of a liquid sample obtained using the OPU
                             Raman spectrometer. (a) Benzene. (b) Acetone.

                                                                                             Supplier                                                                                        Price
                                  Parts                                                      (or where to buy)                                                                               (USD)
                                  OPU (KSS-213C)                                             Smartech Electronics and Machinery Manufacturing Co., LTD                                       4
                                  520 nm laser (PL520)                                       Osram opto semiconductors                                                                       20
                                                                                             Edmund Optics, 12.5 mm, OD 6                                                                    445
                                  Raman Edge Filter (532 nm)
                                                                                             or Replaceable with OD 4                                                                        245
                                  Collimator lens (PMMA)                                     Shenzhen Tyson Tech. Co
www.nature.com/scientificreports/

                                       a                      600
                                                                                                  - As-measured
                                                                                                                                                      b                      600
                                                                                                                                                                                                            - As-measured
                                                                                        1403      - After base-line correction                                                                              - After base-line correction
                                                                                                                                                                                                   1384
                                                              450

                                                                                                                                                         Intensity (a. u.)
                                          Intensity (a. u.)
                                                                                                                                                                             400

                                                                                                                                                                                     822
                                                              300
                                                                      754      1175             1562                                                                                       1024
                                                                               1194
                                                                                                                                                                                                      1454                          3057
                                                                            1008                                                                                             200             1155            1565
                                                              150                                                                3052

                                                                0                                                                                                              0
                                                                    600          1100          1600      2100          2600       3100                                             600      1100       1600         2100    2600     3100
                                                                                         Wavenumber (cm-1)                                                                                          Wavenumber (cm-1)
                                                                                                                                (cm-1)                                                                                             (cm-1)

                                                                    Measured                   Reference               Difference                                                  Measured            Reference           Difference

                                                                          1008                   1009                      1                                                               1024                 1021           3

                                                                          1195                   1188                      7                                                               1384                 1384           0

                                                                          1403                   1403                      0                                                               1454                 1463           9

                                                                          1562                   1555                      7                                                               1565                 1576          11
                                                                          3052                   3045                      7                                                               3057                 3058           1

                                       Figure 7.  Comparison of the major peaks in the Raman spectrum and reference Raman peak of the solid
                                       samples obtained using the OPU Raman spectrometer. (a) Anthracene. (b) Naphthalene.

                                                          500                                                                                                        4                                                               8

                                                                          a                                                                                                        b
                                                                                                                                1st                                                                Peak Position Dev.
                                                                                                                                                                                                   Peak Intensity Dev.
                                                                                                                                2nd
                                                          400
                                                                                                                                         Peak Position Dev. (cm-1)

                                                                                                                                                                                                                                         Peak Intensity Dev. (%)
                                                                                                                                3rd                                  3                                                               6
                                     Intensity (a. u.)

                                                                                                                                4th
                                                          300
                                                                                                                                5th
                                                                                                                                                                     2                                                               4

                                                          200

                                                                                               1300    1400     1500     1600    1700                                1                                                               2
                                                          100

                                                               0                                                                                                     0                                                               0
                                                                   600            1200            1800          2400            3000                                               1st       2nd          3rd        4th     5th
                                                                                               Wavenumber         (cm-1)                                                                    Wavenumber (cm-1)

                                       Figure 8.  Reproduction characteristics of the OPU Raman spectrometer. (a) Raman spectra of anthracene
                                       according to the measurement cycle (periodic on–off of the system 10 min after each end of measurement). (b)
                                       Peak position and intensity deviation for each spectrum.

                                       spectrum for anthracene in Fig. 7a shows a difference of up to 7 cm−1 at each major peak compared with that of
                                       the ­reference23. In addition, naphthalene in Fig. 7b shows a positional change of up to 11 cm−1.
                                           The reproducibility of the OPU Raman system was tested using anthracene, which has a relatively high Raman
                                       signal among the samples. The spectrum was obtained five times under the same condition of 400 Hz, duty ratio
                                       of 10%, and an integral time of 10,000 ms. After each measurement, the OPU Raman system was powered off,
                                       and Raman spectra were measured at intervals of 10 min. Figure 8a illustrates the spectra measured after each
                                       interval, whereas Fig. 8b provides a graph of the deviation (absolute value) of the position and intensity changes
                                       between spectra for the main peak, that is, 1,402 cm−1. The maximum deviation of the peak position is measured
                                       within ± 3 cm−1, whereas the peak intensity is measured within ± 6%. Considering the resolution of the com-
                                       mercial Raman spectrometer at 1 nm (10 cm−1), the OPU Raman system displays reasonable reproducibility.
                                           The total cost used to manufacture the OPU Raman system is calculated as approximately 1,100 US$ or less
                                       when using a function generator as power source or an optical density (OD) 6 Raman edge filter. The cost was
                                       lower at approximately 930 US$ or less when a DC adapter is used to replace the power supply. If the OD 6 fil-
                                       ter can be replaced with the OD 4 filter, then the costs are expected to reach approximately 730 US$. Based on

          Scientific Reports |   (2020) 10:11692 |                                                    https://doi.org/10.1038/s41598-020-68650-7                                                                                                                   6

Vol:.(1234567890)
www.nature.com/scientificreports/

                            the results, the OPU Raman system is expected to be widely built and utilized even in an educational research
                            environment where budget is largely insufficient.
                               In summary, for the development of the Raman spectrometer under 1,000 US$, the study explored a Raman
                            spectrometer consisting of the commercial OPU and a pulsed DC power. As a result of the experiment, Raman
                            spectra with reasonable resolutions and indicated error rates of up to 11 cm−1 were obtained from the liquid
                            and solid samples. In addition, the focal length of the OPU objective lens demonstrated controllability, and
                            Raman signal intensity can be increased by controlling the voltage applied to the coil through a variable resist-
                            ance adjustment. When the pulsed DC signal is used as power, the LD wavelength tended to move to a longer
                            wavelength with the increase in the duty ratio. The higher the frequency at the same duty ratio, the weaker the
                            intensity of the background signal compared with the Raman signal. The reproducibility of the OPU Raman
                            spectrometer showed a maximum deviation in the peak position within ± 3 cm−1 with a peak intensity of ± 6%.
                            This result showed excellent properties even when compared with a commercial Raman system using a 1 nm
                            (10 cm−1) spectrometer. In terms of cost, the proposed system can be produced within a range of 730 US$ to
                            1,100 US$. Thus, the OPU Raman spectrometer is expected to be widely used in a low-budget education and
                            research environment.

                            Methods
                            Except for the frame and electromagnet coils of the OPU (KSS-213C), other parts, such as LD, circuit con-
                            nections, covers, and a beam splitter, were removed. Subsequently, a 520 nm LD, collimator lens, Raman edge
                            filter, and reflective mirror were bonded to the OPU frame. A 3D printer (CreatBot F160) was used to build the
                            component holder or connections, an OPU Raman support, and sample holder (see CAD design in Supplemen-
                            tary Information). Finally, the power source for adjusting the focal length was connected, and the optical fiber
                            was connected to a spectrometer to complete it. The components used for the fabrication of the OPU Raman
                            were a 520-nm wavelength LD (PL 520, 50 mW, OSRAM), Raman edge filter with OD 6 (Ø12.5 mm, 537.3 nm,
                            Raman edge filter, Edmund Optics), optical fiber (SMA-type, 200-µm core diameter), and Ag dot mirror with a
                            diameter of 3 mm formed on a 0.1-mm-thick glass substrate using a silver mirror reaction. For solid samples, a
                            sample container with a glass cover was prepared using a 3D printer and a piece of slide glass. For liquid samples,
                            the sample was placed in a small vial with a diameter of 1.2 cm (to minimize air bubbles during sampling) and
                            measured through the glass surface of the bottom of the vial. Benzene (Samchun, 99.5%) and acetone (Daejung,
                            99.8%) as liquid samples and naphthalene (Daejung, 97%) and anthracene (Daejung, 97%) as solid samples were
                            measured. The Raman signal was measured by changing the duty ratio (10% to 80%) and frequency (50–500 Hz)
                            using a function generator (Owon, AG051F) as the power source for the LD. The optical spectrometer (R spec-
                            trometer, Thunder Optics) was calibrated based on the positions of 992 and 3,062 cm−1, and the characteristic
                            Raman peaks of benzene using least squares fitting were built into the software and provided with the optical
                            spectrometer. Subsequently, the wavelength of the LD was measured according to the duty ratio and frequency
                            characteristics using an ultraviolet–visible spectrometer (K-mac, 2100 V). The programs used to build and
                            measure the OPU Raman spectrometers are all freeware: FreeCAD (ver. 0.17, Open Source), Ultimaker Cura
                            for 3D printers (ver. 3.1.0, Ultimaker BV), and MagicPlot Student (ver. 2.7.2, MagicPlot Systems, LLC, for the
                            baseline correction of Raman spectra).

                            Received: 27 April 2020; Accepted: 24 June 2020

                            References
                             1. Ferrante, C. et al. Raman spectroscopy of graphene under ultrafast laser excitation. Nat. Commun. 9, 1–8 (2018).
                             2. Nanda, S. S. et al. A new device concept for bacterial sensing by Raman spectroscopy and voltage-gated monolayer graphene.
                                Nanoscale 11, 8528–8537 (2019).
                             3. Kato, H., Itagaki, N. & Im, H. J. Growth and Raman spectroscopy of thickness-controlled rotationally faulted multilayer graphene.
                                Carbon N. Y. 141, 76–82 (2019).
                             4. Chernyak, S. A. et al. Oxidation, defunctionalization and catalyst life cycle of carbon nanotubes: a Raman spectroscopy view. Phys.
                                Chem. Chem. Phys. 19, 2276–2285 (2017).
                             5. Hummer, T. et al. Cavity-enhanced Raman microscopy of individual carbon nanotubes. Nat. Commun. 7, 1–7 (2016).
                             6. Dervishi, E., Ji, Z., Htoon, H., Sykora, M. & Doorn, S. K. Raman spectroscopy of bottom-up synthesized graphene quantum dots:
                                Size and structure dependence. Nanoscale 11, 16571–16581 (2019).
                             7. Raman, C. V. & Krishnan, K. S. A new type of secondary radiation. Nature 121, 501–502. https:​ //doi.org/10.1038/121501​ c0 (1928).
                             8. McCreery, R. L. Raman Spectroscopy for Chemical Analysis (Wiley, Hoboken, 2005). https​://doi.org/10.1002/04717​21646​.
                             9. Mohr, C., Spencer, C. L. & Hippler, M. Inexpensive Raman spectrometer for undergraduate and graduate experiments and research.
                                J. Chem. Educ. 87, 326–330 (2010).
                            10. Bandyopadhyay, A. K., Dilawar, N., Vijayakumar, A., Varandani, D. & Singh, D. A low cost laser-Raman spectrometer. Bull. Mater.
                                Sci. 21, 433–438 (1998).
                            11. Ismail, N. et al. Raman spectroscopy with an integrated arrayed-waveguide grating. Opt. Lett. 36, 4629 (2011).
                            12. Rossi, E. M., Aurelio, A.-L. & Óscar, B.-E. A homemade cost effective Raman spectrometer with high performance. J. Lab. Chem.
                                Educ. 3, 67–75 (2015).
                            13. Lee, Y. C. & Chao, S. A compact and low-cost optical pickup head-based optical microscope. IEEE Trans. Magn. 50, 1–4 (2014).
                            14. Ulčinas, A., Picco, L. M., Berry, M., Heinrich Hörber, J. K. & Miles, M. J. Detection and photothermal actuation of microcantilever
                                oscillations in air and liquid using a modified DVD optical pickup. Sens. Actuators A Phys. 248, 6–9 (2016).
                            15. Dunn, R. C. Compact, inexpensive refractive index detection in femtoliter volumes using commercial optical pickup technology.
                                Anal. Methods 11, 2303–2310 (2019).
                            16. Te Hwu, E. E. & Boisen, A. Hacking CD/DVD/Blu-ray for Biosensing. ACS Sens. 3, 1222–1232 (2018).
                            17. Lee, Y.-C., Chao, S., Huang, C.-C. & Cheng, K.-C. A compact optical pickup head in blue wavelength with high horizontal stability
                                for laser thermal lithography. Opt. Express 21, 23556 (2013).

Scientific Reports |   (2020) 10:11692 |                   https://doi.org/10.1038/s41598-020-68650-7                                                            7

                                                                                                                                                           Vol.:(0123456789)
www.nature.com/scientificreports/

                                      18. Uddin, R. et al. Integration of agglutination assay for protein detection in microfluidic disc using blu-ray optical pickup unit and
                                          optical fluid scanning. in MicroTAS 2015 - 19th Int. Conf. Miniaturized Syst. Chem. Life Sci. 1807–1809 (2015).
                                      19. Donolato, M. et al. Quantification of rolling circle amplified DNA using magnetic nanobeads and a Blu-ray optical pick-up unit.
                                          Biosens. Bioelectron. 67, 649–655 (2015).
                                      20. Moreira, M. C., Prado, R. & Campos, A. Application of High Brightness LEDs in the Human Tissue and Its Therapeutic Response.
                                          Appl. Biomed. Eng. 1(InTech), 3–20 (2011).
                                      21. Wahadoszamen, M., et al. Laser Raman spectroscopy with different excitation sources and extension to surface enhanced raman
                                          spectroscopy. J. Spectrosc. 2015 (2015).
                                      22. Cossee, P. & Schachtschneider, J. H. Vibrational analysis of acetone, acetaldehyde, and formaldehyde. J. Chem. Phys. 44, 97–111
                                          (1966).
                                      23. Abasbegović, N., Vukotić, N. & Colombo, L. Raman spectrum of anthracene. J. Chem. Phys. 41, 2575–2577 (1964).
                                      24. Nedungadi, T. M. K. Analysis of the raman spectrum of single crystals of naphthalene. Proc. Indian Acad. Sci. Sect. A 15, 376–389
                                          (1942).

                                      Acknowledgements
                                      This research was supported by Basic Science Research Program through the National Research Foundation (No.
                                      2018R1A5A1025594 and No. 2019R1A2C1006771) by the Ministry of Science, ICT of Korea.

                                      Author contributions
                                      S.I.A. designed the experiments. S.I.A. and Y.C. conducted the experiments and analyzed the data. S.I.A. and
                                      Y.C. drafted the manuscript. Both authors discussed the results and commented on the manuscript.

                                      Competing interests
                                      The authors declare no competing interests.

                                      Additional information
                                      Supplementary information is available for this paper at https​://doi.org/10.1038/s4159​8-020-68650​-7.
                                      Correspondence and requests for materials should be addressed to S.I.A.
                                      Reprints and permissions information is available at www.nature.com/reprints.
                                      Publisher’s note Springer Nature remains neutral with regard to jurisdictional claims in published maps and
                                      institutional affiliations.
                                                    Open Access This article is licensed under a Creative Commons Attribution 4.0 International
                                                    License, which permits use, sharing, adaptation, distribution and reproduction in any medium or
                                      format, as long as you give appropriate credit to the original author(s) and the source, provide a link to the
                                      Creative Commons license, and indicate if changes were made. The images or other third party material in this
                                      article are included in the article’s Creative Commons license, unless indicated otherwise in a credit line to the
                                      material. If material is not included in the article’s Creative Commons license and your intended use is not
                                      permitted by statutory regulation or exceeds the permitted use, you will need to obtain permission directly from
                                      the copyright holder. To view a copy of this license, visit http://creat​iveco​mmons​.org/licen​ses/by/4.0/.

                                      © The Author(s) 2020

          Scientific Reports |   (2020) 10:11692 |                   https://doi.org/10.1038/s41598-020-68650-7                                                             8

Vol:.(1234567890)
You can also read