Facilities for Nano Materials Examination at the PULSTAR Reactor - EPJ Web of Conferences
←
→
Page content transcription
If your browser does not render page correctly, please read the page content below
EPJ Web of Conferences 247, 08012 (2021)                                                               https://doi.org/10.1051/epjconf/202124708012
PHYSOR2020

                 Facilities for Nano Materials Examination at the PULSTAR Reactor

                                                       A. I. Hawari, M. Liu, Q. Cai

                                Nuclear Reactor Program, Department of Nuclear Engineering
                                  North Carolina State University, Raleigh, NC 27695, USA
                                                 ayman.hawari@ncsu.edu

                                                                   ABSTRACT

                 The PULSTAR is a 1-MWth nuclear research reactor located at North Carolina State
                 University. It is fueled by uranium dioxide assemblies enriched to 4% or 6% in U-235 and is
                 currently under licensing for operation at 2-MWth power. The PULSTAR is a center for
                 irradiation testing and pre/post irradiation examination of materials. Among its unique
                 capabilities are positron annihilation spectroscopy (PAS) and neutron powder diffraction (NPD)
                 facilities. The PAS facility provides an intense positron beam reaching 6 × 10⁸ e+/s, which
                 drives two spectrometers; the e+-PAS and the Ps-PAS, used for studies of defects in thin film
                 materials. A Na-22 bulk PAS system is also operational, which is used for studying millimeter
                 scale materials. All spectrometers are capable of performing Doppler Broadening
                 Spectroscopy (DBS) and Positron Annihilation Lifetime Spectroscopy (PALS). To date, the
                 PAS systems have been used to characterize various materials (unirradiated and irradiated)
                 that include graphite, soft matter, and metal-organic frameworks (MOF). The NPD facility
                 uses a double focusing single crystal silicon rotating monochromator producing neutron beams
                 with different energies. A position sensitive detection bank covers a scattering angle of 5-
                 125. The facility is used in the examination of unirradiated and irradiated materials including
                 graphitic materials, magnetic materials without rare-earth elements, and anode materials used
                 in lithium batteries. The collected diffraction patterns can be processed to produce atomic pair
                 distribution functions. The PAS and NPD facilities are available through user programs
                 including the US DOE’s Nuclear Science User Facilities (NSUF) and the US NSF’s Research
                 Triangle Nanotechnology Network (RTNN).

         KEYWORDS: PULSTAR, nuclear reactor, positron annihilation, neutron diffraction, nanotechnology

                                                            1. INTRODUCTION

         The PULSTAR nuclear reactor was established as the fourth in a series of reactors on the campus of North
         Carolina State University (NCSU). It achieved first criticality and started operations in 1972. The
         PULSTAR is a light water moderated and cooled open pool in tank reactor [1]. The core is configured in
         5×5 array of assemblies with beryllium reflectors of two sides. Each assembly contains an array of 5×5
         (25) fuel pins that contain sintered uranium dioxide pellets enriched to either 4% or 6% in U-235 (per
         assembly) and clad with zircaloy 2. The total U-235 in the core is nearly 13 kg and the volume fraction of
         light water to fuel in the core is nearly unity. The PULSTAR was originally designed as a pulsing reactor
         with the maximum pulse power reaching 2200 MWth. However, since 1983 the pulsing operation of the
         PULSTAR ceased and only steady state operation is permitted by its current license.

  © The Authors, published by EDP Sciences. This is an open access article distributed under the terms of the Creative Commons Attribution License 4.0
  (http://creativecommons.org/licenses/by/4.0/).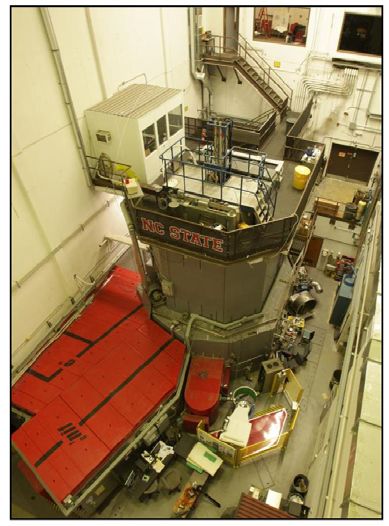
EPJ Web of Conferences 247, 08012 (2021) https://doi.org/10.1051/epjconf/202124708012
PHYSOR2020
Figure 1 below shows the arrangement of the PULSTAR core including surrounding beam tubes. In
addition, calculated spectral and spatial distributions of neutrons in the PULSTAR core are given showing
that the thermal neutron flux (energy less than 0.5 eV) is largest at core’s periphery and near the beam tubes’
entry planes. Once recognized, this design feature provided further motivation for utilization of the reactor
and developing various beamline capabilities. Consequently, over the past 18 years, the PULSTAR was
outfitted with several unique facilities including the positron annihilation spectroscopy (PAS) facility on
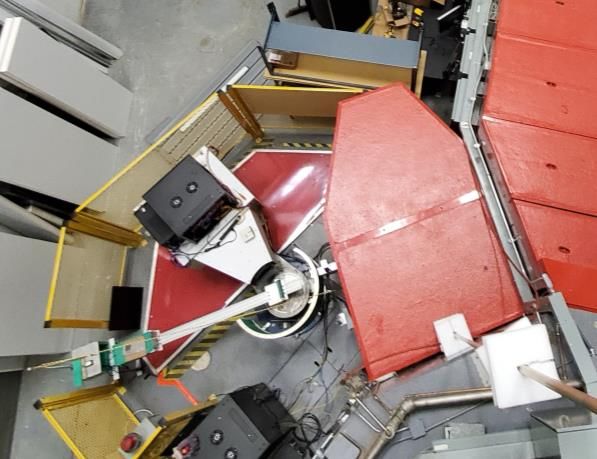
beam tube #6, and the neutron powder diffractometer (NPD) on beam tube #4 [2]. Figure 2 shows the
current PULSTAR bay area and a corresponding schematic layout of the various facilities.
Control Rod Control Rod
3.5x10⁻⁴
Reflector Edge
Core Edge
Core Edge
Thermal
Epithermal
3.0x10⁻⁴ Fast
Neutron Flux (n/cm2)
2.5x10⁻⁴
2.0x10⁻⁴
1.5x10⁻⁴
1.0x10⁻⁴
5.0x10⁻⁵
0.0
0 10 20 30 40 50
Position (cm)
Fig. 1. A layout of the PULSTAR’s core including the fuel assemblies and the beryllium reflectors
appearing on the top and left side of the core (left). The calculated energy and spatial distribution of
neutrons in the PULSTAR core illustrating the large flux of thermal neutrons (energy less than 0.5
eV) in the core’s periphery (right).
Fig. 2. A view of the PULSTAR reactor’s bay floor (left). The corresponding layout of the bay floor
showing the various facilities on each beam tube.
2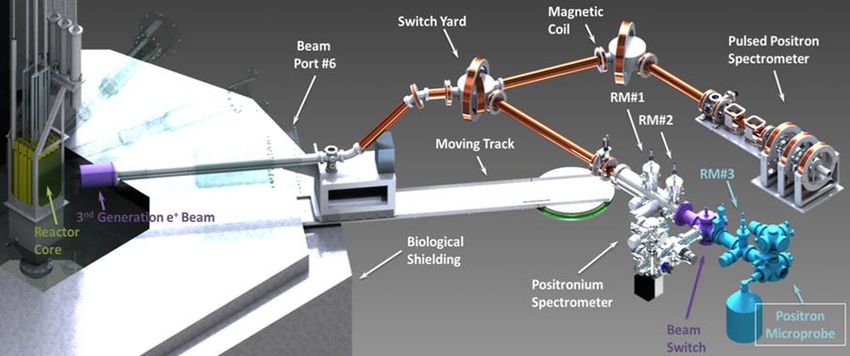
EPJ Web of Conferences 247, 08012 (2021)                                              https://doi.org/10.1051/epjconf/202124708012
PHYSOR2020

                          2. The Positron Annihilation Spectroscopy Facility and Applications

         Positron annihilation spectroscopy (PAS) has been proven to be a powerful and non-destructive tool for
         nano materials characterization, especially for studying the vacancy and free volume properties at the
         atomic level of a wide range of materials [3,4]. Techniques such as positron annihilation lifetime
         spectroscopy (PALS) measures the decay lifetime of positrons in the subject materials, which is directly
         related to the electron density surrounding the annihilating positron and is very sensitive to the
         concentration and type of vacancy defect and defect clusters. In semiconductors and insulators, positrons
         can also form positronium, a meta-stable bound state of a positron and an electron. Therefore, PALS can
         also refer to positronium annihilation lifetime spectroscopy. Another positron technique, Doppler
         Broadening Spectroscopy (DBS), examines the energy spread of the 511 keV back-to-back annihilation
         gamma-ray originating from the moving electron when the annihilation occurs and provides complementary
         information of the vacancy type and density in the energy domain.

         2.1. The PULSTAR Intense Positron Beam

         In the past decade, an intense positron beam facility with two associated spectrometers was established at
         the PULSTAR nuclear reactor [5,6]. In addition, a digital bulk positron spectrometer has been established.
         A schematic of the intense beam user facility is shown in Fig. 3 below. Positrons are produced through
         pair production in a Platinum converter, which is irradiated by high energy gamma-rays from the reactor
         core and from neutron capture in a cadmium end-cap surrounding the source. Positrons emitted from the
         Platinum with kinetic energies of a few eV are accelerated and focused electrostatically into a magnetic
         field for transport out of the bio-shield. This results in a 25 mm diameter beam with an energy of 1 keV
         and intensity of ~6 × 10⁸ positrons/second. The primary positron beam is magnetically transported out of
         the high radiation area through magnetic switches and into adjacent labs that house the two positron
         annihilation spectrometers (Fig. 3). These spectrometers are set up to conduct positron annihilation lifetime
         spectroscopy (PALS) and Doppler Broadening Spectroscopy (DBS) of annihilation irradiation. Other
         positron methodologies could also be implemented per users’ request. In addition to the beam-based
         spectrometers described above, a Na-22 based bulk PAS system is also currently operational (Fig. 4). The
         system has complete digital signal processing and data acquisition. The source-sample package can be
         placed on a heating-cooling stage inside a vacuum chamber. The temperature of thermal treatment to the
         sample ranges from approximately 80K to 600K. The sample stage is positioned in between two
         photomultiplier tube (PMT) assemblies in combination with two cylindrical plastic scintillators of
         1inch×1inch in size. The pulses from the PMTs are digitized and processed in real time to extract timing
         information, which results in approximately 170 ps timing resolution. Meanwhile, an analog system runs
         in parallel with the digital system for higher count rate experiments with less requirement on timing
         resolution. The beam and bulk systems can be used for the study of vacancy, vacancy cluster, or void
         concentration and size in various types of materials of micrometer to millimeter level thickness.

                  Fig. 3. Schematic of the intense positron beam user facility at the PULSTAR reactor.

                                                              3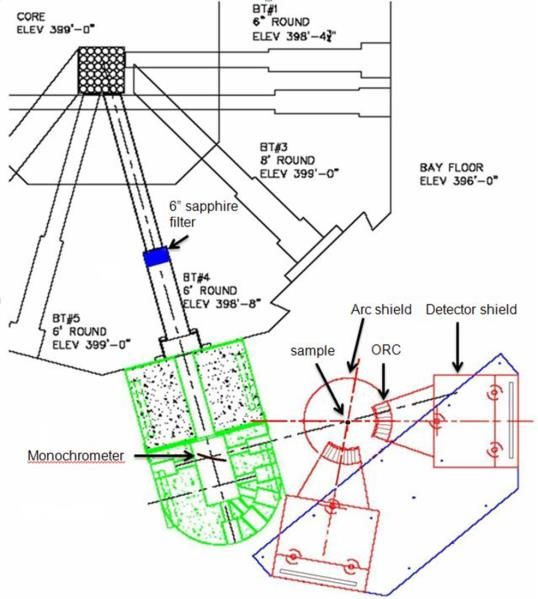
EPJ Web of Conferences 247, 08012 (2021)                                                                             https://doi.org/10.1051/epjconf/202124708012
PHYSOR2020

         Fig. 4. the e+-PAS spectrometer (left), Ps-PAS spectrometer (center), and bulk spectrometer (right).

         2.2. PAS Applications at the PULSTAR Reactor

         The PAS facility at the PULSTAR reactor has been used in various studies to investigate the nanostructure
         of materials by implementing the PALS and DBS techniques discussed above. An example is nuclear
         graphite, which is utilized as a neutron moderator/reflector as well as a structural component in various
         concepts of advanced reactors, wherein the graphite is exposed to an intense flux of neutrons that introduces
         displacement of lattice atoms and creates vacancy and interstitial Frenkel pairs. The migration and
         agglomeration of these point defects leads to effects that can alter both the structural and neutronic behavior
         of the graphite. In a previous work [7], radiation damage of nuclear graphite induced by neutrons was
         examined by PALS and specific vacancy types have been identified that were associated with the irradiation
         process and the atomic mobility (Fig. 5). This result has also been correlated to the microstructural changes
         observed by neutron diffraction patterns [8], and used to support computer simulation of nuclear graphite
         [9].

                                                                                       10
                   105                                                                               Unirradiated
                                                                                                     Irradiated
                                                                                           8
                   104
                                                                          Arbitrary Unit
          Counts

                                                                                           6
                        3
                   10

                                                                                           4

                   102
                                                                                           2

                   101
                                                                                           0
                            100   200   300   400   500   600   700                            0.0    0.1      0.2        0.3      0.4    0.5     0.6
                                          Channel                                                               Positron lifetime (ns)

                   Fig. 5. PALS spectrum (left), and lifetime distribution (right) in nuclear graphite samples [7].

         A valuable feature of PAS is that it can be utilized to monitor the changes of free volumes in-situ in samples
         under their operational conditions. For example, the swelling behavior of Cellulose nanofibrils in the
         presence of water [10]. In this study, severity of the swelling behavior of these films was found to be related
         to film drying temperatures during fabrication. Meanwhile, it is also crucial to clarify and separate the
         effect of positronium (Ps) annihilation in the free volumes and Ps bubble formation in water. A direct
         relationship has been established between the microscopic structural change due to water molecules and
         macroscopic sorption behavior. This sorption behavior is not limited to water swelling but also various gas
         adsorption processes, for instance, in metal-organic frameworks (MOFs) [11]. As a whole category of
         materials, MOFs have shown unprecedented surface areas and tunable pore sizes that could be used for a

                                                                      4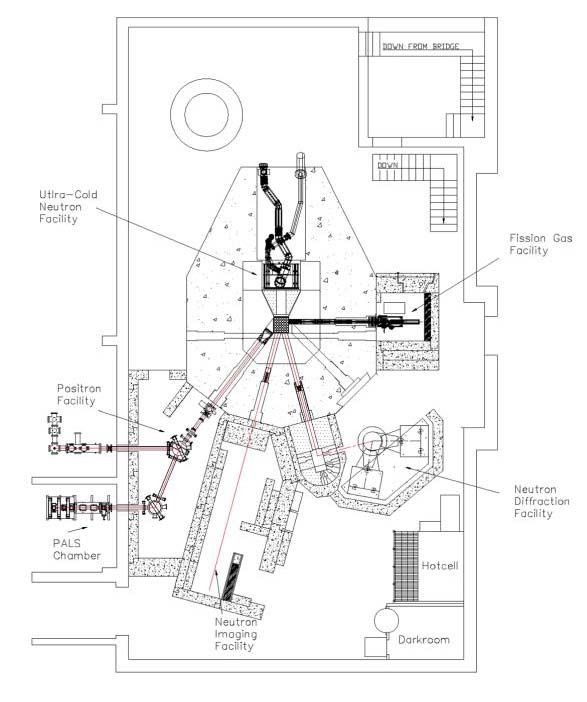
EPJ Web of Conferences 247, 08012 (2021)                                                  https://doi.org/10.1051/epjconf/202124708012
PHYSOR2020

         variety of purposes including adsorption, separation, sensing, and filtering. In these systems, the Ps lifetime
         can be directly related to the nanopore size and its change during gas adsorption, which could hugely
         improve our understanding of the crystal quality and its adsorption dynamics.

                            3. The Neutron Powder Diffractometer Facility and Applications

         Neutron powder diffraction (NPD) is an analytical technique that aims at studying the structural
         characteristics of atomic and molecular systems. Neutron diffraction has various advantages over similar
         techniques (e.g., X-ray diffraction) including penetrability and the ability to interact with light nuclei such
         as hydrogen. In NPD the data is analyzed using the Rietveld refinement technique. In this case, a powder
         diffraction pattern of a polycrystalline material is thought of as a collection of individual reflection profiles,
         each of which has a profile function, a peak height, a peak position, a breadth, and an integrated area which
         is proportional to the Bragg intensity. This intensity is proportional to the square of the absolute value of
         the structure factor. By adjusting the parameters of an assumed structure model, the Rietveld method
         establishes a best fit between the observed intensity and calculated intensity. Therefore, detailed crystal
         structure information is derived from powder diffraction using the entire measured diffraction pattern
         without allocating in advance observed intensities to particular Bragg peaks.

         3.1. The PULSTAR NPD Facility

         The Neutron Powder Diffractometer (NPD) facility is located at beam tube #4 of the PULSTAR reactor
         [12]. Two 3-inch thickness single crystal sapphire filters are employed as fast neutron and high energy
         gamma-ray filters. A double focusing single crystal silicon monochrometer, which can focus two-
         dimensional neutrons to the sample position, is employed. Monochromatic neutron beams with different
         neutron energy can be produced by the monochrometer. A bank of 15 position sensitive detectors is
         employed, spanning a range of 20, which can be moved from 15 to 115 to cover the entire scattering
         angle of 5-125. An Oscillating Radical Collimator (ORC), located at the front of the detector shielding,
         reduces the background by stopping neutrons scattered from locations other than the sample position. A
         fission chamber located at the beam, before the sample, is employed as a neutron flux monitor. The
         detectors collect data at each bank position for a fixed monitor count to ensure that the incoming neutrons
         at the sample position is similar for each position. The collected data from the 6 positions is combined into
         a full scattering angle range data. Recently, the pulse processing electronics and the detector bank motors
         and their drivers were upgraded. Figure 6 shows the NPD facility. The characteristics of the NPD are
         shown in Table 1. Typically, neutrons with a wavelength of 1.478 Å are used in the experiments, which
         are reflected by the (511) planes of silicon.

         3.2. NPD Applications at the PULSTAR Reactor

         The NPD facility was used in the examination of various materials to understand fundamental structure and
         to explore the impact on performance. The studies also included materials that have been exposed to
         neutron irradiation to explore radiation damage effects. An example is nuclear graphite [8], where the
         diffraction measurements showed that, upon irradiation, the displaced carbon atoms favor going to the large
         inter planar space to increase the average interlayer “d” spacing and its fluctuation. At the same time, the
         existence of the interstitial atoms and loops will force their neighbor layers to shift randomly, and the
         probability of random shifting increased. Furthemore, the corresponding vacancy defects in the crystal
         lattice distort the lattice in the plane locally. This distortion causes contraction along the a axis and the
         entire lateral dimension. The vacancy defects in the crystal lattice may join together to form vacancy loops
         that collapse the planar structure of graphite. Figure 7 below shows the measured diffraction patterns and
         the related pair distribution functions that are derived as the Fourier transforms of the patterns.

                                                                 5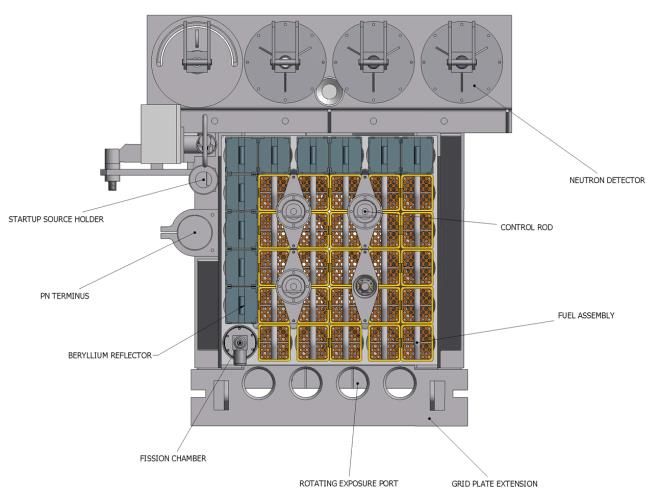
EPJ Web of Conferences 247, 08012 (2021)                                               https://doi.org/10.1051/epjconf/202124708012
PHYSOR2020

                            Fig. 6. A view of the NPD facility and its corresponding schematic.

                                    Table 1. Characteristics of NPD at the PULSTAR Reactor
                   Beam Spectrum                    Thermal
                   Monochromator                    Bent silicon single crystal monochromator
                   Take off angle                   2m = 90°
                   Wavelength                       1.075 Å, 1.171 Å, 1.478 Å, 1.567 Å, 1.762 Å, 2.316 Å
                   Scattering angles                5° ≤ 2Ө ≤ 125°
                   Detector bank:                   15 He-3 detectors
                   Beam size at sample position:    7 cm × 1 cm
                   Minimum resolution (d/d):       3 × 10⁻³

         Another study examined the structure of MnAl, which represents a ferromagnetic material. The τ-phase of
         MnAl has received considerable attention because of its high magnetic moments, high magnetic crystalline
         anisotropy, and high Curie temperature [13]. In this case, neutron diffraction measurements were
         performed on the Mn-Al alloy with atomic ratio 54:46 to study its crystal structure and magnetic ordering.
         The diffraction pattern is shown in Figure 8, the refinement results showed that the crystal structure of
         Mn54Al46 is tetragonal (space group P4/mmm) with lattice parameters a=2.7778 Å, and c=3.5773 Å. The
         1a site is occupied by Mn atom mostly, and the 1d site is occupied by the Al atom mostly. The Mn atoms
         at the same sites have ferromagnetic ordering, but the Mn atoms at different sites are coupled anti-
         ferromagnetically. The magnetic moment of Mn atoms is about 2.03 μB, and its direction is along the c
         axis. The unbalance in occupation of Mn atoms at 1a and 1d sites is the origin of the permanent magnetic
         property of this alloy.

         A timely example is lithium-ion batteries (LIBs), which are widely used in portable electronic products,
         plug-in hybrid vehicles, and even electric vehicles (EVs). However, the low specific capacity of the
         commercial LIB cathodes limits the further use in EVs. Therefore, it is highly desired to find new cathodes
         with high capacity. The Li-rich Mn-based layered oxides are considered as candidates to replace the current
         commercial LIB cathodes due to their large discharge capacity, low cost, and good thermal stability [14].
         However, the disadvantages of voltage decay, large irreversible capacity loss in the first cycle, and the poor
         rate capability hinder their mass application. Extensive studies have been done to overcome these problems
         through surface modifications and metal ion substitution. In this work, Ti doped Li-rich layered oxides
         Li1.2Mn0.6-xNi0.2TixO2 (x=0.0, 0.006) cathode material were studied using neutron diffraction measurement.

                                                               6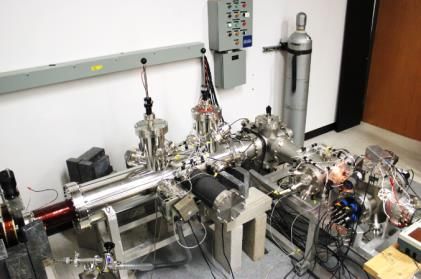
EPJ Web of Conferences 247, 08012 (2021) https://doi.org/10.1051/epjconf/202124708012
PHYSOR2020
The measured diffraction pattern is given below (Fig. 8), and by using Rietveld refinement, shows that the
samples have hexagonal structure with R-3m space group. Ti doping (3b sites) can increase the lattice
parameters. The occupancies of Li and Ni at 3a and 3b sites are mostly unimpacted due to the Ti doping.
In addition, the diffraction patterns are characteristic of almost a single phase structure.
15000 2
Measured data
Rietveld data
10000 Difference
Intensity (Counts)
G(r)
0
5000
0
-2
20 40 60 80 100 0 2 4 6 8 10 12 14 16 18 20 22 24
3000 2(degree) 2 r(A)
Measured data
Rietveld data
Difference
2000
Intensity (Counts)
G(r)
0
1000
0
-2
20 40 60 80 100 0 2 4 6 8 10 12 14 16 18 20 22 24
2(degree) r (A)
Fig. 7. Neutron powder diffraction patterns and PDF of nuclear graphite samples. The top plots
represent unirradiated samples. The bottom plots are for irradiated samples showing the loss of
the planar graphite structure.
Intensity (Counts)
4000 Ti=0.006
Measured data
2000 Rietveld data
Mn54Al46 Measured data
Difference
Rietveld data
Bragg peak position
Difference 2000
Bragg peak position
1500
Intensity (Counts)
0
1000 20 40 60 80 100
Measured data
Intensity (Counts)
Ti=0.0
4000 Rietveld data
Diffrence
500 Bragg peak position
2000
0
0
20 40 60 80 100 120 20 40 60 80 100
2(degree) 2 (degree)
Fig.8. Neutron powder diffraction pattern of Mn54Al46 (left), and of the Ti doped and undoped Li-
rich layered oxides Li1.2Mn0.6-xNi0.2TixO2 (x=0.0, 0.006) cathode material (right).
7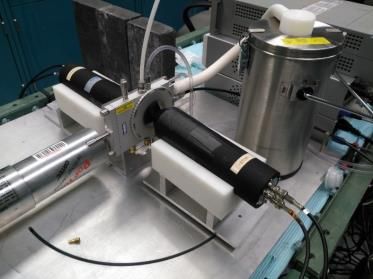
EPJ Web of Conferences 247, 08012 (2021)                                            https://doi.org/10.1051/epjconf/202124708012
PHYSOR2020

                                                  4. CONCLUSIONS

         Two unique facilities for PAS and NPD characterization of the nanostructure of materials have been
         developed and operated at the NCSU PULSTAR reactor. The facilities take advantage of the intimate
         coupling between the PUSTAR core and its surrounding beam tubes to achieve optimum performance. The
         PAS facility includes an intense beam (6 × 10⁸ positrons/second) and bulk spectrometers that are ideal for
         performing both PALS and DBS analyses. The NPD facility is capable of a resolution of 3 × 10⁻³ d/d.
         Both facilities are used for characterizing various materials including graphite, MOFs, steel,
         semiconductors, various types of soft matter, ferromagnetic materials, and lithium-ion battery materials.
         By having such facilities, the PULSTAR continues its mission as a center of pre/post irradiation
         examination of materials.

                                                ACKNOWLEDGMENTS

         The PAS and NPD facilities and their utilization are funded by the US Department of Energy through its
         INIE, NEUP and NSUF programs and by the US National Science Foundation through its MRI and RTNN
         programs.

                                                     REFERENCES

         1. J. MacPhee, J. F. Wett, “PULSTAR-The AMF Pulsing Reactor,” Research Reactor Journal, 4(12), pp.
             12-19 (1963).
         2. A. I. Hawari, “Multidisciplinary Engagement at Research Reactors: The NCSU PULSTAR,”
             Proceedings of IGORR 2017, Sydney, Australia (2017).
         3. Y. C. Jean, P. E. Mallon, D. M. Schrader, Principles and applications of positron and positronium
             chemistry, World Scientific, River Edge, NJ, USA (2003).
         4. D. W. Gidley, H-G Peng, R. S. Vallery, “Positron Annihilation as A Method to Characterize Porous
             Materials”, Annual Review of Materials Research, 36, pp. 49–79 (2006).
         5. A. I. Hawari, et al., “Operation and testing of the PULSTAR reactor intense slow positron beam and
             PALS spectrometers,” Journal of Physics: Conference Series, 262 (2011).
         6. M. Liu, et al., “The Intense Slow Positron Beam Facility at the PULSTAR Reactor and Applications on
             Nano-materials Study,” AIP Conf. Proc., 1525 (2013).
         7. M. Liu, A. I. Hawari, “Positron Characterization of Neutron Irradiated Reactor-Grade Graphite,”
             Transactions of the American Nuclear Society, 110, (2014).
         8. Q. Cai, A. I. Hawari, “Neutron Powder Diffraction Study of Reactor Grade Graphite,” Embedded
             Topical Meeting on Nuclear Fuels and Structural Materials for the Next Generation Nuclear Reactors,
             Chicago, IL, USA (2012).
         9. A. I. Hawari, V. H. Gillette, “Inelastic Thermal Neutron Scattering Cross Sections for Reactor-Grade
             Graphite,” Nuclear Data Sheets, 118, pp. 176-178 (2014).
         10. J. Ø. Torstensen., et al. "Swelling and free-volume characteristics of TEMPO-oxidized cellulose
             nanofibril films." Biomacromolecules, 19(3), pp. 1016-1025 (2018).
         11. S. Nandi, et al. "A single-ligand ultra-microporous MOF for precombustion CO2 capture and hydrogen
             purification," Science advances, 1(11), pp. 1-9 (2015).
         12. D. D. DiJulio, A. I. Hawari, “Characteristics and Performance of the Neutron Powder Diffractometer
             at the NC State University PULSTAR Reactor,” PHYSOR-2008: International Conference on the
             Physics of Reactors, Nuclear Power: A Sustainable Resource, Interlaken, Switzerland (2008).
         13. J. M. D. Coey, New permanent magnets; manganese compounds, Journal of Physics: Condensed
             Matter, 26(064211), pp. 1-6 (2014).
         14. A. Manthiram, et al., “Nickel-Rich and Lithium-Rich Layered Oxide Cathodes: Progress and
             Perspectives,” Advanced Energy Materials, 6(1501010), pp. 1-23 (2016).

                                                             8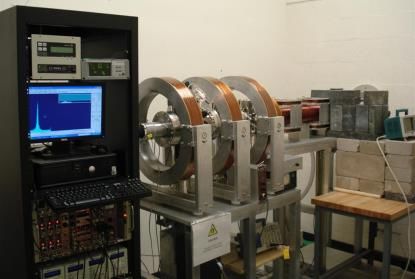
You can also read