FACTORS AFFECTING DIFFERENTIAL - AT ELECTRIC LINES: A CASE STUDY IN THE CANARY ISLANDS - LUIS M. CARRASCAL
←
→
Page content transcription
If your browser does not render page correctly, please read the page content below
Ardeola 68(1), 2021, 71-94                                                            DOI: 10.13157/arla.68.1.2021.ra5

                         FACTORS AFFECTING DIFFERENTIAl
                    UNDERESTIMATES OF BIRD COllISION FATAlITIES
                          AT ElECTRIC lINES: A CASE STUDy
                               IN THE CANARy ISlANDS

                              FACTORES qUE AFECTAN A lA SUBESTIMACIóN
                                DIFERENCIAl DE lAS COlISIONES DE AvES
                              CON líNEAS EléCTRICAS: UN CASO DE ESTUDIO
                                        EN lAS ISlAS CANARIAS

                     Julia GóMEz-CATASúS 1, 2, 3 *, luis M. CARRASCAl 4 *, virginia MORAlEDA 1,
                             José COlSA 1, Fernando GARCéS 1 and Claudia SCHUSTER 1

                SUMMARy.—Carcass counts notably underestimate avian collision rates due to three main bias
            sources: imperfect detection, carcass removal by scavengers and carcass dispersion in unsearched areas.
            We assessed these sources of bias at electric lines of two Canary Islands, lanzarote and Fuerteventura,
            quantifying the factors influencing them. We also carried out a cost-effectiveness assessment of carcass
            search done perpendicularly to electric line axis. We surveyed 230km of three types of electric lines
            (high-voltage, medium voltage and telephone lines) during three periods (July 2015, November-
            December 2015 and March 2016) searching for collision fatalities (N = 431), recording the species, the
            carcass distance from the electric line, mean cable height, carcass detection distance and decomposition
            state. In addition, we carried out a disappearance rate experiment to estimate carcass removal by
            scavengers. A generalised least squares model was used to analyse dispersion distance of carcass from
            electric lines, in relation to species body mass, mean cable height and line typology. Detection proba-
            bility functions were fitted to estimate carcass detectability, incorporating body mass, decomposition
            state and habitat structure as covariates. A Generalised Mixed-Effects model was carried out to analyse
            carcass disappearance in relation to time elapsed since carcass placement, carcass size, season and
            island. Dispersion distance decreased with body mass and increased with cable height, being further

            1
                  Grupo de Rehabilitación de la Fauna Autóctona y su Hábitat, GREFA, Majadahonda, Madrid,
                  Spain.
            2
                  Terrestrial Ecology Group, Department of Ecology, Universidad Autónoma de Madrid
                  (TEG-UAM), 28049 Madrid, Spain.
            3
                  Centro de Investigación en Biodiversidad y Cambio Global, Universidad Autónoma de Madrid
                  (CIBC-UAM), 28049 Madrid, Spain.
            4
                  Departamento de Ecología Evolutiva, Museo Nacional de Ciencias Naturales (MNCN-CSIC),
                  28006 Madrid, Spain.

            *     Corresponding author: julia.gomez@uam.es
            *     These authors contributed equally to this work.

Downloaded From: https://bioone.org/journals/Ardeola on 16 Sep 2020
Terms of Use: https://bioone.org/terms-of-use Access provided by Universidad Autonoma de Madrid
72           GóMEz-CATASúS, J., CARRASCAl, l.M., MORAlEDA, v., COlSA, J., GARCéS, F. and SCHUSTER, C.

         at high-voltage lines. Overall, detection probability was 0.134, increasing with carcass size, decreasing
         with decomposition state and being lower in rocky areas which offered a significant challenge when
         walking through rough terrain. Disappearance rates differed between islands probably due to differences
         in avian scavenger abundance, increased with time elapsed and decreased with bird size. This study
         provides correction factors to obtain unbiased estimates of avian mortality rates within sparsely vege-
         tated landscapes. Moreover, it identifies a 27m threshold distance at which the cost-effectiveness of
         searching for carcasses is optimised. —Gómez-Catasús, J., Carrascal, l.M., Moraleda, v., Colsa, J.,
         Garcés, F. & Schuster, C. (2021). Factors affecting differential underestimates of bird collision fatalities
         at electric lines: a case study in the Canary Islands. Ardeola, 68: 71-94.
            Key words: avian carcasses, Canary Islands, collisions at electric lines, cost-effectiveness assessment,
         decomposition rates, detectability, disappearance rates.

             RESUMEN.—El conteo de cadáveres infravalora la tasa de colisión de aves debido a tres fuentes de
         sesgo: detección imperfecta, retirada de cadáveres por carroñeros y dispersión de cadáveres fuera de la
         zona de muestreo. En este trabajo se evalúan estas fuentes de sesgo en tendidos eléctricos de dos islas
         Canarias, lanzarote y Fuerteventura, y se cuantifican los factores que les afectan. Además, se lleva a
         cabo un análisis de costo-efectividad en la búsqueda de cadáveres perpendicularmente al eje de los ten-
         didos. Se muestrearon 230 km de tres tipos de tendidos eléctricos (alta tensión, media tensión y tendidos
         telefónicos) en tres temporadas (julio 2015, noviembre-diciembre 2015 y marzo 2016) y para cada co-
         lisión (N = 431) se identificó la especie y se registró la distancia del cadáver al tendido, altura media de
         los cables, distancia de detección del cadáver y el estado de degradación. Además, se llevó a cabo un
         experimento para estimar la tasa de desaparición por carroñeros. Se ajustó un modelo generalizado de
         mínimos cuadrados para analizar la distancia de dispersión de los cadáveres frente a la masa corporal,
         altura media de los cables y tipología de línea. En segundo lugar, se aplicaron funciones de detección
         para estimar la detectabilidad de los cadáveres incorporando la masa corporal, el grado de descomposi-
         ción y la estructura del hábitat como covariables. Por último, se ajustó un modelo mixto generalizado
         para analizar la tasa de desaparición de cadáveres con relación al tiempo transcurrido desde la coloca-
         ción del cadáver, su tamaño, la temporada y la isla. la distancia de dispersión disminuyó con la masa
         corporal e incrementó con la altura de los cables, siendo mayor en las líneas de alta tensión. la proba-
         bilidad de detección fue de 0,134, incrementándose con la masa corporal y disminuyendo con el estado
         de descomposición-degradación, y fue menor en zonas rocosas que imponen dificultades para caminar.
         la tasa de desaparición de cadáveres difirió entre islas debido probablemente a la abundancia de carro-
         ñeros, se incrementó con el tiempo y disminuyó con el tamaño corporal. Este trabajo proporciona factores
         de corrección para obtener estimas fiables de la tasa de mortalidad de aves en paisajes con escasa vege-
         tación. Además, identifica una distancia umbral de 27 metros donde se alcanzan los valores máximos
         de coste-efectividad en la búsqueda de cadáveres.—Gómez-Catasús, J., Carrascal, l.M., Moraleda, v.,
         Colsa, J., Garcés, F. y Schuster, C. (2021). Factores que afectan a la subestimación diferencial de las
         colisiones de aves con líneas eléctricas: un caso de estudio en las islas Canarias. Ardeola, 68: 71-94.
             Palabras clave: cadáveres de aves, colisiones en líneas eléctricas, detectabilidad, índices de desapa-
         rición, índices de descomposición, islas Canarias, valoración de coste-efectividad.

         INTRODUCTION                                                  Crivelli et al., 1988; Bevanger, 1995; Hunt &
                                                                       Hunt, 2006; but see Arnold & zink, 2011).
           Collision with man-made structures has                      Specifically, the increase in electricity de-
         been reported to be an important cause of                     mand over the last several decades has led
         avian mortality, which may have dramatic                      to the expansion of electrical transmission
         consequences at the population level (e.g.                    grids, an important cause of avian mortality

         Ardeola 68(1), 2021, 71-94

Downloaded From: https://bioone.org/journals/Ardeola on 16 Sep 2020
Terms of Use: https://bioone.org/terms-of-use Access provided by Universidad Autonoma de Madrid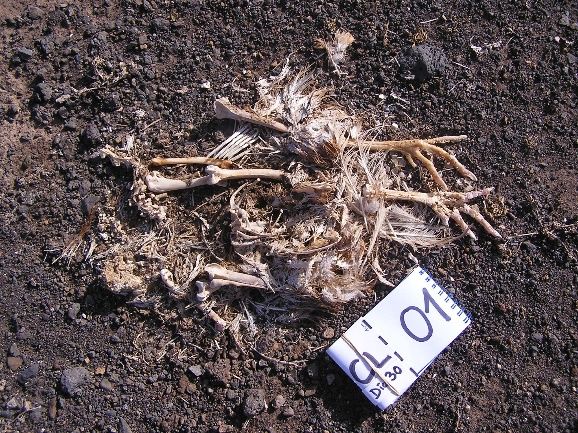
BIAS ESTIMATES OF BIRD COllISIONS AT ElECTRIC lINES                                73

            through collision with electric lines (Drewitt                 (Kostecke et al., 2001). Information on car-
            & langston, 2008; Ferrer, 2012; Bernardino                     cass dispersion patterns from the axis of elec-
            et al., 2018).                                                 tric lines is scarce, a matter that affects the
                Estimates of avian collision rates with elec-              definition of the searchable area and extrapo-
            tric lines and other human infrastructures are                 lations to unsearched areas around the in-
            commonly based on carcass counts (Stevens                      frastructures (Huso & Dalthorp, 2014), es-
            et al., 2011). However, accurate quantifica-                   pecially considering the relationship of body
            tion remains complex due to the existence                      mass to parabolic free-fall trajectories and
            of three major biases: i) imperfect detection                  the broad variation in the configuration and
            (Ponce et al., 2010; Stevens et al., 2011);                    dimensions of electric lines (e.g. number of
            ii) carcass disappearance due to decompo-                      cables, tower heights). The particular charac-
            sition or removal by scavengers (Schutgens                     teristics of electric line infrastructures are
            et al., 2014; Costantini et al., 2017); and                    highly dependent on line voltage (Miller,
            iii) fall of carcasses outside the search zone                 1978), which may be expected to produce
            (Huso & Dialthorp, 2014; Murphy et al.,                        differences in carcass dispersion distance
            2016). These main bias sources affect the                      relative to the line axes.
            number of carcasses found by observers,                           Here we addressed the influence of imper-
            which may notably underestimate bird fatality                  fect detection, scavenger removal, carcass
            rates (Ponce et al., 2010; Barrientos et al.,                  decomposition and carcass dispersion around
            2018). Therefore, correction factors should                    overhead utility lines on the estimates of
            be applied to account for carcass count short-                 collision fatalities in sparsely vegetated semi-
            falls due to sources of error during surveys                   arid landscapes, considering three different
            and to provide unbiased estimates of bird                      types of utility lines (hereafter electric lines):
            mortality rates (Bevanger, 1999; Korner-                       high-voltage, medium voltage and telephone
            Nievergelt et al., 2011), for a proper estima-                 lines. Specifically, we quantified the bias
            tion of human impact on bird biodiversity.                     sources and their underlying potential factors
                Understanding and quantifying the factors                  in order to obtain accurate correction factors.
            that influence bias sources is pivotal to ob-                  The aims were to: i) evaluate carcass disper-
            taining accurate correction factors that may                   sion patterns with respect to the axis of elec-
            be site-, season- and/or species-dependent.                    tric lines, examining the influence of species
            Potential factors affecting detectability bias                 body mass, cable height and line typology
            are carcass size (Ponce et al., 2010; Borner                   on dispersal distances; ii) estimate carcass
            et al., 2017), habitat type (Stevens et al.,                   detectability, assessing the effect of bird size,
            2011; Schutgens et al., 2014; Borner et al.,                   decomposition state (i.e. carcass age) and
            2017), carcass age (i.e. decomposition state;                  habitat structure on the likelihood of carcass
            Schutgens et al., 2014) and differences in                     detection; and iii) measure carcass persis-
            observer perceptual abilities (Ponce et al.,                   tence in the field by carcass removal experi-
            2010; Borner et al., 2017). Moreover, scav-                    ments, testing for the effects of time elapsed
            enger removal rate has been described to                       since carcass placement, carcass size, geo-
            depend on carcass size (Ponce et al., 2010;                    graphical position and season on carcass
            Schutgens et al., 2014), season (Costantini                    disappearance rates. Based on these results,
            et al., 2017) and location (Ponce et al.,                      we carried out an assessment of the cost-
            2010; Stevens et al., 2011; Costantini et al.,                 effectiveness of carcass search perpendicular
            2017; Borner et al., 2017), the last of these                  to electric line axes in order to identify a
            probably due to site-specific factors such as                  threshold distance up to which survey efforts
            geographical position relative to the distri-                  should be invested, enhancing the effective-
            bution and abundance patterns of scavengers                    ness of surveys.

                                                                                                       Ardeola 68(1), 2021, 71-94

Downloaded From: https://bioone.org/journals/Ardeola on 16 Sep 2020
Terms of Use: https://bioone.org/terms-of-use Access provided by Universidad Autonoma de Madrid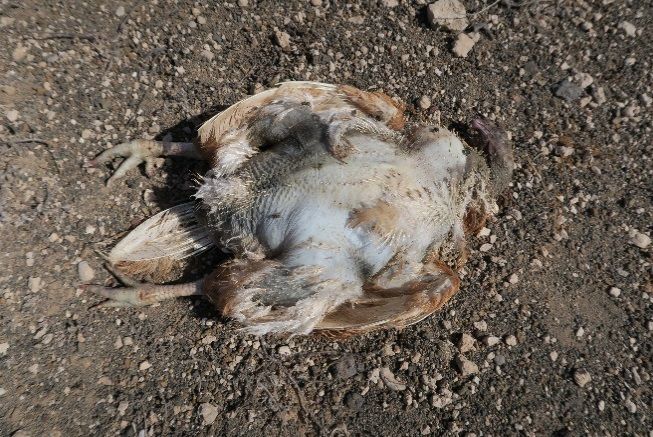
74           GóMEz-CATASúS, J., CARRASCAl, l.M., MORAlEDA, v., COlSA, J., GARCéS, F. and SCHUSTER, C.

            There is no information available on car-                  Fuerteventura). The surveyed areas com-
         cass dispersion patterns with respect to the                  prised a wide range of habitats, from lava
         axes of electric lines. However, we expected                  fields to dunes. For more details on island
         that dispersal distances would be greater with                characteristics see Fernández-Palacios &
         small-sized carcasses and on electric lines                   Martín-Esquivel (2001).
         with higher wires (i.e. high and medium-                         Three types of electric lines are present
         voltage lines) due to the influence of these                  in both islands: i) high-voltage power lines
         factors on parabolic free-fall trajectories. On               (66 kv); ii) medium-voltage power lines (15-
         the other hand, in accordance with previous                   30 kv); and iii) telephone lines (< 1 kv).
         studies, we expected that carcass detectability               The voltage differences require differences
         would increase with carcass size (Borner et                   in line typology. The number of cables or
         al., 2017) and decrease with carcass age                      wires differs between power lines and tele-
         (i.e. decomposition state; Schutgens et al.,                  phone lines (ANOvA F-test, p < 0.0001).
         2014), whereas detection probability would                    High- and medium-voltage lines do not dif-
         be greater in open habitats than in more vege-                fer in cable number (p = 0.414): of the sur-
         tated ones (Arnett et al., 2008; Smallwood,                   veyed infrastructures 99.45% of high-voltage
         2013). Moreover, carcass disappearance due                    lines have three cables and 0.55% have six
         to removal by scavengers was expected to                      cables, whereas 95.53% of medium-voltage
         be negatively related to carcass size, and to                 lines have three cables and 4.47% have six
         differ between seasons and sites due to dif-                  cables. Telephone lines have significantly
         ferences in such specific factors as scavenger                fewer cables than power lines (p < 0.0001):
         density and activity (Flint et al., 2010;                     59.20% have one cable, 22.98% have two
         Henrich et al., 2017). lastly, carcass dis-                   and 17.82% have three. The height of the
         appearance rates were predicted to increase                   lowest cable also differs between line types
         as time since placement increased (Ponce et                   (ANOvA F-test, p < 0.0001), being higher
         al., 2010; Barrientos et al., 2018).                          in high-voltage lines (mean ± SD = 14.04 ±
                                                                       7.21m, 95% confidence interval –CI95%– =
                                                                       13.26-14.82m, N = 323), than in medium
         METHODS                                                       voltage lines (9.95 ± 3.19m, CI95% = 9.15-
                                                                       10.75m, N = 61) and telephone lines (5.11 ±
         Study area                                                    0.7m, CI95% = 4.87-5.34m, N = 37). Simi-
                                                                       larly the distance between the lowest and the
            The study areas were on two eastern is-                    highest cables differs between the three line
         lands of the Canarian archipelago (Figure 1):                 types (ANOvA F-test, p < 0.0001) being
         lanzarote (846km2, 670m a.s.l.; 29º2’6’’N,                    greater in high-voltage lines (7.15 ± 2.87m,
         13º37’58.8’’W) and Fuerteventura (1,660km2,                   CI95% = 6.78-7.52m), than in medium-
         807m a.s.l.; 28º25’27’’N, 14º0’11’’W). The                    voltage lines (2.09 ± 1.94m, CI95% = 1.53-
         climate is semi-arid with mean tempera-                       2.66m) and telephone lines (0.22 ± 0.52m,
         tures ranging from 14°C to 29°C and annual                    CI95% = 0-0.44m).
         precipitation below 200mm. The landscape
         is predominantly flat and semi-desertic
         dominated by xerophytic shrubs: Launaea                       Survey methodology
         arborescens, Lycium intricatum, Salsola
         vermiculata, Suaeda spp. and Euphorbia                           Electric lines were surveyed in three sea-
         spp. Cultivated fields are interspersed by                    sons of an annual cycle: July 2015, Novem-
         areas extensively grazed by goats (mainly in                  ber-December 2015 and March 2016. In each

         Ardeola 68(1), 2021, 71-94

Downloaded From: https://bioone.org/journals/Ardeola on 16 Sep 2020
Terms of Use: https://bioone.org/terms-of-use Access provided by Universidad Autonoma de Madrid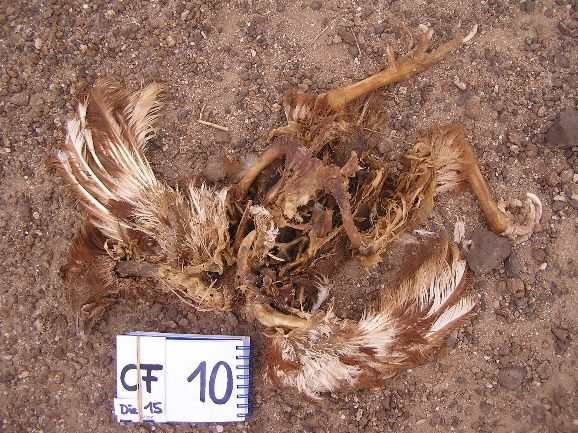
BIAS ESTIMATES OF BIRD COllISIONS AT ElECTRIC lINES                                  75

                                                                       0       25 50 75 100 km

                                             0 2.5 5 7.5 10 km

                                                                  0        5      10    15       20 km

            FIG. 1.—Eastern islands of the Canary archipelago: lanzarote (top-left) and Fuerteventura (bottom-
            right) showing the high-voltage (black lines), medium-voltage (dark grey lines) and telephone (light
            grey lines) lines surveyed. Circles indicate the locations of the disappearance rate experiments.
            [Islas orientales del archipiélago canario: Lanzarote (arriba a la izquierda) y Fuerteventura (abajo a
            la derecha). Se representan las líneas de alta tensión (líneas negras), media tensión (líneas en gris
            oscuro) y telefónicas (líneas en gris claro) muestreadas. Los círculos indican las localizaciones de los
            experimentos de la tasa de desaparición de cadáveres.]

                                                                                                         Ardeola 68(1), 2021, 71-94

Downloaded From: https://bioone.org/journals/Ardeola on 16 Sep 2020
Terms of Use: https://bioone.org/terms-of-use Access provided by Universidad Autonoma de Madrid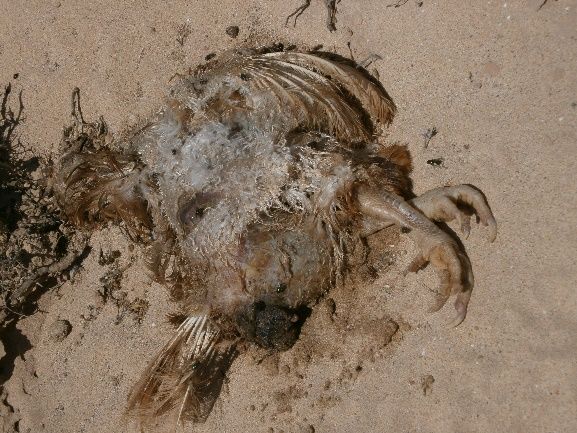
76           GóMEz-CATASúS, J., CARRASCAl, l.M., MORAlEDA, v., COlSA, J., GARCéS, F. and SCHUSTER, C.

         sampling season, we surveyed 32.17km and                         For each collision fatality event we re-
         96.56km of high-voltage lines in lanzarote                    corded the following information: i) GPS
         and Fuerteventura, respectively (Figure 1).                   coordinates; ii) date; iii) island; iv) spe-
         We also surveyed 20.39km and 40.40km                          cies; v) distance from the electric line axis;
         of medium-voltage lines, and 18.16km and                      vi) minimum and maximum cable height;
         22.40km of telephone lines, in lanzarote                      vii) distance from the observer at which the
         and Fuerteventura respectively (Figure 1).                    carcass was first detected; and viii) decom-
            Electric lines were walked under similar                   position state. Distance and height variables
         favourable weather conditions that facilitate                 were visually estimated in the field after
         carcass detectability (i.e. absence of precipi-               training. Five decomposition states were
         tations and fog), at a slow speed (3.39 ±                     established a priori. State 1, or fresh, was
         0.43km/h) following a zig-zag pattern. The                    characterised by the presence of soft tissues,
         average length of the electric line stretches                 ranging from recent death (less than 3-5
         surveyed per person and day was 3.1km                         hours) to initial body inflammation due to
         (from 0.4km up to 7.8km; N = 74). Surveys                     bacterial action. State 2, or emphysematous,
         were carried out by a total of nine different                 from showing very apparent inflammation to
         observers experienced in field and census                     skin rupture due to internal gas pressure and
         work (six per study period). Two observers                    superficial tissue decomposition. State 3, or
         surveyed in parallel on each side of the high-                colicuative, encompassed advanced decom-
         voltage lines, whereas one observer sur-                      position and disappearance of soft tissues.
         veyed medium-voltage and telephone lines                      During state 4, or post-colicuative, only dried
         keeping the electric line at the centre of the                tissues, cartilages and bones were present.
         zig-zag transect (see Supplementary Mate-                     lastly, state 5, or skeletal reduction, referred
         rial, Appendix 1). The average distance                       to the mere occurrence of bone remains (see
         between the line and the furthest point from                  photographs of decomposition states in Sup-
         the line walked by the observer was 40.6m,                    plementary Material, Appendix 1). Carcasses
         i.e. the average width of the zig-zag pattern                 found in state 5 (i.e. skeletal reduction) were
         was 40.6m, giving a total length walked by                    identified ex situ at the National Museum of
         the observer of 101.4m. The resulting zig-                    Natural Sciences, using the natural history
         zagging index was 1.67 ± 0.22 (see Supple-                    bone collections and digital pictures taken in
         mentary Material, Appendix 1). High-voltage                   the field alongside objects of known dimen-
         lines were surveyed up to 50m from the axis,                  sions. Duplication of fatality records between
         whereas medium-voltage and telephone lines                    sampling seasons was avoided by means of
         were surveyed up to 25m from the axis.                        GPS location (average sampling for 1min to
                                                                       attain a precision of ± 2m) and digital pic-
                                                                       tures of the remains and the surroundings.
         Fatality records                                                 Body masses were obtained from Perrins
                                                                       (1998; see Supplementary Material, Appen-
            A fatality record was defined as any re-                   dix 2, Table C1). Bird remains were classi-
         mains of carcass consisting of at least a sin-                fied according to initial body mass and their
         gle bone or a set of five feathers, since fewer               spread on the ground into three size cate-
         feathers may be due to causes other than                      gories that could easily accommodate well-
         mortality (e.g. moult, roost sites, fighting;                 known bird species: i) Small, for passerine-
         Bevanger, 1999). Carcasses with clear evi-                    sized remains (< 20cm); ii) Medium, from
         dence of other mortality causes (e.g. electro-                Eurasian Collared-dove Streptopelia de-
         cution, predation by falcons) were excluded.                  caocto to Bulwer’s Petrel Bulweria bulwerii

         Ardeola 68(1), 2021, 71-94

Downloaded From: https://bioone.org/journals/Ardeola on 16 Sep 2020
Terms of Use: https://bioone.org/terms-of-use Access provided by Universidad Autonoma de Madrid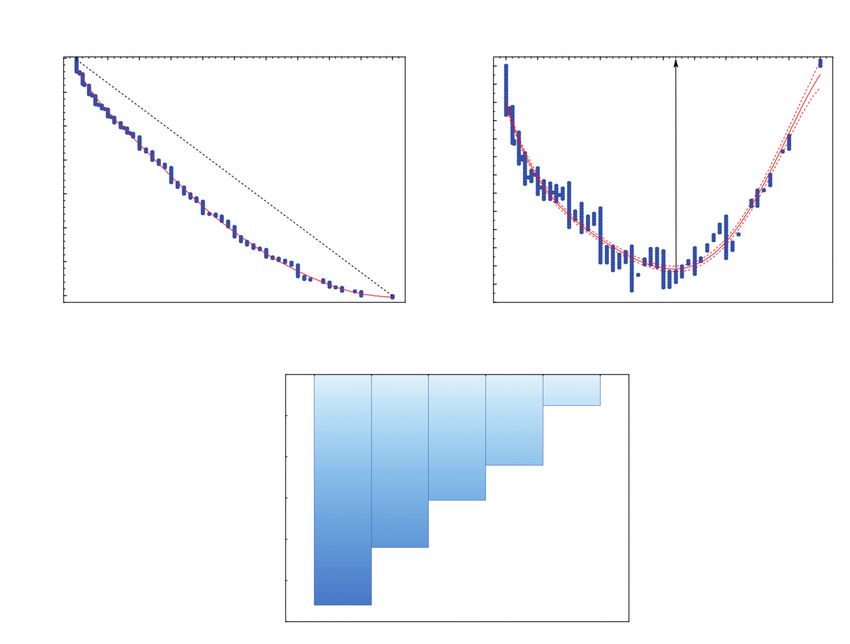
BIAS ESTIMATES OF BIRD COllISIONS AT ElECTRIC lINES                              77

            (20-35cm); iii) large, from Eurasian Stone-                    the whole range of body sizes of the species
            curlew Burhinus oedicnemus to Cattle Egret                     found dead around electric lines on the two
            Bubulcus ibis (35-55cm); and iv) very large,                   study islands. All carcasses were of recently
            for species or remains larger than Cattle                      dead animals. Carcasses were monitored on
            Egret (> 55cm).                                                five occasions: 1, 3, 7, 15 and 30 days after
                Habitat characteristics were measured                      placement in the field. visits were more fre-
            within a 25m radius around each carcass in                     quent at the beginning of the experiment due
            order to control for the influence of habitat                  to expected higher disappearance rates soon
            structure and vegetation cover on carcass de-                  after placement (e.g. Prosser et al., 2008;
            tection. The following variables were visually                 Ponce et al., 2010). Presence or absence of
            estimated in the field after previous training:                carcasses and the five decomposition states
            i) five scores of soil typology (0 large rocks                 established beforehand were recorded on
            or lava fields, 1 stone/gravel soils, 2 compact                each visit. All remains were removed on the
            soils, 3 sandy soils, 4 loose sandy soils and                  last monitored day.
            dunes; mean ± SD: 2.2 ± 0.83, N = 431);                           Carcasses (kindly supplied by Oasis Park
            ii) rock cover (mean ± SD = 24.8 ± 31.4%);                     zoo, Fuerteventura) were provided frozen
            iii) cover of the herbaceous layer, including                  in order to avoid possible sources of error
            therophytes (mean ± SD = 13.5 ± 21.7%);                        associated with carcass odour that could in-
            iv) shrub cover (mean ± SD = 5.2 ± 8.5%);                      fluence removal by scavengers. They were
            and v) mean shrub height (mean ± SD =                          defrosted at ambient temperature the day
            25.2 ± 20.3cm).                                                before placement. locations were selected
                                                                           near electric lines, spanning the habitat
                                                                           heterogeneity in their surroundings (Figure
            Disappearance rate experiment                                  1), since differences in vegetation structure
                                                                           and other environmental factors are ex-
               We carried out an experiment with the                       pected to influence scavenger density and,
            aim of estimating the probability of carcass                   therefore, disappearance rates (Bevanger,
            disappearance due to removal by scavengers                     1995). In order to avoid collision fatalities
            or decomposition. A total of 90 and 72 car-                    of attracted avian scavengers (e.g. Common
            casses were placed in July 2015 and March                      Raven Corvus corax canariensis, Common
            2016, respectively. In July 2015, 45 car-                      Buzzard Buteo buteo insularum, Egyptian
            casses were located at five sites in lanzarote                 vulture Neophron percnopterus majorensis)
            (nine carcasses per site) and at seven sites in                carcasses were placed near the studied elec-
            Fuerteventura (six carcasses per site, with                    tric lines but no closer than 100m. We geo-
            the exception of one site where nine were                      referenced the location of each carcass with
            placed). In March 2016, a total of 30 and                      a portable GPS for subsequent revisions
            42 carcasses were placed in lanzarote and                      (with the average function during 1min for
            Fuerteventura, respectively (six carcasses per                 an enhanced spatial precision).
            site; Figure 1). We placed two or three bird
            carcasses of each body-size class at each site,
            separated by at least 20m. The carcasses were                  Statistical analyses
            chicks of Domestic Chicken Gallus gallus
            domesticus (small), Rock Pigeon Columba                        Carcass dispersion around electric lines
            livia or Common quail Coturnix coturnix
            (medium) and Domestic Chicken (large). We                         The logarithmic distance of the fatalities
            used these three groups in order to cover                      from the electric line axis was analysed in

                                                                                                     Ardeola 68(1), 2021, 71-94

Downloaded From: https://bioone.org/journals/Ardeola on 16 Sep 2020
Terms of Use: https://bioone.org/terms-of-use Access provided by Universidad Autonoma de Madrid
78           GóMEz-CATASúS, J., CARRASCAl, l.M., MORAlEDA, v., COlSA, J., GARCéS, F. and SCHUSTER, C.

         relation to species body mass, the average                    power lines, and their detectability patterns
         height of the wires at the location where the                 when searched for, it is possible to ascertain
         carcasses were found and the line typology                    the theoretical proportions of carcasses de-
         (high-voltage, medium-voltage and telephone                   tected from those available in the field for
         lines). A generalised least squares (GlS)                     one, two or three observers walking parallel
         model was fitted with the ‘nlme’ R package                    to the axis of the power line. This simulation
         (Pinheiro et al., 2019), taking into account                  approach was carried out considering (i) one
         heteroskedasticity-corrected standard errors                  observer walking alone below the line axis,
         and spatial auto-correlation of the location of               (ii) two observers walking at 13m to either
         carcasses. Spatial auto-correlation controls                  side of the line axis, and (iii) as (ii) but with
         for type I error while establishing the right                 a third observer walking along the axis itself.
         sample size for significance estimation; i.e.                 The R script for carrying out the simulations
         the distance from the electric line is expected               for remains of large and very large species
         to be correlated in nearby carcasses due to                   is presented in the Supplementary Material,
         similarities in factors such as topography and                Appendix 3. In a first step we simulated the
         habitat characteristics around them, pre-                     half-normal distribution of carcasses accord-
         vailing wind exposure, hotspots of high mor-                  ing to the pattern shown in Figure 2, within
         tality, etc. In this analysis, we employed all                1m distance intervals from the line axis up
         carcasses (N = 322) found up to 25m from                      to 50m. In a second step we simulated the
         the axis of the three electric line types (i.e.               probability of detection of large/very large
         high-voltage, medium-voltage and telephone                    remains according to the information in
         lines), in order to account for the fact that                 panels C and D of Figure 3. Combining
         the areas surveyed below telephone and                        those two distributions, it is possible to esti-
         medium-voltage lines were narrower.                           mate the proportion of carcasses detected
            We also carried out a cost-effectiveness                   from a previously established distance, con-
         assessment of carcass search from the axis                    sidering those available according to their
         of high-voltage lines. We focused on high-                    distances from the power line axis (i.e. pro-
         voltage lines due to the larger sample of car-                portion of carcasses detected in each 1m dis-
         casses recorded there and the broader area                    tance interval = number of carcasses within
         sampled (up to 50m). The sampling effort                      that distance interval × probability of detec-
         invested at a particular distance from the                    tion considering the distance of the observer
         axis was equated to the proportion of area                    from that point). Finally we estimated the
         covered up to the distance at which the high-                 proportion of carcasses detected from those
         voltage lines were surveyed (see “Surveying                   available within each 1m distance interval for
         methodology” above). For instance, the pro-                   each observer in each of the three sampling
         portion of the area covered up to 30m was                     scenarios. This procedure was also applied
         0.6 = 30/50. Thus, sampling proportion in-                    to small bird remains/species, according to
         creased linearly with the distance from the                   data in panel A of Figure 3.
         axis of the high-voltage lines. The cost-
         effectiveness of carcass search along the
         distance gradient to the axis was calculated                  Carcass detectability
         as the difference between the cumulative
         proportion of carcasses and the proportion                       We used distance sampling methodology
         of area covered up to a particular distance.                  (Buckland, 2007), fitting detection functions
            Considering the dispersion pattern of car-                 to estimate carcass detectability using the
         casses around the axis of the high-voltage                    ‘Distance’ R package (Miller, 2017). All de-

         Ardeola 68(1), 2021, 71-94

Downloaded From: https://bioone.org/journals/Ardeola on 16 Sep 2020
Terms of Use: https://bioone.org/terms-of-use Access provided by Universidad Autonoma de Madrid
BIAS ESTIMATES OF BIRD COllISIONS AT ElECTRIC lINES                                                                                           79

                                                                                                                                                                                    A
                                                                                                   120

                                                                                                   100

                                                                                  # of carcasses
                                                                                                    80

                                                                                                    60

                                                                                                    40

                                                                                                    20

                                                                                                        0
                                                                                                                          10        20                         30       40          50
                                                                                                                      distance to the centre of the line (m)

                                                      B                                                                                                                                                                  C
                                                350                                                                                                          0.26
                                                                                                                                                             0.24
               cumulative number of carcasses

                                                300                                                                                                          0.22
                                                                                                                                                             0.20
                                                                                                                                         cost efectiveness
                                                250                                                                                                          0.18
                                                                                                                                                             0.16
                                                200                                                                                                          0.14
                                                                                                                                                             0.12
                                                150                                                                                                          0.10
                                                                                                                                                             0.08
                                                100                                                                                                          0.06
                                                                                                                                                             0.04
                                                 50                                                                                                          0.02
                                                                                                                                                             0.00
                                                  0
                                                      0   5     10   15    20    25                30       35   40     45     50                                   0   5     10   15    20   25     30   35   40   45   50
                                                              distance to the centre of the line (m)                                                                        distance to the centre of the line (m)

            FIG. 2.—Distribution of (A) the dispersion distances of carcasses and (B) the cumulative number of
            carcasses up to 50m from line axis, and (C) the cost-effectiveness of sampling while using a zig-zag
            walking pattern (see Supplementary Material, Appendix 1). Only data for high-voltage lines is presented
            (N = 353 different carcasses found along 128.7km of electric lines searched on three occasions –July,
            November, March–). The fitted curve in panel (B) has been obtained by means of a cubic polynomial
            smoothing, while the dashed straight line indicates the cumulative proportion of carcasses on an expec-
            tation of an “equal benefit” search survey. The cost-effectiveness pattern in panel (C) was estimated as
            the difference between the continuous curve and the dashed line in panel (B), expressed as a proportion
            of carcasses found; the fitted curve was estimated by means of quintic polynomial smoothing (with its
            95% confidence interval; dashed lines). The vertical arrow in panel (C) shows the distance from the
            electric line axis at which the cost-effectiveness search for carcasses is maximised.
            [Distribución de (A) las distancias de dispersión de los cadáveres, (B) el número acumulado de cadá-
            veres hasta los 50m de distancia al eje del tendido, y (C) la relación esfuerzo/eficacia de muestreo con
            un patrón de muestreo en zig-zag (véase en el Material Suplementario, Apéndice 1). Sólo se represen-
            tan los datos para las líneas de alta tensión (N = 353 cadáveres diferentes encontrados en 128,7 km
            de líneas eléctricas muestreadas en tres ocasiones –Julio, Noviembre, Marzo–). La curva ajustada en
            el panel (B) se ha obtenido mediante un suavizado polinómico cúbico, mientras que la línea recta y
            discontinua indica la proporción acumulada de cadáveres sobre una expectativa de una “igualdad de
            beneficio” por esfuerzo de prospección. El patrón de esfuerzo/eficacia en el panel (C) fue estimado
            como la diferencia entre la curva continua y la línea discontinua en el panel (B), expresado como la
            proporción de cadáveres encontrados; la curva ajustada se ha estimado mediante un suavizado poli-
            nómico de orden cinco (con el intervalo de confianza al 95%; líneas discontinuas). La línea vertical
            en el panel (C) muestra la distancia desde el eje de la línea eléctrica a la que se maximiza la relación
            eficacia/esfuerzo en la búsqueda de cadáveres.]

                                                                                                                                                                                                   Ardeola 68(1), 2021, 71-94

Downloaded From: https://bioone.org/journals/Ardeola on 16 Sep 2020
Terms of Use: https://bioone.org/terms-of-use Access provided by Universidad Autonoma de Madrid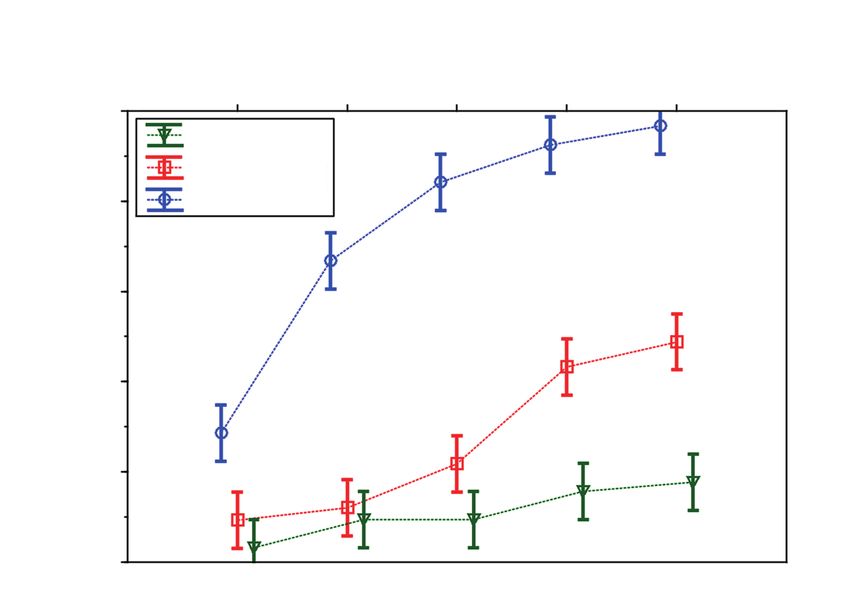
80                                GóMEz-CATASúS, J., CARRASCAl, l.M., MORAlEDA, v., COlSA, J., GARCéS, F. and SCHUSTER, C.

                                                       Small remains A                                                        Medium remains B
                                 1.0                                                                            1.0

                                 0.8                                                                            0.8
         Detection probability

                                                                                        Detection probability
                                 0.6                                                                            0.6

                                 0.4                                                                            0.4

                                 0.2                                                                            0.2

                                 0.0                                                                            0.0
                                       0       5     10     15    20     25    30                                     0   5   10   15    20   25   30

                                                      Distance (m)                                                             Distance (m)

                                                       Large remains C                                                    Very large remains D
                                                                                                                1.0
                                 1.0

                                                                                                                0.8
         Detection probability

                                                                                      Detection probability

                                 0.8

                                 0.6                                                                            0.6

                                 0.4                                                                            0.4

                                 0.2                                                                            0.2

                                 0.0                                                                            0.0
                                       0       5     10     15    20     25    30                                     0   5   10   15    20   25   30
                                                      Distance (m)                                                             Distance (m)

         FIG. 3.—Distances from the observer to the carcasses considering four size categories in accordance
         with species body mass and the size of the remains. Curved lines depict the probability of detection
         models using hazard-rate distributions with cosine adjustments. The four size classes are (A) small
         (N = 32), (B) medium (N = 185), (C) large (N = 127), and (D) very large (N = 87). See methods for
         description of these size categories.
         [Distancias de detección de los cadáveres medidas desde el observador, considerando cuatro catego-
         rías de tamaño que consideran globalmente la masa corporal de las especies y el tamaño de los restos
         encontrados. Las curvas representan los modelos de probabilidad de detección “hazard-rate” (tasa de
         riesgo) con ajuste coseno. Las cuatro categorías de tamaño son (A) pequeño (N = 32), (B) mediano
         (N = 185), (C) grande (N = 127), y (D) muy grande (N = 87). Véanse los métodos para una descrip-
         ción de estas categorías de tamaño.]

         Ardeola 68(1), 2021, 71-94

Downloaded From: https://bioone.org/journals/Ardeola on 16 Sep 2020
Terms of Use: https://bioone.org/terms-of-use Access provided by Universidad Autonoma de Madrid
BIAS ESTIMATES OF BIRD COllISIONS AT ElECTRIC lINES 81
tection distances were considered in an ini- calculated for each body-size class of bird
tial analysis to estimate the overall detection remains (i.e. multiplying the maximum dis-
probability, because a detectability model tance threshold by the probability of detec-
incorporating the uncertainty linked to the tion up to that distance).
observer’s skills and perceptive abilities did We carried out a Principal Component
not improve the model (i.e. the model in- Analysis (PCA) with the variables describing
cluding the observer as a nominal factor had the habitat structure at the locations where
a larger AICc figure and was not signifi- carcasses were found in order to reduce vari-
cant). We applied half-normal and hazard- able redundancy and habitat dimensionality.
rate canonical detection functions with cosine We used the varimax rotation of the initial
adjustments (cosine adjustment terms were factorial solution to ease the interpretation
automatically selected according to AIC of the factors obtained, retaining those com-
figures obtained while carrying out the dis- ponents with eigenvalues > 1. We employed
tance models) to the distribution of distances the ‘psych’ and ‘GPArotation’ (Bernaards
obtained for 431 different carcasses found & Jennrich, 2005) R packages. The first
under all electric line types. This first model component (PC1) accounted for 28% of the
included different covariates that can affect variance and was associated with the devel-
the probability of detection: species-specific opment of the shrub layer (factor loadings:
body mass of each carcass, an ordered factor shrub cover = 0.89, shrub height = 0.74).
defining the state of decomposition of car- The second component (PC2) defined a soil
casses using five levels (from 1: fresh whole gradient from rocks to sand (factor loading =
animal, to 5: degraded and fragmented re- 0.65) versus the development of the herba-
mains), and three PCA components sum- ceous layer (–0.87), accounting for 24% of
marising the habitat structure around the the variation in habitat structure. Finally, the
remains (see below). These covariates were third component (PC3; 25% of variance) was
z-standardised (i.e. mean 0 and standard positively associated with the cover of stones
deviation 1) prior to data analysis in order and rocks (factor loading = 0.90).
to obtain standardised beta regression co-
efficients. The best model (i.e. half-normal
or hazard-rate distributions) was selected Carcass disappearance
according to the Akaike Information Crite-
rion (AIC). Carcass disappearance was analysed by
Because the probability of detection of bird means of a split-plot design using Gener-
remains was significantly affected by body alised Mixed Effects models, including the
mass in the previous analysis (see Results), site as a random effect. Season (July and
we estimated the probability of detection of March) and time since carcass placement in
carcasses for each of the four size classes the field (1, 3, 7, 15, 30 days after placement)
(i.e. small, medium, large and very large) were incorporated as within-subsets fixed fac-
using the hazard-rate distribution with co- tors. lastly, carcass size (small, medium and
sine adjustments. We used the maximum large) and island (lanzarote and Fuerteven-
observed distance as the right truncation tura) were incorporated as between-subjects
considering the good GOF statistics and the fixed effects. The response variable was the
lack of outliers distant from the observer. proportion of carcasses for each size class
The Effective Strip Width (ESW) while remaining per site at each sampling visit (i.e.
searching for bird carcasses was separately binomial distribution). That is to say, the sam-
Ardeola 68(1), 2021, 71-94
Downloaded From: https://bioone.org/journals/Ardeola on 16 Sep 2020
Terms of Use: https://bioone.org/terms-of-use Access provided by Universidad Autonoma de Madrid82 GóMEz-CATASúS, J., CARRASCAl, l.M., MORAlEDA, v., COlSA, J., GARCéS, F. and SCHUSTER, C.
ple unit for data analyses was the size class Carcass dispersion around electric lines
at each different site per island, recording
the persistence of the two or three carcasses The GlS model was highly significant
per size class on five different occasions and (likelihood ratio test: χ 2 = 22.71, df = 4,
in two seasons. p < 0.0001; pseudo R2 = 7.5%). Body mass
We fitted three models with the same ran- of birds was negatively related to the distance
dom structure but different fixed structure: from wires at which the carcasses were found
1) null model, without fixed effects; 2) main (partial standardised regression coefficient
effects model, incorporating three fixed β = – 0.16, p < 0.01). Conversely, the average
factors (island: Fuerteventura vs. lanzarote; height of wires was positively related to the
season: July vs. March; carcass size: small, dispersion distance (β = 0.12, p = 0.017). The
medium and large) and time elapsed since factor line typology had no significant effect
carcass placement as fixed covariate (in loga- on dispersion distance (p = 0.876).
rithm, since a decelerated positive effect on The dispersion of the carcasses with
the disappearance of carcasses was expected; respect to the axis of electric lines followed
Ponce et al., 2010); and 3) the main effects a half-normal distribution. Figure 2A shows
model plus all two-way interactions includ- the pattern found below high-voltage lines
ing carcass size, since the full saturated four- surveyed up to 50m from the axis (323 dif-
way model was not possible due to sample ferent carcasses detected along 128.7km of
size limitations. Akaike’s second-order in- electric lines sampled in three different sea-
formation criterion corrected for small sam- sons). Thirty-four percent of the carcasses
ple sizes (AICc) was employed to select the were found at less than 10m from the electric
best model. The significance of interaction line axis. This proportion reached 50% (i.e.
terms was estimated using the equivalent quantile 0.5) up to 16m distance from the line
type II SS applied to maximum likelihood axis, 75% of carcasses up to 27.5m, 90% up
models. We used the ‘lme4’, ‘lmertest’ and to 36m, and 95% up to 42m. Summarising,
‘pbkrtest’ R-packages (Bates et al., 2019) to despite the effort of searching for carcasses
fit Generalised Mixed Effects models. up to 50m from the line axis, only 20% of
bird collision deaths were detected beyond
30m, despite the area from 30 to 50m re-
RESUlTS ceiving 40% (20/50 × 100) of the sampling
effort with respect to the total area covered.
A total of 431 carcasses was found in the The difference between the proportion of
field, 257 in Fuerteventura and 174 in lan- carcasses found from the axis of the electric
zarote. In both islands the greater number of line up to a certain distance and the area
carcasses was found during the third sam- covered are shown in Figures 2B and 2C.
pling period in March 2016 (124 and 67 The cost effectiveness of searching for car-
carcasses in Fuerteventura and lanzarote, casses reaches its maximum at 27m from the
respectively), followed by the second in axis of electric lines, for electric lines with
November-December 2016 (71 and 62 car- three to four wires and an average height of
casses, respectively) and the first in July 16.2m (95% confidence interval: 5-39m).
2015 (62 and 45 carcasses, respectively). As many as 74% of the carcasses were found
Carcasses were assigned to 22 different bird within 27m of the electric lines, despite re-
species; 23 carcasses that were unidentifiable quiring only 54% (27/50 × 100) of the time
were assigned to a size class (see Supple- and effort of sampling up to 50m.
mentary Material, Appendix 2, Table C2).
Ardeola 68(1), 2021, 71-94
Downloaded From: https://bioone.org/journals/Ardeola on 16 Sep 2020
Terms of Use: https://bioone.org/terms-of-use Access provided by Universidad Autonoma de MadridBIAS ESTIMATES OF BIRD COllISIONS AT ElECTRIC lINES 83
Carcass detectability a small proportion of dead bird remains
(approximately one eighth) are detected while
The maximum distances at which the car- surveying the lines for carcasses. The proba-
casses were detected in the field ranged from bility of detection of bird remains was signifi-
8m for the small class (S) to 30m for the cantly affected by the body mass (p < 0.0001)
very large class (vl), with maximum values of each species and by the state of decom-
of 20m for the medium (M) and large (l) position (p < 0.0001), with a larger magni-
classes. tude for the second effect according to stan-
The most parsimonious model was the dardised partial regression coefficients (β).
hazard-rate with cosine adjustments of order 2 larger bird species had a higher probability
(AIC = 1872.6), followed by the half-normal of detection (β = 0.19), and this probability
model with cosine adjustments of order 2 sharply decreased as the decomposition-frag-
and 4 (AIC = 1917.9). Thus, only the results mentation state of the carcasses increased
of the hazard-rate model are presented below. (β = – 0.35). Considering the three compo-
The Cramer-von Mises test of goodness-of-fit nents of habitat structure around the carcass
indicates a good fit of the hazard-rate model locations, only that related to rock cover
to the data (C-vM statistic = 0.25, p = 0.193). (bedrock or stones larger than a tennis ball;
The overall detection probability (con- PC3) was significantly related to the proba-
trolling for the five covariates included in bility of detection (p < 0.01, β = – 0.151):
the model) was 0.134 (95% confidence inter- this decreased as rock cover increased. The
val: 0.118-0.150). Therefore, only 13.4% of results regarding how body mass and the de-
the carcasses under the electric lines were de- composition-fragmentation state of carcasses
tected up to 30m from the observer (i.e. the affect the probability of detection suggest
maximum distance at which the carcasses breaking down the detectability according
were detected in the field), showing that only to groups of “relative size” of bird remains,
TABlE 1
Decomposition-fragmentation state of carcasses found in the field (1-fresh, 2-emphysematous, 3-coli-
cuative, 4-post-colicuative, 5-skeletal reduction) according to initial species body mass. Results are
expressed in percentages with respect to the total number of carcasses in each body mass class (N).
[Estado de descomposición-fragmentación de los cadáveres encontrados en el campo (1-fresco, 2-enfi-
sematoso, 3-colicuativo, 4-post-colicuativo, 5-reducción esquelética) atendiendo a la masa corporal
de las especies. Los resultados se expresan en porcentajes con respecto al total del número de cadá-
veres en cada una de las clases de masa corporal (N).]
Decomposition-fragmentation score
BODY MASS 1 2 3 4 5 N
< 100g 12.5 18.8 12.5 31.3 25.0 16
100-250g 7.5 3.7 12.4 17.4 59.0 161
250-1000g 2.6 0.5 3.6 11.3 82.1 195
> 1000g 5.1 0.0 6.8 15.3 72.9 59
Ardeola 68(1), 2021, 71-94
Downloaded From: https://bioone.org/journals/Ardeola on 16 Sep 2020
Terms of Use: https://bioone.org/terms-of-use Access provided by Universidad Autonoma de Madrid84 GóMEz-CATASúS, J., CARRASCAl, l.M., MORAlEDA, v., COlSA, J., GARCéS, F. and SCHUSTER, C.
taking into account the original size of the Carcass disappearance
bird and to what extent it has been broken
down by decomposition and fragmentation. The best model was the main effects model
Table 1 shows the relationship between four plus all two-way interactions including car-
classes of species body mass and the five cass size (AICc = 445.4; main effects model,
levels of decomposition-fragmentation of the AICc = 455.1; null model, AICc = 936.4).
431 different carcasses found in the field. This model was highly significant (lRTest:
The probability of detection, as well as the χ2 = 518.4, df = 13, p < 0.0001), accounting
Effective Strip Widths (ESW) while searching for 81.4% of the variation in carcass dis-
for bird carcasses are presented in Table 2 appearance rates. The persistence rate of car-
separately for four different sizes of bird casses was higher (p = 0.044) in lanzarote
remains. In addition, the distributions of de- (adjusted mean = 0.877) than in Fuerteven-
tection distances are shown for each size tura (0.520). Season had a negligible effect
class in Figure 3. on carcass disappearance (p = 0.640). Finally,
TABlE 2
Models fitted to the detection distances of four different size classes of bird remains: small (for pas-
serine-sized remains, < 20cm; N = 32), medium (20-35cm remains; N = 185), large (35-55cm remains;
N = 127) and very large (> 55cm remains; N = 87; see Methods and Figure 3). Detection distances for
each size class have been truncated at maximum distance figures. Detectability models were built for
each size of carcasses considering hazard-rate distribution, with cosine adjustments. The detection
probability (Pdetec) and the standard error (se) at the maximum distance at which the carcasses were
detected (Dmax in m) are provided for each size class. ESW is the effective strip width (expressed in
m). All Cramer-von Mises goodness of fit tests, which measure the difference between the empirical
distribution and the probability distribution function in a quantile-quantile plot, were not significant
after the false discovery rate adjustment for multiple P estimations (P > 0.104).
[Modelos de detectabilidad ajustados a las distancias de detección de las cuatro clases de tamaño para
los restos de aves: pequeños (restos con tamaños similares al de un paseriforme, < 20 cm; N = 32),
medianos (restos de 20-35cm; N = 185), grandes (restos de 35-55 cm; N = 127) y muy grandes (restos
> 55 cm; N = 87; véase Métodos y Figura 3). Las distancias de detección para cada tamaño han sido
truncadas a la distancia máxima. Los modelos fueron construidos para cada tamaño usando modelos de
“hazard-rate” (tasa de riesgo) con ajuste coseno. Se presenta para cada clase de tamaño la probabili-
dad de detección (Pdetec) y el error estándar (se) desde 0 m hasta la distancia máxima a la que los cadá-
veres fueron detectados (Dmax en m). ESW se refiere al ancho de banda efectivo (expresado en m). Los
tests de bondad de ajuste de Cramer-von Mises, los cuales miden la diferencia entre la distribución empí-
rica y la función de distribución en un gráfico cuantil-cuantil, no fueron significativos después de haber
controlado por las múltiples estimaciones de P mediante el método fdr (false discovery rate; P > 0,104).]
Size class Dmax (m) Pdetec ± se ESW (m)
Small 8 0.314 ± 0.059 2.5
Medium 20 0.180 ± 0.018 3.6
large 20 0.197 ± 0.027 3.9
very large 30 0.166 ± 0.022 5.0
Ardeola 68(1), 2021, 71-94
Downloaded From: https://bioone.org/journals/Ardeola on 16 Sep 2020
Terms of Use: https://bioone.org/terms-of-use Access provided by Universidad Autonoma de MadridBIAS ESTIMATES OF BIRD COllISIONS AT ElECTRIC lINES 85
bird size and time elapsed had a paramount in- rates with electric lines, derived from carcass
fluence on carcass disappearance (p < 0.0001). counts in arid landscapes characterised by
The interaction term island by size was not low vegetation cover. Imperfect detection and
significant (p = 0.952). The effect of body carcass removal by scavengers are the two ma-
size was marginally different across seasons jor bias sources affecting carcass counts (see
(p = 0.058), with a higher disappearance rate also Ponce et al., 2010; Borner et al., 2017;
of large birds in July (0.948) than in March Barrientos et al., 2018). To our knowledge,
(0.990), with no clear changes in the other this is the first study addressing the factors
two sizes. The effect of time elapsed since affecting the dispersion patterns of carcasses
carcass placement in the field changed among around electric lines, defining a methodologi-
body size classes (p = 0.001; see Figure 4): cal and analytical approach for establishing
persistence rate decreased more abruptly for the sampling areas around such lines.
small birds. The methodology employed in this study
would have certain limitations if the main
aim were to obtain accurate mortality esti-
DISCUSSION mates. Firstly, three visits in nine months is
less desirable to obtain absolute estimations
This work provides important insights on of bird fatalities than one visit every week or
bias sources when estimating avian collision fortnight (but see Shaw et al., 2018 for a
1.0
proportion of carcasses
0.8
0.6
0.4
0.2 small size
medium size
large size
0.0
1 3 7 15 30
days
FIG. 4.—Proportion of carcasses of small (chicks of Domestic Chicken), medium (Rock Pigeons or
Common quails) and large (Domestic Chicken) birds remaining 1, 3, 7, 15 and 30 days after they were
placed in the field. Sample size is two birds per size class at 12 different localitions and on two different
occasions (July 2015 and March 2016). vertical bars are mean ± standard error.
[Proporción de cadáveres de aves pequeñas (pollos de gallina doméstica), medianas (paloma bravía
o codorniz común) y grandes (gallina doméstica) que permanecieron después de 1, 3, 7, 15 y 30 días
de exposición en el campo. El tamaño de muestra es de dos aves por categoría de tamaño en 12 loca-
lizaciones distintas y en dos ocasiones diferentes (julio 2015 y marzo 2016). Las barras verticales re-
presentan la media ± error estándar.]
Ardeola 68(1), 2021, 71-94
Downloaded From: https://bioone.org/journals/Ardeola on 16 Sep 2020
Terms of Use: https://bioone.org/terms-of-use Access provided by Universidad Autonoma de Madrid86 GóMEz-CATASúS, J., CARRASCAl, l.M., MORAlEDA, v., COlSA, J., GARCéS, F. and SCHUSTER, C.
similar approach with four sampling periods effort-demanding sampling protocols are
for a whole annual cycle). Nevertheless, un- recommended and should be prioritised if
der logistic, funding or time constraints the resources are available to obtain accurate,
only possibility is to deal with sources of absolute, mortality estimates, disappearance
sampling biases, to model them and to apply rate and decomposition experiments should
that knowledge to the data recorded in the be conducted in order to determine correc-
field at lower frequencies. Secondly, without tion figures and not to underestimate bird
clearing the remains before the first survey fatalities.
it is difficult to estimate the time from colli-
sion and thus, the number of casualties per
unit of time. Fieldwork should respect the Carcass dispersion around electric lines
legal regulations related to the manipulation
of bird remains, as many of them are species Dispersion patterns of carcasses after
of conservation concern. In many instances, colliding with human structures is key to
the researchers cannot wait until the environ- defining the shape and extension of the
mental rangers walk all the surveyed power searchable area during carcass counts (Huso
lines to confirm and remove all carcasses & Dalthorp, 2014), essential to extrapolate
whose spatial locations were provided by the fatality estimates for unsearched areas accu-
research team. Moreover, to clear the area rately. These aspects have received con-
below electric lines of carcasses prior to sam- siderable attention at other human structures
pling requires a great deal of effort that the (e.g. wind farms; Hull & Muir, 2010; Huso &
funding of a research project probably could Dalthorp, 2014) but not with fatalities asso-
not afford, especially under extensive moni- ciated to electric lines. Our results suggest
toring programmes (e.g. we walked 531km that dispersion patterns of carcasses around
over 262 hours per study period searching electric lines depend on species size and the
for carcasses). The impossibility of clearing height of the cables, a key difference between
the areas under the power lines of carcasses line typologies (see ‘Study area’ in Methods).
demands a concurrent methodological ap- Firstly, cable height was the most important
proach dealing with the temporal variation in predictor, positively affecting dispersion dis-
the disappearance and decomposition state tance. This means that taller electric lines
of the bird fatalities, and obtaining detailed demand broader search areas, and thus the
information of those “historical records” by sampling belt should be defined according to
means of measuring their degradation state, the height of the electric line. Secondly, the
photographing the remains and obtaining dispersion distance of carcasses was nega-
accurate GPS positions. Thus, during the tively affected by body mass suggesting that
second sampling session, the researchers large birds are more likely to be found near
could check if they have found the same car- the line than small birds. This result contrasts
casses by considering the spatial locations with the effect found at wind turbines where
and photos taken on the first occasion. By larger birds tend to fall further away (e.g.
means of this approach we were able to infer Hull & Muir, 2010). This discrepancy may
with sufficient precision whether bird fatali- be related to the different nature of the colli-
ties had occurred during the previous 30 days sions: impact with static cables v. the force
(degradation state lower than 4; Moraleda et exerted by the blades of wind turbines.
al., in prep.), and thus we could restrict the The evaluation of dispersion patterns of car-
sample of bird fatalities only to the last week, casses along with a cost-effectiveness assess-
fortnight or month. Therefore, although more ment of carcass search, can be employed to
Ardeola 68(1), 2021, 71-94
Downloaded From: https://bioone.org/journals/Ardeola on 16 Sep 2020
Terms of Use: https://bioone.org/terms-of-use Access provided by Universidad Autonoma de MadridBIAS ESTIMATES OF BIRD COllISIONS AT ElECTRIC lINES 87
optimise the methodologies for estimating Carcass detectability
collision fatality rates. This approach allowed
us to identify a 27m distance threshold at Previous studies have highlighted the low
which the cost effectiveness of searching for detectability of body remains during carcass
carcasses reached its maximum. Beyond this searches, leading to the underestimation of
distance, the proportion of carcasses found bird mortality rates at electric lines and other
decreased relative to the investment of physi- infrastructures (e.g. communication towers,
cal effort. However, this result is contingent fences, roads; Stevens et al., 2011; Santos et
on the type of infrastructures, habitats and al., 2016; Barrientos et al., 2018). Differences
species involved, and the 27m threshold in detection rates have been attributed to site-
should not be generalised to other study (Stevens et al., 2011; Smallwood, 2013) and
areas. Only 26% of bird collision deaths were species-specific factors (Smallwood, 2007;
detected > 27m from the axis of the studied Ponce et al., 2010; Barrientos et al., 2018).
electric lines, in spite of the fact that 46% In our study, the overall detection probability
of the time and physical effort was invested was 0.134, which means that c. 86.6% of
in sampling from 27 to 50m. This suggests carcasses were passed undetected up to 30m
that, even for high-voltage lines, it is un- from the observer. Moreover, detection proba-
profitable to sample beyond 27m from the bility values sharply decreased as the decom-
axis, considering time-effort costs and the position-fragmentation state increased. These
amount of bird fatalities recorded for a broad results suggest a joint effect between body
spectrum of avian species from lesser Short- mass and decomposition state, since for in-
toed lark Calandrella rufescens to Houbara stance, a large bird such as a Common Raven
Bustard Chlamydotis undulata. However, a may be less detectable several months after
drawback of the narrowing of the sampling collision than a recent fatality of a smaller
belt is that a proportion of small-sized birds bird, such as a Eurasian Collared-dove. On
may not be detected (20.3% of birds smaller the other hand, the probability of detection
than 250g). Future studies addressing avian is also habitat-dependent, being lower in very
mortality rates at high-voltage lines should rocky areas but unaffected by vegetation
take into account this 30m distance threshold, cover. Some studies have attributed the ef-
in order to optimise sampling effort. However, fect of vegetation cover to a loss in visibility
these results are dependent on other sources (Stevens et al., 2011; Smallwood, 2013) but
of bias not considered in this study that may others did not find any effect of habitat struc-
influence carcass dispersion patterns. For ture on detection probabilities (Ponce et al.,
instance, injured birds may move further 2010; Borner et al., 2017). Our study area is
from the electric line axis outside the search dominated by sparsely vegetated landscapes
area (i.e. crippling bias, Heijnis, 1980; Bech with an expected low influence on the detec-
et al., 2012; Murphy et al., 2016). In addi- tion probability of bird remains. Nevertheless,
tion, stochastic events such as wind direction rock cover offered a significant challenge
at the moment of collision or carcass dis- when walking through rough terrain. Rocky
placement by scavengers may affect recorded (e.g. malpaíses) or stony (e.g. large loose
fall distances. Even though these factors were stones close together) soils demand con-
affecting the dispersion data of our study, tinuous attention so as not to fall and get
they were not included in the analysis as pre- hurt while searching for bird carcasses. This
dictor variables, thus contributing to the low is especially important in hillside areas with
amount of deviance accounted for by the steep slopes and deep runoff cracks. In fact,
generalised model (pseudo R2 = 7.5%). all the people involved in this study have
Ardeola 68(1), 2021, 71-94
Downloaded From: https://bioone.org/journals/Ardeola on 16 Sep 2020
Terms of Use: https://bioone.org/terms-of-use Access provided by Universidad Autonoma de MadridYou can also read