FastReport Business Graphics Programmer Manual - Version 2021.1 2021 Fast Reports Inc - www.fast-report.com
←
→
Page content transcription
If your browser does not render page correctly, please read the page content below
FastReport
      Business Graphics
      Programmer Manual
      Version 2021.1
      © 2021 Fast Reports Inc.

www.fast-report.com              1 / 30
General Information
FastReport Business Graphics is a library for data visualization and analysis.
FastReport Business Graphics includes the following charts:
TreeMap;
Sunburst;
Icicle;
Gantt Chart.
At the moment, working with WinForms and .NET Framework 4.x applications is supported.
Installing into Visual Studio Toolbox
Distribution with the application
Compiling the source code
www.fast-report.com 2 / 30Installing into Visual Studio Toolbox
To install the FastReport Business Graphics components into Visual Studio Toolbox manually, do the following:
delete the FastReport Business Graphics category from the Toolbox if it is there;
create a new category (to do this, right-click the Toolbox and select "Add Tab" item) or select the existing
category into which you would like to add the FastReport components;
right-click on the selected category and select "Choose Items...";
in the window that opens, click the "Browse..." button and select the FastReport.BG.dll file (located in the
"C:\Program Files\FastReports\FastReport.BG" folder);
close the window with the OK button.
After that, you will see the following visual FastReport Business Graphics components in the category you had
selected:
Treemap;
Sunburst;
Icicle;
BreadCrumbs;
GanttChart.
www.fast-report.com 3 / 30Compiling the source code
A source code of the FastReport.BG.dll library is shipped with FastReport Business Graphics Professional edition.
You may include it in your application. Let us demonstrate how to do this:
open your project in Visual Studio;
open Solution Explorer window and right-click on the "Solution" item;
choose the "Add/Existing Project..." item;
add the "FastReport.BG.csproj" file (it is located in the "C:\Program Files\FastReports\FastReport.BG\Source"
folder);
Turn off assembly signing for FastReport Business Graphics project. To do this:
right-click the "FastReport.BG" project;
choose the "Properties" item;
switch to the "Signing" tab and uncheck the "Sign the assembly" checkbox.
www.fast-report.com 4 / 30Deployment
You may disseminate the following files along with your application:
FastReport.BG.dll - the main FastReport Business Graphics library;
FastReport.BG.xml - comments to classes, properties and methods used in FastReport Business Graphics .
This file is used by the script editor and in the hint panels (when selecting a function in the "Data" window or
any property in the "Properties" window). There is no obligation to distribute this file.
www.fast-report.com 5 / 30Integrating FastReport Business Graphics into
FastReport .NET
It is possible to connect and use FastReport.BG charts in FastReport .NET. To do this, you should first build the
FastReport Business Graphics library.
After that, you need to add the reference to the assembled library to the FastReportBG Object plugin. The source
code of the plugin can be found in the FastReport .NET distribution in the Extras\Objects\FastReportBGObjects
folder.
After the plugin has been built, add it to FastReport .NET. This can be done in the FastReport .NET designer.
After installing the plugin, restart the designer.
www.fast-report.com 6 / 30FastReport Business Graphics charts
This chapter describes the available FastReport Business Graphics charts, classes and principles of working with
them:
Hierarchical data sources
Creating a new chart
Sunburst chart
TreeMap chart
Icicle chart
Gantt chart
Data sources for the Gantt chart
BreadCrumbs
Editing charts
Export to various graphical formats
www.fast-report.com 7 / 30Hierarchical data sources
There are two classes in the FastReport Business Graphics standard set that provide data representation for
hierarchical charts.
HierarchicalRecordsSource
This class allows specifying data manually. To do this, fill the Records collection with HierarchicalRecord
elements, each with Text and Value fields to define the text and value of the record, and the Children collection
in which child records are placed.
Thus, the Children and Parent fields (filled automatically) build a hierarchical relationship between records.
In the following example, we create an instance of HierarchicalRecordsSource and add to it the Bakery products
record, which in turn contains three child records: Ciabatta , Bread and Croissant.
HierarchicalRecordsSource recordsSource = new HierarchicalRecordsSource();
// Creating a "Bakery products" record. The constructor for creating a record may not take a value if it
is a record containing child nodes
HierarchicalRecord r = new HierarchicalRecord("Bakery products");
// Creating child records. Text and value are passed to the constructor
r.Children.Add(new HierarchicalRecord("Ciabatta", 3));
r.Children.Add(new HierarchicalRecord("Bread", 5));
r.Children.Add(new HierarchicalRecord("Croissant", 1));
// Adding a parent record to the list of source records
recordsSource.Records.Add(r);
Some charts, such as Sunburst , can display a root element. To set the parameters of the root element, the Root
property must be filled in.
recordsSource.Root.Text = "Root element";
HierarchicalListSource
This class allows building a hierarchical structure based on tabular sources ( System.Data.DataSet , System.Array )
using the standard DataBinding procedure.
To build a hierarchy, set the LevelTextMembers collection with field names in nesting order.
For example:
listSource.LevelTextMembers.Add("Country");
listSource.LevelTextMembers.Add("City");
The ValueMember field specifies the field that will be used to define the record value.
Suppose you have a DataTable with the Country and City fields setting the hierarchy and the Population field
www.fast-report.com 8 / 30setting the value. To load the data from DataTable , we need the following code:
listSource = new HierarchicalListSource();
listSource.BeginInit();
listSource.DataSource = dataTable;
listSource.LevelTextMembers.Add("Country");
listSource.LevelTextMembers.Add("City");
listSource.ValueMember = "Population";
listSource.EndInit();
Note that we use the BeginInit() and EndInit() calls to disable events triggering during property setup.
www.fast-report.com 9 / 30Creating a chart
To create a chart from a program, use the following code:
// Create a TreeMap chart
TreeMap treeMap = new TreeMap();
Then connect a data source to the chart. There are various data sources for hierarchical charts and you can read
about them in the chapter ["Hierarchical Data Sources"] (HierarchicalDataSource.md).
Let us create the data source, fill in the information, and connect the data source:
HierarchicalRecordsSource treeMapRecordsSource = new HierarchicalRecordsSource();
// Start of initialization - allows to disable the call of source change events
treeMapRecordsSource.BeginInit();
// Creating a "Bakery products" record. The constructor for creating a record may not take a value if it
is a record containing child nodes
HierarchicalRecord r = new HierarchicalRecord("Bakery products");
// Creating child records. The text and value are passed to the constructor
r.Children.Add(new HierarchicalRecord("Ciabatta", 3));
r.Children.Add(new HierarchicalRecord("Bread", 5));
r.Children.Add(new HierarchicalRecord("Croissant", 1));
// Adding a parent record to the list of source records
treeMapRecordsSource.Records.Add(r);
// Similarly, create other records
r = new HierarchicalRecord("Alcohol");
r.Children.Add(new HierarchicalRecord("Wine", 6));
r.Children.Add(new HierarchicalRecord("Whiskey", 2));
r.Children.Add(new HierarchicalRecord("Beer", 5));
treeMapRecordsSource.Records.Add(r);
r = new HierarchicalRecord("Dairy products");
r.Children.Add(new HierarchicalRecord("Yoghurt", 3));
r.Children.Add(new HierarchicalRecord("Milk", 4));
treeMapRecordsSource.Records.Add(r);
// End of the source initialization
treeMapRecordsSource.EndInit();
// Connecting to the data source of the list chart
treeMap.DataSource = treeMapRecordsSource;
After you connect the data source, the chart will look like this:
www.fast-report.com 10 / 30www.fast-report.com 11 / 30
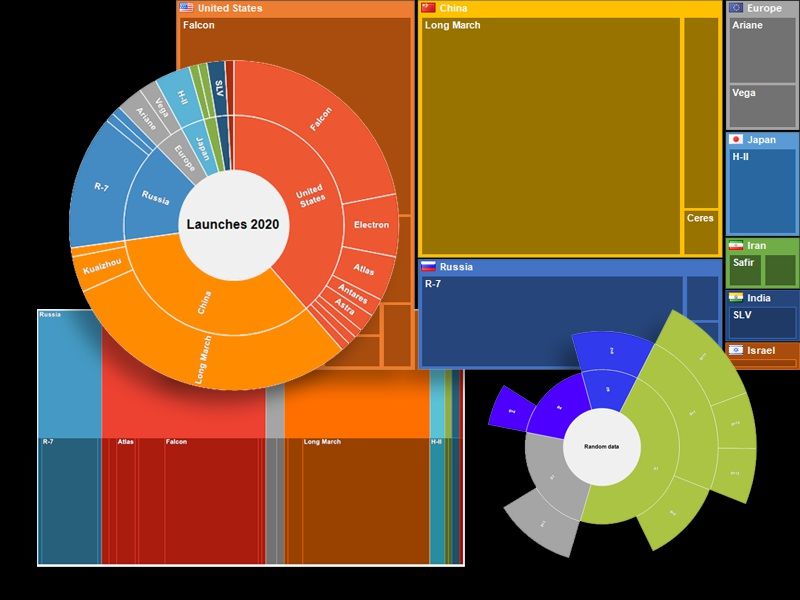
Sunburst chart

      Description
      This is a sun-like chart with branching rays. The circle in the center is the root node, and the rays that move
      outward are the child elements. Each value in the chart occupies an area with the boundaries defined by the
      starting angle and the scanning angle. The larger the value which should be displayed on the chart, the larger the
      scanning angle.

      Applications
      The chart is suitable for analyzing each level of the hierarchy.

      Starting angle
      The starting angle is the property determining from which angle the building of the Sunburst chart will start. The
      initial value is -90 , i.e. the building starts from the top cental point. To change the angle, it is necessary to use the
      StartAngle` property.

          sunburst.StartAngle = 35;

      Text direction
      In the Sunburst chart, the text direction can be changed. To do this, change the     TextDirecion   property of the
      Sunburst object. There are 2 types of text direction:
        1. Radial - in this mode, the text will be directed as rays from the center;
        2. Tangential - in this mode, the text will be displayed circle-wise inside the chart.

www.fast-report.com                                                                                                                12 / 30
Sunburst sunburst = new Sunburst();
// Radial text display mode for the Sunburst chart
sunburst.TextDirection = TextDirection.Radial;
// Tangential text display mode for the Sunburst chart
sunburst.TextDirection = TextDirection.Tangetial;
www.fast-report.com 13 / 30Treemap chart
Description
A TreeMap chart is a mode of visualizing hierarchical data in the form of rectangles with areas proportional to the
values of the displayed records. Inside the rectangles of parent records, rectangles of child records are nested.
Applications
A tree chart is suitable for simultaneous comparison of several hierarchies.
Display mode
The TreeMap chart display mode can be changed. There are two standard display modes:
1. BestAspectRatio (default) - in this mode, the area builder will make the rectangles aspect ratio as close to 1
as possible.
2. UseMinAspect - in this mode, the area builder considers the available width and height and chooses the
minimal length (width or height) for each rectangle.
To change the display mode, use the LayoutMode property:
// The TreeMap chart display mode with the best aspect ratio
treeMap.LayoutMode = TreeMapLayoutMode.BestAspectRatio;
// The display mode in which the hierarchical records will use the smallest aspect ratio
treeMap.LayoutMode = TreeMapLayoutMode.UseMinAspect;
In addition, if necessary, you can create your own area builder class and connect it to the component by overriding
the GetLayoutBuilder event.
www.fast-report.com 14 / 30Icicle chart
Description
The Icicle chart represents data based on the hierarchical clustering method. The Icicle chart is easier to read,
showing which hierarchy the objects belong to and which objects are child ones. The large rectangle at the top of
the chart represents the root node, whose width depends on the sum of the child nodes. The child nodes are placed
below the parent nodes. The chart can also have several drawing directions: downwards, upwards, leftwards, and
rightwards.
Applications
An icicle chart is a good way to visualize hierarchical data. Its advantage is an easily seen hierarchy, its size, and the
level at which it is located. It is also great for examining data relationships.
Change of direction
In the Icicle chart, you can change the direction of the chart itself (originally set to Down). To do this, use the
Direction property:
Icicle icicle = new Icicle();
icicle.Direction = IcicleDirection.Right;
www.fast-report.com 15 / 30GanttChart
Description
A Gantt chart illustrates a work plan/schedule for a project. It consists of two parts: the left part has a list of tasks,
and the right part has a timeline with bars that depict the work. The colors for the intervals are allocated according
to the resources from the palette.
Application
The Gantt chart makes it possible to solve one of the main tasks of business process planning and show the staff
what to work on, what resources to apply in the process and at what speed to perform certain tasks. Using a Gantt
chart greatly simplifies the management of small-scale projects.
Maximum width of the left side
The MaxLeftPartWidth property is used to specify the maximum width that the left part of the task names can have.
The initial value is 500 . To change the angle you need to refer to the MaxLeftPartWidth property.
gantt.MaxLeftPartWidth = 150;
Text at intervals
www.fast-report.com 16 / 30This property enables or disables the rendering of the task name along with the interval. The initial value is false .
To change it you need to refer to the TextOnIntervals property.
gantt.TextOnIntervals = true;
Text position
If the TextOnIntervals property is true, you can change the position of the text relative to the interval. There are 2
standard display modes:
1. Left (default) - the text will be drawn to the left of the interval.
2. Center - the text will be drawn in the middle of the interval.
To change the display mode it is necessary to refer to the property TextPosition .
//The mode in which the text will be drawn to the left of the interval
gantt.TextPosition = TextPosition.Left;
//The mode in which the text will be drawn in the middle of the interval
gantt.TextPosition = TextPosition.Center;
Also note that the text will be drawn only if there is room for it.
Chart distance
The chart can have several scaling distances. To do this, you must change the Distance property. The standard
value is Month . Each of them is suitable for a certain total duration of all tasks. There are 3 types of distance:
1. Annual - the header will have years in the upper division and months in the lower division;
2. Monthly - the header in the upper division will be months, and the lower division will be days;
3. By day - the header in the upper division will include days, and the header in the lower division will include
hours.
// Annual display mode for the Gantt chart
chart.Distance = Distance.Year;
// Monthly display mode for the Gantt chart
chart.Distance = Distance.Month;
// Display mode by day for the Gantt chart
chart.Distance = Distance.Day;
Number of divisions in the header date
For some header types (such as Distance.Month and Distance.Day ) you can change the number of divisions at the
bottom. For Monthly display mode, this is the number of days into which the month will be divided, and for Day
display mode, this is the number of time intervals into which the day will be divided. The standard value is 12 . To
change the number of divisions, refer to the SegmentationInHeader property.
gantt.SegmentationInHeader = 15;
This property has no effect on the year view.
www.fast-report.com 17 / 30String Template
In each of the display modes, there is a part in the header in which the date is displayed according to a certain
pattern. In the year display mode it is the lower part, which is responsible for months, and in the month and day
display modes it is the upper part, which is responsible for months and days respectively. The format in which such
dates will be displayed can be changed by the Pattern property. The initial value is MMMM . The complete list can be
found at here.
// The date 1.1.2021 will be displayed as "January 1"
chart.Format = "MMMM d";
Heading
You can change the position of the header in the chart, or not display it at all. To change the position you need to
refer to the HeaderPosition property. The standard value is HeaderPosition.Top . There are 3 standard modes of
header position:
1. Top (default) - the header will be located at the top of the chart.
2. Bottom - the header will be located at the bottom of the chart. Also the top and bottom parts of the header
will be swapped.
3. None - the header will not be displayed.
// The header will be at the top
chart.HeaderPosition = HeaderPosition.Top;
// The header will be at the bottom
chart.HeaderPosition = HeaderPosition.Bottom;
// The header will not be displayed
chart.HeaderPosition = HeaderPosition.None;
Header height
The default value of DefaultHeaderHeight is true . In this case, the header height is equal to two heights of one
record. The height of one record, in turn, depends on the height of the chart. To disable this behavior set the
DefaultHeaderHeight property to false . After that, you can set a fixed header height with the property
HeaderHeight .
// The height of the header will be 70
chart.DefaultHeaderHeight = false;
chart.HeaderHeight = 70;
// The header height will be calculated according to the standard algorithm
chart.DefaultHeaderHeight = false;
Display the top date in the header
The chart has the ability not to display the top line of the header. The ShowTopDateInHeader property is responsible
for this. The default value is true . To not show the top line you have to set this property to false . In this case the
height of the remaining top division will be equal to the whole height of the header.
gantt.ShowTopDateInHeader = false;
www.fast-report.com 18 / 30Bottom date view in the header
For the bottom date, you can change the position of the date display relative to its section. This is done with the
BottomDateView property. There are 2 types of display:
1. Cell (default) - the date will be located between its section line and the next, being located as if in a cell.
2. Center - the date will be displayed in the middle of its section line.
// The date will be positioned between its own and the next line of the section
chart.BottomDateView = BottomDateView.Cell;
// The date will be in the middle of its section line
chart.BottomDateView = BottomDateView.Center;
The grid
By default, the chart draws a grid, the number of horizontal bars depends on the number of tasks, and vertical bars
on the number of divisions at the bottom of the header. To turn off the drawing of horizontal bars, move the
property DrawHorizontalGrid to the false position, and to turn off the vertical bars, move the property
DrawVerticalGrid to the false position. By default, these properties are set to false . The value of these
properties has no effect on the drawing of dividing bars between the left part of the chart, the header and the
central area - they will be drawn anyway.
// Horizontal dividing lines will not be drawn
chart.DrawHorizontalGrid = false;
// Vertical dividing lines will not be drawn
chart.DrawVerticalGrid = false;
Creating a chart
To create a diagram from a program, you must use the following code:
GanttChart chart = new GanttChart();
Then you must connect the data source to the chart. By default, the chart has an empty data source. You can use
both csv or xml file loading methods as a data source in it, or you can create your own list. You can read more
about them in the chapter Data Sources for Gantt Chart.
Consider creating your own list. Let's create our list and fill it with information:
www.fast-report.com 19 / 30//Create a new list
List myData = new List();
//Add items to the list
myData.Add(new GanttRecord()
{
Text = "Wake up",
StartDate = new DateTime(day: 1, month: 5, year: 2021, hour: 10, minute: 0, second: 0),
EndDate = new DateTime(day: 1, month: 5, year: 2021, hour: 10, minute: 10, second: 0)
});
myData.Add(new GanttRecord()
{
Text = "Take a shower",
StartDate = new DateTime(day: 1, month: 5, year: 2021, hour: 10, minute: 10, second: 0),
EndDate = new DateTime(day: 1, month: 5, year: 2021, hour: 10, minute: 30, second: 0)
});
myData.Add(new GanttRecord()
{
Text = "Breakfast",
StartDate = new DateTime(day: 1, month: 5, year: 2021, hour: 10, minute: 30, second: 0),
EndDate = new DateTime(day: 1, month: 5, year: 2021, hour: 11, minute: 00, second: 0)
});
myData.Add(new GanttRecord()
{
Text = "Go to the grocery store",
StartDate = new DateTime(day: 1, month: 5, year: 2021, hour: 11, minute: 0, second: 0),
EndDate = new DateTime(day: 1, month: 5, year: 2021, hour: 12, minute: 30, second: 0)
});
myData.Add(new GanttRecord()
{
Text = "Cooking for the party",
StartDate = new DateTime(day: 1, month: 5, year: 2021, hour: 12, minute: 30, second: 0),
EndDate = new DateTime(day: 1, month: 5, year: 2021, hour: 14, minute: 00, second: 0)
});
myData.Add(new GanttRecord()
{
Text = "Get the house ready for the party",
StartDate = new DateTime(day: 1, month: 5, year: 2021, hour: 14, minute: 00, second: 0),
EndDate = new DateTime(day: 1, month: 5, year: 2021, hour: 15, minute: 40, second: 0)
});
myData.Add(new GanttRecord()
{
Text = "Set the table",
StartDate = new DateTime(day: 1, month: 5, year: 2021, hour: 15, minute: 40, second: 0),
EndDate = new DateTime(day: 1, month: 5, year: 2021, hour: 15, minute: 50, second: 0)
});
myData.Add(new GanttRecord()
{
Text = "To meet guests",
StartDate = new DateTime(day: 1, month: 5, year: 2021, hour: 15, minute: 50, second: 0),
EndDate = new DateTime(day: 1, month: 5, year: 2021, hour: 16, minute: 00, second: 0)
});
myData.Add(new GanttRecord()
{
Text = "Celebrate a birthday",
StartDate = new DateTime(day: 1, month: 5, year: 2021, hour: 16, minute: 00, second: 0),
EndDate = new DateTime(day: 1, month: 5, year: 2021, hour: 23, minute: 59, second: 0)
});
// Connect your list as a data source for the chart
chart.DataSource.DataSource = myData;
// If the data is connected in this way, you don't need to specify Name, StartDate, EndDate and Resource
Member.
Since these are tasks for the day, it is necessary to change some properties of the chart for the best perception:
www.fast-report.com 20 / 30chart.Distance = Distance.Day;
chart.DrawHorizontalGrid = false;
chart.DrawVerticalGrid = false;
chart.SegmentationInHeader = 16;
chart.TextOnIntervals = true;
chart.TextPosition = TextPosition.Left;
chart.BottomDateView = BottomDateView.Center;
chart.ShowTopDateInHeader = false;
chart.DefaultHeaderHeight = false;
chart.HeaderHeight = 60;
chart.MaxLeftPartWidth = 100;
www.fast-report.com 21 / 30Data sources for the Gantt chart
The GanttDataSource class exists to connect the chart to the data source. By default, it is already contained in the
chart, but does not have any data in it.
GanttDataSource
The class allows to build a hierarchical structure based on table sources ( System.Data.DataSet , System.Array )
using standard mechanism DataBinding , load existing data set from XML or CSV files, as well as set data manually.
To load data from files there are methods ReadXmlDta and ReadCsvData .
GanttDataSource source = new GanttDataSource();
// Loads dataset from xml file
source.ReadXmlData(path_to_xml_file);
After (or before) loading the data, you need to specify which fields will be used to define the values.
Suppose you have an Xml file whose node has the following form:
To load the data from this xml we need the following code:
source.NameMember = "text";
source.StartDateMember = "StartDate";
source.EndDateMember = "EndDate";
source.ResourceMember = "text";
It is not necessary to use ResourceMember . If it is not specified, all records will have an index of 0 and will use the
first color in the palette when rendering.
It's also possible to use a simple list as data. To do this, fill the records collection with GanttRecord elements, each
with fields Text , StartDate , EndDate and Index to define the text, start date, end date and index of the record.
In the following example we create an instance of GanttDataSource and set it as the data source.
www.fast-report.com 22 / 30GanttDataSource source = new GanttDataSource();
// Creating a new list
List records = new List();
// Filling the list with items
records.Add(new GanttRecord()
{
Text="Task1",
StartDate = new DateTime(day: 1, month: 1, year: 2021),
EndDate = new DateTime(day: 10, month: 1, year: 2021),
Index = 0
});
records.Add(new GanttRecord()
{
Text="Task2",
StartDate = new DateTime(day: 10, month: 1, year: 2021),
EndDate = new DateTime(day: 20, month: 1, year: 2021),
Index = 1
});
records.Add(new GanttRecord()
{
Text="Task3",
StartDate = new DateTime(day: 20, month: 1, year: 2021),
EndDate = new DateTime(day: 31, month: 1, year: 2021),
Index = 2
});
// Set the list as the data source
source.DataSource = records;
Note that this method does not need to specify which fields will be used to define values.
www.fast-report.com 23 / 30BreadCrumbs
The BreadCrumbs component allows displaying the current nesting state of a hierarchical chart, as well as to
navigate between the nesting levels.
To connect the component to the chart, set the DrillDownView property.
For example, put the chart on the form
Then put the BreadCrumbs component on the form.
In the DrillDownView property of the BreadCrumbs component, specify the previously created chart.
To create a component from the program, use the following code:
// Creating a BreadCrumbs object
BreadCrumbs breadCrumbs = new BreadCrumbs();
// Connecting to the chart
breadCrumbs.DrillDownView = treeMap;
www.fast-report.com 24 / 30Editing charts
In the style editor, one can choose a color palette to set the color of the chart nodes.
The chart editor also allows setting the style:
of a node;
of the node on which the cursor is pointing;
of the currently selected node.
Maximum depth
The maximum depth is the chart property responsible for the number of hierarchy levels currently displayed.
Changing the depth is available for any hierarchical charts. If the value is zero, the number of displayed levels is not
limited. To change the depth value from the code, use the MaxDepth property:
sunburst.MaxDepth = 2;
www.fast-report.com 25 / 30Export to various graphical formats
Currently, FastReport Business Graphics supports exporting to the fllowing graphical formats: BMP , PNG , JPEG ,
TIFF , GIF , EMF .
Export settings dialog box
Export window options
Format - select the format of the image to be saved;
Resolution - the resolution of the resulting image; 96 is the standard screen resolution;
Jpeg quality - the quality of the Jpeg file (when selecting this format in the Format field) in percent; the higher
the number, the higher the quality of the file and the lower its compression;
Multi-frame TIFF - if export generates multiple images, then selecting the TIFF format will generate a single
multi-page file;
Monochrome TIFF - black-and-white image when the TIFF format is selected;
Open after export - If this checkbox is selected, the file will be opened after saving.
An example of export from the code to a graphical format
FastReport.BG.Export.Image.ImageExport export = new FastReport.BG.Export.Image.ImageExport();
export.Export(chart); // export any HierarchicalChartBase
www.fast-report.com 26 / 30Localization
FastReport Business Graphics can be localized to any language. The distribution includes translation files in the
Localization folder.
Switching localization from the code
You can switch localization from the code as follows:
FastReport.BG.Utils.Res.LoadLocale("Russian.fcl");
An overloaded method is also available to load a locale file from Stream .
You can switch to the English locale using the following code:
FastReport.BG.Utils.Res.LoadEnglishLocale();
Translating resources to another language
In the Professional edition, you can use the base resource file in the English language
FastReport.BG\Resources\en.xml .
If you do not have a subscription to the Professional edition, you can request this file by sending an email to
support@fast-report.com.
The result of the translation of this file should be saved in a file with a name relevant to the target language. You
also need to change the extension to *.fсl .
The translated file should be sent to support@fast-report.com.
www.fast-report.com 27 / 30Demo examples
Example of using charts with various data sources
The example project can be found in the distribution in the \Demos\C#\MainDemo folder.
Open the csproj file in Visual Studio, build and run the project.
After startup, the demo program window will open.
In the left part of the window, you can select the demo data source.
In the right part of the window, you can select tabs with various diagrams. At the bottom of the tabs, there are
display settings.
In the bottom left corner, there is a button to export the chart to various graphical formats.
www.fast-report.com 28 / 30Minimal system requirements
The minimal system requirements for installing and using FastReport Business Graphics are:
Operating system MS Windows 7-10, Windows Server 2012-2019;
CPU: 1 GHz;
RAM: 512 MB;
You also need the installed .NET Framework version 4.0 or higher.
www.fast-report.com 29 / 30Contacts and technical support
You can always ask questions about using the product by email, or by using the form on the website.
We also welcome your suggestions on how to improve our product.
www.fast-report.com 30 / 30You can also read