FIXED INCOME PRESENTATION - March 2020 - Merlin Properties

Page created by Alfredo Jensen
 
CONTINUE READING
FIXED INCOME PRESENTATION - March 2020 - Merlin Properties
FIXED INCOME
PRESENTATION
March 2020
FIXED INCOME PRESENTATION - March 2020 - Merlin Properties
DISCLAIMER

This presentation has been prepared by          Certain statements in this document            presentation in other jurisdictions may        RELIED ON IN CONNECTION WITH ANY
MERLÍN Properties, SOCIMI, S.A. (the            regarding the market and competitive           also be restricted by law and persons          CONTRACT OR COMMITMENT TO SELL
Company) for informational use only.            position data may be based on the              into whose possession this presentation        OR PURCHASE SHARES. ANY DECISION
                                                internal analyses of the Company,              comes should inform themselves about           TO SELL OR PURCHASE SHARES IN ANY
The information contained in this
                                                which involve certain assumptions and          and observe any such restrictions. In          OFFERING SHOULD BE MADE SOLELY
presentation does not purport to be
                                                estimates. These internal analyses may         particular, any offer that might result from   ON THE BASIS OF PUBLICLY AVAILABLE
comprehensive or to contain all the
                                                have not been verified by any independent      the transaction herein escribed will not be    INFORMATION.
information that a prospective purchaser
                                                sources and there can be no assurance          made, directly or indirectly, in the United
of securities of the Company may desire                                                                                                       This presentation may include forward-
                                                that the assumptions or estimates are          States of America, or by use of mails, or by
or require in deciding whether or not to                                                                                                      looking statements. These forward-
                                                accurate. Additionally, certain information    any means or instrumentality (including,
purchase such securities, and has not                                                                                                         looking statements involve known and
                                                in this presentation may be based on           without limitation, facsimile transmission,
been verified by the Company or any                                                                                                           unknown risks, uncertainties and other
                                                management accounts and estimates of           telephone and internet) of interstate or
other person. The information contained                                                                                                       factors, which may cause such actual
                                                the Company and may have not been              foreign commerce of, or any facilities of
in this document is subject to change                                                                                                         results, performance or achievements, or
                                                audited or reviewed by the Company’s           any national securities exchange of, the
without notice. Neither the Company                                                                                                           industry results, to be materially different
                                                auditors, whereas the information              United States, Canada, Australia or Japan.
nor any of affiliates, advisors or agents                                                                                                     from those expressed or implied by
                                                on certain competitors contained               The securities of the Company have not
makes any representation or warranty,                                                                                                         these forward-looking statements. These
                                                herein is based on publicly available          been and, should there be an offering, will
express or implied, as to the accuracy                                                                                                        forward-looking statements are based
                                                information which has not been verified        not be registered under the U.S. Securities
or completeness of any information                                                                                                            on numerous assumptions regarding the
                                                by the Company. Accordingly, recipients        Act of 1933, as amended (the Securities
contained or referred to in this document.                                                                                                    present and future business strategies
                                                should not place undue reliance on this        Act) and, subject to certain exceptions,
Each of the Company and its employees,                                                                                                        of the Company and the environment in
                                                information.                                   may not be offered or sold in the United
officers, directors, advisors, agents or                                                                                                      which they expect to operate in the future.
                                                                                               States. The securities of the Company have
affiliates expressly disclaims any and all      This information is provided to the                                                           Forward-looking statements speak only
                                                                                               not been and, should there be an offering,
liabilities whatsoever (in negligence or        recipients for informational purposes                                                         as of the date of this presentation and the
                                                                                               will not be registered under the applicable
otherwise, whether direct or indirect, in       only and recipients must undertake their                                                      Company expressly disclaim any obligation
                                                                                               securities laws of any state or jurisdiction
contract, tort or otherwise) for any loss       own investigation of the Company. The                                                         or undertaking to release any update
                                                                                               of Canada or Japan and, subject to certain
howsoever arising from any use of this          information providing herein is not to                                                        of, or revisions to, any forward-looking
                                                                                               exceptions, may not be offered or sold
presentation, the information contained         be relied upon in substitution for the                                                        statements in this presentation, any
                                                                                               within Canada or Japan or to or for the
or referred to therein, any errors therein or   recipient’s own exercise of independent                                                       change in their expectations or any change
                                                                                               benefit of any national, resident or citizen
omissions therefrom or otherwise arising        judgment with regard to the operations,                                                       in events, conditions or circumstances on
                                                                                               of Canada or Japan.
in connection with this presentation.           financial condition and prospects of the                                                      which these forward-looking statements
Neither the Company, nor any of its             Company.                                       THIS PRESENTATION DOES NOT                     are based.
affiliates, advisors or agents undertakes                                                      CONSTITUTE OR FORM PART OF ANY
                                                Neither this presentation nor any copy                                                        In reviewing this presentation, the
any obligation to provide the recipients                                                       OFFER FOR SALE OR SOLICITATION OF
                                                of it shall be taken, transmitted into,                                                       recipient is agreeing to, and accepting, the
with access to additional information or                                                       ANY OFFER TO BUY ANY SECURITIES IN
                                                disclosed, diffused, send, published or                                                       foregoing restrictions and limitations.
to update this document or to correct any                                                      THE UNITED STATES OR IN ANY OTHER
inaccuracies in the information contained       distributed in the United States, Canada,      JURISDICTION, NOR SHALL IT OR ANY
or referred to therein.                         Australia or Japan. The distribution of this   PART OF IT FORM THE BASIS OF OR BE

                                                                                                                                                                                       ı2ı
FIXED INCOME PRESENTATION - March 2020 - Merlin Properties
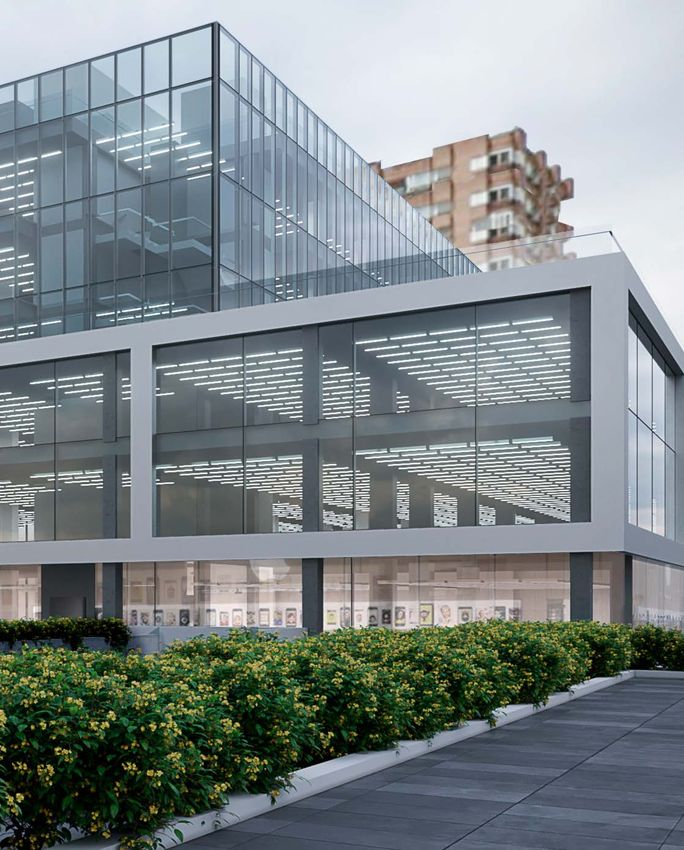
Contents

Strategy
Positioning
Value Creation
Capital Structure
Sustainability
FIXED INCOME PRESENTATION - March 2020 - Merlin Properties
History    |    

          SIX INTENSE YEARS TO POSITION MERLIN AS THE LEADING SPANISH REIT
          AND AMONG THE TOP 10 EUROPEAN REITS

          2014                            2015                                         2016                                  2017                           2018                        2019              2020
Acquisition                                                                                             Sale                                                                                Sale of 26
    of Tree                                                                                             of hotel                                                                            non-core
  portfolio                                     Acquisition                              Acquisition    portfolio                   Investment in                               Acquisition office       Contribution
(888 BBVA     Acquisition                       of 47 assets          Acquisition of     of 40          and 10      Acquisition     refurbishment   Acquisition Sale of Testa   of 3 assets building     of 3 non-core
 branches)    of 12 assets                      and ZAL Port          Metrovacesa        assets         assets      of 11 assets    & development   of 6 assets & non-core      in Portugal & other      retail assets
   € 740M     € 544M                            € 331M                € 1.7bn            € 812M         € 761M      € 388M          € 109M          € 570M      € 594M          € 125M      € 281M       € 173m

    July                                                               June                             Dec.                                                                                 Nov.         Feb
     2014      2014                              2015                  2016               2016          2016        2017             2017           2018         2018           2019         2019         2020

June            Dec.          May        Dec.           Dec.          Feb.             2016      Oct.                              2017              Feb.       Dec.             Apr.       Nov.         Jan.
2014            2014          & July     2015           2015          2016                       2016                                                2018       2018             2019       2019         2020
                              2015

€ 1.3bn       Refinancing    € 1.7bn    Inclusion       Refinancing   BBB          2 bond        Baa 2                         2 bond               BBB        Refinancing      ESG       1 bond         Listing in
IPO           of Tree debt   Capital    in IBEX 35      of Testa      S&P          issuances     Moody’s                       issuances            positive   of Tree debt     Indexed issuance         Euronext
              € 940M         increase   Index           debt          rating       € 1.7bn       rating                        € 900M               outlook    € 717m           financing € 0.5bn        Lisbon
                                                        € 1.7bn                                                                                     S&P                         € 1.55bn
                                                                                                                                                    rating

                                                                                                                                                                                                            ı4ı
FIXED INCOME PRESENTATION - March 2020 - Merlin Properties
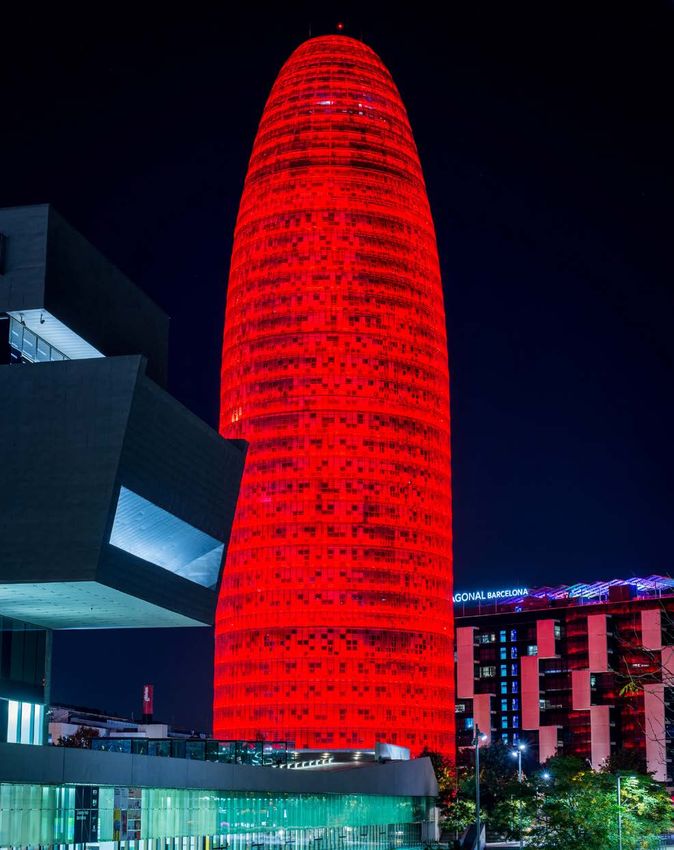
MERLIN today    |    Overview

LARGEST AND MOST DIVERSIFIED SPANISH REIT

   Fast facts                                                                Portfolio breakdown                                                           Capital structure

       932                                                                                    6%                                                                   > € 6.0bn
       ASSETS       (1)                                                             10%                                                                            MARKET CAP

       € 12.8bn                                                                                                                                      € 7.3bn / € 15.60
                                                                            15%                                        50%
       GAV                                                                                by GAV          (2)                                          EPRA NAV PER SHARE

       € 509m                                                                                                                                                          40.6%
       GRI                                                                         19%                                                                                      LTV

       4.3m sqm                                                                               3%
                                                                                                                                                                    6.4 years
       GLA OWNED             (1)
                                                                                    11%
                                                                                                                                                                   AV. MATURITY

       95%                                                                                                                                                             2.09%
       OCCUPANCY RATE                                                       17%                                        46%                                     AV. INTEREST RATE
                                                                                           by GRI(1)
       4.5%                                                                                                                                                               BBB
       GROSS YIELD                                                                                                                                         STANDARD & POOR’S
                                                                                   23%

       5.6 years                                                         Offices      Shopping Centers          Net leases
                                                                                                                                                                         Baa2
       WAULT                                                                                                                                                           MOODY’S
                                                                                       Logistics     Other(3)

Company FY19 (Post disposal of 3 secondary retail assets)
(1)
    Fully consolidated excluding assets where MERLIN holds a minority stake. Plaza de los Cubos has been reclassified as offices (formerly 21 retail units)
(2)
    GAV of land under development and NAV of equity method included in its respective category (offices, shopping centers and logistics). Excluding DCN loan
(3)
    Includes 3 hotels, non-core land and miscellaneous
                                                                                                                                                                                   ı5ı
FIXED INCOME PRESENTATION - March 2020 - Merlin Properties
Strategy
FIXED INCOME PRESENTATION - March 2020 - Merlin Properties
Strategy    |    Strategy pillars

 A CLEARLY DEFINED STRATEGY INSPIRED BY THE BEST REIT PRACTICES

           Office                                                                  Shopping Centers

         45       %
  Breadth of prime space                           Core & Core Plus
                                                                                         20       %
                                                                                     Urban or Dominant
Madrid, Barcelona and Lisbon                       Spain & Portugal                    National scale

                                           Best                       Investment
                                     governance                       grade
                                       practices                      capital
                                                                      structure

                                             One of              Dividend
                                         the world’s             policy:
                                          most cost              80% of
                                            efficient            AFFO
             Logistics                        REIT’s                                    Net leases

             20        %
        National footprint
                                                                                          15    %
                                                                                   High triple net cash flow
 “One-stop shop” solution for 3PL                                                     Inflation multiplier

                                                                                                               ı7ı
FIXED INCOME PRESENTATION - March 2020 - Merlin Properties
Strategy    |    Asset categories evolution (by GRI)(1)

LOGISTICS, THE FASTEST GROWING ASSET CATEGORY SINCE 2014

                                2014                                                                    2018                                              2019 PF(2)
                                                                                                                                                                     (1)

                                5  %
                                                                                                       3 %                                                      2
                                                                                                                                                                %
                  12%                                                Hoteles
                                                                                               10%                            Hoteles
                                                                                                                                                        17%
                                                                     Residencial en alquiler                                  Residencial en alquiler

          14%                                         69%            Otros
                                                                                 17%                                    46%   Otros
                                                                                                                                          15%                               45%
                                                                     Logístico                                                Logístico

                                                                      Oficinas                                                High Street Retail

                                                                      Centros comerciales                                      Centros comerciales

                                                                     High Street Retail                                        Oficinas
                                                                                          24    %
                                                                                                                                                        21%
                                                                                                                                                          (1)

                               Offices                         Net leases                            Shopping centers         Logistics                             Other

(1)
      Other includes hotels, non core land and miscellaneous
(2)
      Pro-forma to include the value creation plans
                                                                                                                                                                                  ı8ı
FIXED INCOME PRESENTATION - March 2020 - Merlin Properties
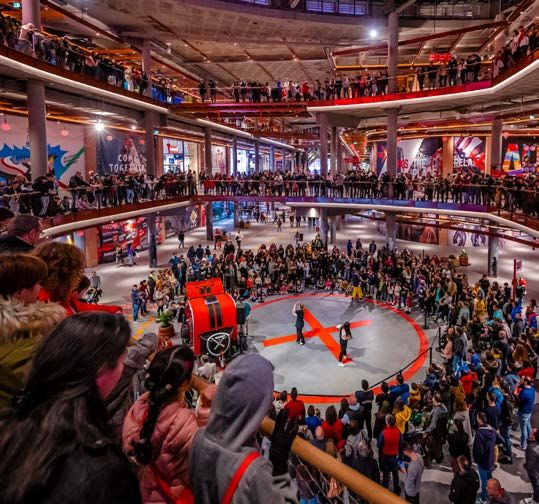
Strategy    |    Exposure to Portugal

PORTUGAL HAS GAINED RELATIVE WEIGHT IN MERLIN’S PORTFOLIO
 Offices                                                                                             Shopping centers Logistics

                             NT
                          ME
                       ISH
                     RB
                  FU
                RE
            R
         DE
       UN

        Monumental                Marqués Pombal 3         Lisboa Expo   Torre Lisboa    Nestlé HQ         Almada          Lisbon Park
        22,387 sqm                   12,460 sqm             6,740 sqm     13,715 sqm    12,260 sqm       60,098 sqm       224,864 sqm

       Central Office                Torre Zen                 Art           TFM
        10,310 sqm                  10,207 sqm             22,150 sqm     7,837 sqm

   Key metrics

   GRI (€m)                                                                  20.6(1)                       24.2
   % GRI / MERLIN asset class portfolio                                       8.7%                         19.5%
   GLA (sqm)                                                                118,066                       60,098
   % GLA / MRL asset class portfolio                                          8.9%                         11.0%
   Occupancy rate (operating)                                                100%                         99.8%

                                                            GRI (€m)         % GRI / MERLIN portfolio        Occupancy rate
                     Exposure
                     to Portugal                             44.7                       8.8%                       100%
                                                                                                                                         ı9ı
 (1)
       Monumental has been vacated for the refurbishment
FIXED INCOME PRESENTATION - March 2020 - Merlin Properties
Positioning
Positioning    |    Fast facts

#1 REIT ACROSS ALL ASSET CATEGORIES WHERE MERLIN OPERATES
                                                                                                                             FULLY CONSOLIDATED(1)

                                                                                                                             124 ASSETS(2)
                                                   #1
                                                               •F  lexibility to offer multitenant
                                                                  or headquarter buildings
                                                                                                                             1,319 K SQM
                                                               • Capacity to adapt to the needs
                                        Offices                   of the tenant
                                                                                                                             € 6.2 BN GAV
                                                                                                                             € 237 M GRI
                                                                                                                                                            MINORITY STAKES(3)

                                                                                                                                                            TRES AGUAS 50%
                                                   #1           •M  ainly urban footprint in high GDP/
                                                                   capita areas in Spain
                                                                                                                             14 ASSETS
                                                                                                                             461 K SQM
                                                                                                                                                            1 ASSET
                                                                                                                                                            68 K SQM
                                 Shopping                       • Reference landlord for top retailers                      € 2.4 BN GAV
                                   Centers                      • Critical mass with retail brands                          € 116 M GRI
                                                                                                                                                            € 9 M GRI

                                                                • “ One-stop-shop” solution for
                                                                                                                             Existing        WIP            ZAL PORT 48.5%

                                                   #1               logistics operators wishing to
                                                                    operate across Spain
                                                                • Big footprint to match the rapid
                                                                                                                             47 ASSETS
                                                                                                                             1,160 K SQM
                                                                                                                                             12 PROJECTS
                                                                                                                                             1,002 K SQM
                                                                                                                                                            50 ASSETS
                                                                                                                                                            469 K SQM
                                   Logistics                        development of 3PL activity
                                                                                                                             € 0.9 BN GAV    € 0.6 BN GAV   (+258 SQM WIP)
                                                                                                                             € 55 M GRI      € 45 M GRI     € 46 M GRI(4)
                                                                                                                                                            (+€ 22 M GRI WIP)(4)

                                                   #1          •E
                                                                 xcellent conditions of BBVA lease
                                                                agreement: triple net lease with
                                                                                                                             715 ASSETS
                                                                                                                             363 K SQM
                               Net leases                       1.5x HICP annual uplift
                                                                                                                             € 1.9 BN GAV
                                                                                                                             € 87 M GRII

(1)
     Y19 reported figures + Plaza Cataluña + Contribution of 3 secondary retail assets to Silicius
    F
(2)
      Plaza de los Cubos has been reclassified as offices (formerly 21 retail units). Including plaza cataluña 9 acquired in January 2020
(3)
    Data for Minority Stakes is reported for 100% of the subsidiary
(4)
    Pre canon                                                                                                                                                                ı 11 ı
Positioning    |    Offices overview

 PRIME SPACES IN BOTH CBD AND NBA OFFERING A WIDE VARIETY OF SOLUTIONS TO CLIENTS

Fast facts                                         Breakdown
Reversion in MVC assets
                                                     By geography         By location                 By product
                                                                          Otros
# ASSETS                       124                                        Lisbon
                                                                          Barcelona
GLA (sqm)                    1,319 k                    By GAV             Madrid By    GAV               By GAV
GAV (€ M)                    6,161(1)
GRI (€ M)                      237
                                                       • Madrid 75%               • Prime + CBD 51%     • Multi tenant 68%
GROSS YIELD                    4.1%                    • Barcelona 15%
                                                       • Lisbon 9%
                                                                                  • NBA 40%
                                                                                  • Periphery 9%
                                                                                                        • Single tenant 32%
                                                       • Other Spain 1%
OCCUPANCY                      93%
                                     971K MAD
                                     208K BCN
                                     118K LISBON

                Top 10
               tenants

    Excluding office land for development
(1) 

                                                                                                                              ı 12 ı
Positioning    |    Shopping Centers overview

 URBAN AND DOMINANT ASSETS OFFERING NATIONAL SCALE IN HIGH GDP/CAPITA AREAS

Fast facts                                                              Breakdown(5)
Reversion in MVC assets
                               Fully              Tres
                              Consol.            Aguas (1)                   By geography                                     By type             By size(2)

# ASSETS                       14    1                                                                            Other

                             461 k 68 k
                                                                                                                  Andalusia
GLA (sqm)
                                                                                                                  Valencia

GRI (€ M)                     116    9                                                By GAV                      Galicia          By GAV             By GAV
                                                                                                                  Catalonia

GAV (€ M)                   2,367(3)                                                                              Madrid

                             4.9%
                                                                                                                  Lisbon
GROSS YIELD                                                                 •Madrid 23%       •Valencia 10%                      • Urban 58%         • Extra-large 34%
                                                                            • Lisbon 21%      • Andalusia 7%                     • Dominant 37%      • Large 32%
OCCUPANCY                    93%(4)                                         • Catalonia 11%   • Other Spain 15%                  • Secondary 5%      • Medium 19%
                                                                            • Galicia 13%                                                            • Small 15%
ANNUAL
FOOTFALL               103 m pax

               Top 10
              tenants
(1)
    100% of Tres Aguas of which MERLIN owns 50%
(2)
    As per the definition of AECC (Spanish Shopping Center Association)
(3)
    Including WIPs at book value
(4)
     Excluding X-Madrid, Monumental and retail units under development                                                                                                   ı 13 ı
(5)
    Portfolio in operations. Excluding the assets contributed to Silicius
Positioning    |    Logistics overview

 NATIONAL FOOTPRINT IN MAIN LOGISTICS HUBS

 Fast facts                                                                                         Breakdown
 Reversion in MVC assets
                                Existing                                 WIP                             By reach                                               By
                                                                                                                                                        OtherOther
                                                                                                                                                             Spain    tenant
                                                                                                                                                                   Spain             type
                 Consolidated           ZAL Port(1)       Consolidated           ZAL Port(1)                                                      OtherBasque  country
                                                                                                                                                        Spain Basque
                                                                                                                                                                  Other Spain
                                                                                                                                                                     country
                                                                                                                                                  BasqueSeville
                                                                                                                                                          country Basque country
# ASSETS                  47                 44                   12                  6                                                                       Seville
                                                                                                                                                  Seville          Seville
                                                                                                                                                        Barcelona
                                                                                                                                                              Barcelona
GLA (Sqm)             1,160 k             469 k               1,002 k            258 k                               By GAV                       Barcelona        BarcelonaBy
                                                                                                                                                        MadridMadrid
                                                                                                                                                                                   GAV
                                  +2.9m sqm under management                                                                                       Madrid        Madrid

GAV (€ m)                 939                                    553
                                                                          • Madrid
                                                                              •• Madrid
                                                                                      57%57%
                                                                                  Madrid    57%• Madrid 57%      • National
                                                                                                                    National    • National
                                                                                                                              39%
                                                                                                                       • National
                                                                                                                            39%    39% 39%            • 3PL•mono-client
                                                                                                                                                                      • 3PL
                                                                                                                                                              3PL•mono-client
                                                                                                                                                                     3PL  40%      40% 40%
                                                                                                                                                                             mono-client
                                                                                                                                                                           mono-client     40%
GRI (€ m)                   55               46(2)              43(3)               22
                                                                          • Catalonia
                                                                              •• Catalonia
                                                                                          (3)
                                                                                         25%   •
                                                                                             25%
                                                                                  Catalonia 25%  Catalonia 25%   •  Ports  32%  •
                                                                                                                       • Ports 32%
                                                                                                                    Ports 32%     Ports 32%           • 3PL • 3PL     •
                                                                                                                                                                    multi-client  39%
                                                                                                                                                                  • 3PL multi-client 39%
                                                                                                                                                            multi-client 39%
                                                                                                                                                                         3PL multi-client 39%

                                                                              ••• Basque
                                                                          • Sevilla  6% 6%     • Sevilla 6%      •• Regional    • Regional            • End•user      • End
                                                                                  Sevilla                                    25%
                                                                                                                               25%         25%                   21%         user 21%
                                                                                  Sevilla  6%                       Regional
                                                                                                                       •  Regional  25%                       End    End21%
                                                                                                                                                                  •user    user 21%
                                                                                               •   5% Country 5%• Production related
                                                                                                                                •
GROSS YIELD             5.8%                                    7.8%      • Basque
                                                                              •• Other
                                                                                           Country
                                                                                      Country
                                                                                  Basque
                                                                                                 Basque
                                                                                                 5%
                                                                                               • Other5%
                                                                                            Country
                                                                                         Spain 7%       Spain 7%
                                                                                                                 • Production         4%
                                                                                                                                  Production
                                                                                                                                 related
                                                                                                                       • Production   related
                                                                                                                                             related 4%
                                                                                                                                         4% 4%
                                                                          • Other   Spain   7%
                                                                              • Other Spain 7%                                By geography
OCCUPANCY               98%                  98%                 n.a.            100%                                                                                                                     Other Spain
                                                                                                                                                                                                          Basque National
                                                                                                                                                                                                                 country 39%
                                                                                                                                                                         • Madrid 57%                         •
                                                                                                                                                                         • Catalonia 25%                  Seville
                                                                                                                                                                                                               • Ports 32%
                                                                                                                                          By GAV                         • Sevilla 6%                         • Regional 25%
                                                                                                                                                                                                          Barcelona
                                                                                                                                                                         • Basque Country 5%                 • Production relat
                                                                                                                                                                                                           Madrid
                                                                                                                                                                         • Other Spain 7%

                                                                                                                                        • Madrid 57%                            • National 39%                    • 3PL mono-client
                                                                                                                                        • Catalonia 25%                         • Ports 32%                       • 3PL multi-client
                                                                                                                                        • Sevilla 6%                            • Regional 25%                    • End user 21%
                                                                                                                                        • Basque Country 5%                     • Production related 4%
                Top 10                                                                                                                  • Other Spain 7%

               tenants
 (1)
     Figures reported for 100% of ZAL Port
 (2)
     Gross annual rent as of 31/12/19, pre ground lease expenses
 (3)
     Total expected gross rents. GAV includes acquisition cost plus estimated Capex                                                                                                                               ı 14 ı
Positioning    |    GAV summary PF FY19(1)

   Gross yield                       4.1%                           4.9%                 4.9%                5.8%               -            4.5%
                                                                                                                                                                                                    12,751
                                                                                                                                         12,094

                                     6,161

          GAV

                                                                                                                                                                             TOTAL with minority stakes
    (€ million)
                                                 Shopping centers

                                                                    2,367                1,873

                                                                                                                                                     Minority stakes
                                                                            Net leases

                                                                                                 Logistics

                                                                                                                    Other(2)
                           Offices

                                                                                                                                     TOTAL
                                                                                                             939               754
                                                                                                                                                                       657

    €/sqm AG                         4,846                          5,198                5,167               809                             2,599

Source: Company
(1)
    PF post desconsolidation of 3 secondary retail assets
(2)
    Other includes logistics WIP, office WIP, land for development, non-core land and miscellaneous
                                                                                                                                                                                                             ı 15 ı
Positioning    |    Occupancy and WAULT PF FY19(1)

                                                                                      100%
                                                              95%         98%
                           93%
                                                                                                 95%
                                                                                                 AVERAGE
                                                                                                 OCCUPANCY

                                                                                      18.4

                                                                                                 5.6 years
                           3.0                                            4.0                    AVERAGE
                                                                                                 WAULT
                                                              2.4

                        Offices                      Shopping centers   Logistics   Net leases

(1)
      PF post desconsolidation of 3 secondary retail assets
                                                                                                             ı 16 ı
Positioning    |    Trading update FY19 Reported

VERY GOOD PERFORMANCE AND PROSPECTS ACROSS THE BOARD

                                                      Rent LfL                                sqm         Release
                                                                                                                      #contracts
                                                       YoY(1)                              contracted     spread(3)

        Office                                          +7.3%                                   346,548    +7.2%         180

        Shopping Centres                                +3.1%                               78,306(2)     +4.2%          139

        Net leases                                      +1.2%                                     -          -            -

        Logistics                                      +3.6%                                    258,638   +7.6%           6

        Other                                          (1.8%)                                     -          -            -

        TOTAL                                          +4.5%                                    683,492                 325

(1)
     ortfolio in operation for the FY19 (€ 463.7m of GRI) and for the FY18 (€ 443.6m of GRI)
    P
(2)
    Excluding X-Madrid
(3)
     LTM Change in rent in renewals and relets                                                                                    ı 17 ı
Value
creation
Value creation    |    Growth Plans 2018-2022

                         Offices                                                                                           Shopping Centers
   LANDMARK I PLAN                                                                                                        FLAGSHIP PLAN
    Upscaling refurbishments                                                                                              Converting our shopping centers
to create “prime within the prime”                                                           Organic                     in the flagship store of online retail
                                                                                             growth

                    SELECTED                               € 536m                                            € 220m           DEVELOPMENT OF “X”
                  DEVELOPMENTS                                                                                               A BRAND NEW CONCEPT
                                                                  Designed                                  Internally
                                                               by signature                                 funded
                                                                 architects

                                                                                        Logistics include
                                                                                       forward purchase,
                       Logistics                                                       spec development                          Net leases
 BEST II PLAN € 328m                                                                    and built to suit                          TREE
                                                                                                                         Lever on inflation growth
BEST III PLAN € 317m(1)
Development of the best footprint
      in the Iberian market
 (1)
       Including € 154m investments post 2022 (San Fernando III, Lisbon Park and Valencia)
                                                                                                                                                          ı 19 ı
Value creation    |    Landmark I - Update

                                                                          0%

                                                                                         %

                                                                                                        %
                                              ED
                              ED

                                                                                                                            %
                                                                                       95

                                                                                                      82
                                                         0%

                                                                                                                          28
                                                                        10
                                          ER
                           ER

                                                                                                  T
                                                                                    T
                                                       10

                                                                      T

                                                                                                                      T
                                                                                                 LE
                                                                                  LE
                                         IV
                         IV

                                                                   LE

                                                                                                                    LE
                                                       T
                                     EL

                                                                                               E-
                                                                                E-
                      EL

                                                    LE

                                                                 E-

                                                                                                                  E-
                                                                                             PR
                                                                               PR
                                     D
                     D

                                                                PR

                                                                                                                PR
                       Torre           Torre       Marqués de   Castellana     Diagonal                        Plaza Ruiz          Adequa    Adequa
                                                                                             Monumental
                     Charmartín       Glòries       Pombal 3       85            605                            Picasso              4         7

     GLA (sqm)        18,295          37,614        12,460       15,254         13,244        22,387              31,576           15,793    32,109

     Acquisition
     (€m)                31.2            142.0             -          -              -             -                  -              28.2     64.5

     Capex (€m)          38.0            26.7          1.6           32.1           8.7        34.8                50.3              16.8     61.5

     Rent   (€m)         4.3             11.8          0.2           2.6            1.3           3.3                6.3              3.6     8.3

     Yield on Cost       6.2%            7.0%        9.4%            8.1%       15.5%          9.4%               12.6%              7.9%     6.6%

     Delivery            2019            2019        2020        2020           2020           2021               2022              2022     2022

Total Acquisition               Total Capex           Total investment          Pending Capex                 Additional Rents              Yield on Cost
€ 266.0m                   € 270.5m                   € 536.4m                  € 175.5m                         € 41.7m                      7.8%
                                                                                                            Already captured     To come

                                                                                                              € 4.5m            € 37.2m                ı 20 ı
Value creation    |    Landmark I - 2019 Deliveries

Torre Glòries                                         Torre Chamartín

Returns                       Tenants                 Returns                      Tenants
• Acquisition € 142.0m        • 100% Let             • Acquisition € 31.2m        • 100% Let
• Capex € 26.7m                                       • Capex € 38.0m
• Total investment € 168.7m                           • Total investment € 69.2m
• ERV € 11.8m                                         • ERV € 4.3m
• Yield on cost 7.0%                                 • Yield on cost 6.2%
   (vs 6.5% underwriting)                                (vs 6.2% underwriting)
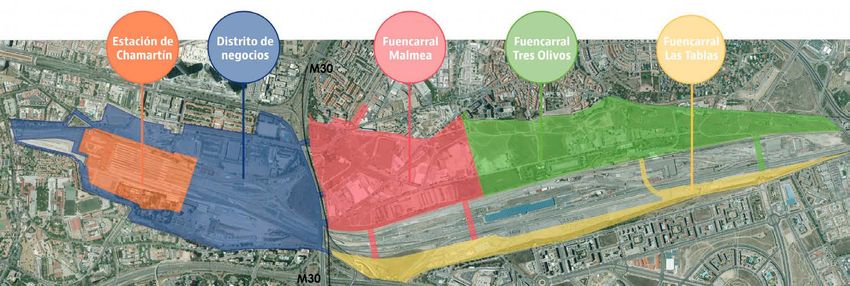
                                                                                                 ı 21 ı
Value creation    |    Madrid Nuevo Norte

ACQUISITION OF A STRATEGIC STAKE IN DISTRITO CASTELLANA NORTE, THE FUTURE OF MADRID PRIME CBD

                  Phase I       Phase II           Phase IV a
                                                                      Phase IV b                  Phase III
                  Central       Business           Fuencarral
                                                                      Tres Olivos                Las Tablas
                  Station       District            Malmea

  Madrid Nuevo Norte (MNN)

              Offices       1,220k sqm                                   Offices     392k sqm
              Residential     260k sqm                                               791k sqm
                                                                         Residential	
                                           Total Madrid Nuevo Norte
       Total buildability   2,662k sqm                                Total residential buildability    1,051k sqm
                                                                      Total office buildability         1,611k sqm

The Project                                                                 Distrito Castellana Norte (DCN)

• Largest development in Europe with a total investment of € 6bn           DCN is the largest owner of the
• Future Prime CBD area in Madrid with second-to-none fast                 development, with a total buildability
   connections by air or train                                              of 1.2m sqm, 81% of which has office
                                                                            use and 19% residential
• Comprises 4 independent phases, one of which could be divided
  in two sub-projects                                                       14.46% MERLIN Properties stake           ı 22 ı
Value creation    |    Madrid Nuevo Norte

THE MOST AMBITIOUS REAL ESTATE SCHEME IN EUROPE

                                                  ı 23 ı
Value creation    |    Flagship - update

                                                                                       ED
                                          ED

                                                                   ED

                                                                                                       ED
                                                                                   ER
                                        ER

                                                               ER

                                                                                                    ER
                                                                                  IV
                                     IV

                                                              IV

                                                                                                  IV
                                                                              EL
                                   EL

                                                         EL

                                                                                               EL
                                                                              D
                                 D

                                                        D

                                                                                              D
                                                     Arturo Soria
                                  Larios                                    X-Madrid        Tres Aguas(1)      El Saler                   Porto Pi               Callao 5
                                                        Plaza

 GLA (sqm)                        41,460                  7,054               47,170           67,690            47,471                   58,779                  11,629
 GLA MERLIN (sqm)                 37,957                  6,069               47,170           33,845            28,861                   32,963                  11,629

                              Works: 27.5                                  Works: 46.4                      Works: 24.0             Works: 26.6
 Capex (€m)                                                   5.4                                 12.1(1)                                                         20.5
                             Ad. GLA: 19.9                               Investment: 10.5                   Ad. GLA: 12.0           Ad. GLA: 15.2

 Rent       (€m)                     3.1                      0.6                 5.2             1.4(1)            1.9                     1.7                    3.9

 Yield on Cost                     6.6%                       11.3%            9.1%               11.2%           5.2%                     4.2%                   18.9%

 Delivery                          2019                     2019               2019               2019           2020                      2021                   2021

  ∆ GLA + X-Mad inv.                           Total Capex              Total investment      Pending Capex            Additional Rents                   Yield on Cost
         € 57.5m                             € 162.6m                   € 220.1m              € 86.0m                      € 17.7m                              8.1%
(1)
      Only including MRL 50%                                                                                Already captured    To come      Equity method(2)
(2)
      Equity method investments are not included in the GRI                                                   € 4.0m           € 12.3m         € 1.4m                      ı 24 ı
Value creation    |    Flagship value creation: X-Madrid achieving high pre-leasing rate

X-MADRID: A NEW CONCEPT RECENTLY LAUNCHED

Comercialization status                We have turned the mix upside down: 70% experience / 30% retail

             95%
 commercialized as of February
                                         Climbing         Harley          Bowling         Spanish        > 1,500
                                        Spanish cup      gathering      Tournament     freestyle cup     surfers
      Tenants demanding
      more space
                                                  > 1.2 million visitors since opening (less than 2 months)
                                                                                                                   ı 25 ı
Shopping Centers    |    Flagship - Larios and Tres Aguas

   Larios                                                                           Tres Aguas

• Total investment 47.3m(1) • Top-of-mind mall for                                • Total investment € 12.1m(2) • Occupancy gain of + 900
• ERV € 3.1m                   retailers in Malaga                                 • ERV € 1.4m(3)                  bps after the refurbishment
• Yield on cost 6.6%       • Full occupancy                                      • Yield on cost 11.2%        • After reform, the center
   (vs 6.4% underwriting)   • After reform the center                                (vs 15.1% underwriting)       has achieved the highest
                               is achieving the highest                                                             sales in 5 years
                               footfall in 6 years

•N
  ew tenants(3)         • Renewals                                               • Anchor tenants            • New tenants
 21 contracts 15,518 sqm   11 contracts 2,885 sqm                                     are upscaling and
                                                                                      upgrading their units

                                                                                                                                           ı 26 ı
    € 19.9m GLA + € 27.5m Capex (2) Only
(1)                                
                                         including MRL 50% (3) Or
                                                               
                                                                  upscaled units
Value creation    |    Best II - Update

                                                                                                                                                              0%
                                                                     %

                                                                                                     %
                                                                   42

                                                                                                   67
                                     0%

                                                  0%

                                                                                                                                                            10
                                                                                                T
                                                                 T
                                   10

                                                10

                                                                                                                                                          T
                                                                                              LE
                                                              LE

                                                                                                                                                       LE
                                T

                                                T

                                                                                            E-
                                                            E-
                             LE

                                             LE

                                                                                                                                                     E-
                                                                                          PR
                                                           PR

                                                                                                                                                    PR
                                                                                                                                  Guadalajara                      Guadalajara
                            Madrid        Guadalajara      Toledo        Guadalajara        Madrid        Guadalajara                              Guadalajara
                                                                                                                                   Cabanillas                       Cabanillas
                          Pinto II B(1)   Cabanillas III   Seseña        Cabanillas F   San Fernando II   Azuqueca III                             Azuqueca II
                                                                                                                                Park I extension                     Park II

 GLA (sqm)                  29,473           21,879        28,731          20,723          34,224           51,000                 92,994           98,757          210,678

 Capex (€m)                   13.7            11.8          15.5            10.8               21.7          30.1                    56.0             54.7           114.2

 ERV (€m)                      1.2            0.9               1.2          0.9               1.9            2.3                     3.8                4.4          9.2

 ERV YoC                     8.6%             7.8%          7.7%            7.9%            8.9%             7.7%                    6.8%             8.1%            8.1%

 Delivery                    2019            2019          2019             2019            2020            2020                2020/2021            2021            2021
                                                                                                                    Secured    € 8.4m

                GLA                          Total investment                 Pending Capex                  Additional Rents                             Yield on Cost
      588k sqm                               € 328.4m                        € 193.4m                           € 25.9m                                        7.9%
                                                                                                            Already captured        To come
(1)
      2nd phase of Pinto II only
                                                                                                              € 1.2m              € 24.7m                                    ı 27 ı
Value creation    |    Best II

BEST II FOCUSED ON THE 2 MAIN LOGISTICS CORRIDORS OF MADRID

   +588K sqm                                                        € 26m
   GLA                                                                ERV

                                           Madrid

   € 328m                                                              7.9%
   Investment                                                 Yield on Cost

                                                                          ı 28 ı
Value creation    |    Best III

LAUNCH OF BEST III TO EXPAND FOOTPRINT TO OTHER AREAS OF THE IBERIAN PENINSULA

                                                                     0%                  0%
                                              0%                   10                  10
                                            10                ET                  ET
                                       T                    L                   L
                                     LE                   E-                  E-
                                                        PR                  PR

                                  Valencia             Zaragoza              Sevilla(2)         Lisbon                     Madrid
                                                                                                                                              Valencia
                                  Ribarroja             Plaza II             ZAL WIP             Park                  San Fernando III

 GLA (sqm)                         34,992                11,421              42,632            224,864                       98,942           96,572

 Capex (€m)                          26.3                    7.1                 24.4           147.6                         54.9             56.2

 ERV (€m)                             1.9                    0.5                 2.0             10.5                             5.1           4.4

 ERV YoC                             7.2%                7.2%                    8.4%            7.1%                        9.3%              7.8%

 Delivery                           2019                2020               2019/2020          2020/2023                 2022/2023           2022/2023

                                                                                                         Secured    € 4.4m

            GLA                             Total investment              Pending Capex           Additional Rents                        Yield on Cost
      509k sqm                               € 317m      (1)
                                                                          € 261.2m                  € 24.5m                                 7.7%
                                                                                                 Already captured       To come
(1)
    € 163m total investment until 2022                                                             € 1.0m              € 23.5m                            ı 29 ı
(2)
    8.798 sqm already delivered to Amazon
Value creation    |    Best III

LAUNCH OF BEST III TO EXPAND FOOTPRINT TO OTHER AREAS OF THE IBERIAN PENINSULA

          +509K sqm                                                               € 24m
          GLA                                             Basque Country            ERV

                                                                 Zaragoza

                                                     Madrid

                                                                    Valencia
                                  Lisbon
          € 317m(1)                                                                  7.7%
          Investment                                                        Yield on Cost
                                           Seville

(1)
      € 163m until 2022
                                                                                        ı 30 ı
Value creation    |    Sources & uses

SELF-FUNDING CAPEX PROGRAM

Cash from further non-core disposals to be used mainly for DCN and debt repayment

                                                                       1,401
                                                     645
(€m)

                                  220

                                                                                         (685)
               536
                                                                                                                                  191 receivable
                                                                                                                                   (secondary
                                                                                                                                 retail and Tree)

                                                                                                 (328)
                                                                                                                               206
                                                                                                                                                        +€ 191m
                                                                                                                 (182)                               until completion
                                                                                                                                             49      of infrastructure
                                                                                                                                                     and urbanization

            Landmark            Flagship           Best II         Total Capex Capex invested Cash available    Cash flow      Non-core    DCN          > 2023
                                                  & Best III(1)     2018-2022   as of Dec-19   as of Dec-19     retention      disposals 2020-2022
                                                                                                               until FY22(2) requirements

    Includes € 154m investments post 2022 (San Fernando III, Lisbon Park and Valencia)
(1) 

(2) 
     3 years cash retention based on 20% of FY19 AFFO
                                                                                                                                                                     ı 31 ı
Value creation    |    Potential rental growth (2019-2022)

ATTRACTIVE GROWTH PROFILE WITH HIGH DEGREE OF LETS AND PRE-LETS

(€m)
                                                        +24%
                                                                             23.5       667.9
                                                                                                                 651.8
                                                                   24.7
                                                         12.3                                        (16.0)
                                              37.2

                                  44.3

                       525.9
            499.7

  469.4

   GRI       GRI        GRI       Rev.       Landmark   Flagship   Best II   Best III   Potential   Non-core       GRI
   FY17      FY18       FY19     potential                                              GRI FY22    disposals post disposals

                                                                                                                         ı 32 ı
Capital
structure
Capital structure    |    Policy

INVESTMENT GRADE BBB RATING BY S&P WITH POSITIVE OUTLOOK AND Baa2 RATING
BY MOODY’S

       Maturity                                        Leverage
      schedule                                         • LTV below 50%
                                                       •T
                                                         arget to reach
               • 5-10 years                             LTV
Capital structure    |    Debt position

                                                       3,750      5,567       385
                                                                                       5,182
     (€ million)

                                             852

                               965

                             Secured     Non-mortage   Bonds    Total Gross   Cash   Total Net
                            bank loans       debt                  Debt                Debt

   % Gross financial debt     17.3%         15.3%      67.4%      100.0%

   Average cost (%)           2.60%         1.65%      2.07%      2.09%

   % interest rate hedged     98.6%         98.6%      100.0%     99.5%

                                                                                                 ı 35 ı
Capital structure    |    Debt maturity profile

INTENSE DEBT MANAGEMENT FURTHER SOFTENING THE MATURITY PROFILE

                          € 1,617m                             € 500m                               +€ 100m
                   ESG-linked financing                       15-year bond                      add-on 15-year
                                                                                                 post closing

                                                                                                                             1,057
                                    866          867                       889
                                           16           17    776                 89
                       716
                              16                                     176                                                         500

                                           850          850                       800
                              700                                                                               323
                                                                     600                                               23        557

                                                                                                                       300
  15 13    14                                                                            22         23
       2          14                                                                           22          23
2020       2021        2022         2023         2024         2025         2026         2027        2028        2029         +2030

 Unsecured loans         Unsecured bonds         Secured bank loans

                                                                                                                                     ı 36 ı
Capital structure    |    Key metrics

AMPLE COVENANT HEADROOM AND STRONG DEBT METRICS

                Unsecured senior notes covenants           MRL EMTN Program   FY 2019

                LTV                                             2.5x          4.2x

                Unsec. Assets to Unsec. Debt                    >125%         224.0%

                Other key metrics

                Unsecured debt                                                 82.7%

                Unencumbered assets (by GAV)                                  80.8%

                Undrawn facilities                                            € 700m

                Average cost (fully loaded with hedging)                      2.09%(3)

                Fixed interest rate(2)                                        99.5%

   LTM NOI / LTM finance cost
(1) 

    Excluding RCF
(2) 

    1.79% spot rate
(3) 

                                                                                         ı 37 ı
Sustainability
Sustainability    |    ESG achievements

REMARKABLE PROGRESS IN ESG

                                   ESG Benchmarks                                                                 Certifications

                                    MERLIN has obtained                                            Accesibility                     Efficiency
                                    an excellent mark in the 2019 edition

                                     82%
                                                       71%            72%
                                                                                       62%
                                                                                                      100%(1)        Target      99%       100%      97%

                                                                                                                     Actual      75%       77%       66%
                                    MERLIN           European         Global            Our
        Gold since 2017                               average        average           peers
                                                                                                     Shopping                   Offices   Shopping   Logistics
                                                                                                      centers                              centers

                                 Social engagement

         Direct contributions                          Matching program                           Quality                         Connectivity
                                                               Employee
        • 0.1% of GRI
                                                               contribution
                                                       • 2x
                                                               Volunteering
                                                               hours
        • 17 foundations                              • 47 foundations
                                                                                               >850k sqm certified            Wiredscore kicks-off
                                 61 foundations(2)                                                                            in Europe with MERLIN

    Excluding WIPs and Portugal
(1) 

    3 foundations are bennefited both from direct contributions and matching program
(2)                                                                                                                                                             ı 39 ı
Sustainability    |    Technology

MERLIN is focusing its technology efforts through 3 pillars
Deployment in our portfolio          Mentoring                              Sponsoring

Sensorization                       Proptech challenge
                                                                            MERLIN has invested in Fifth Wall,
                                                  MERLIN teamed up          a venture capital proptech fund
                                                  with ISDI and Impact
                                                  accelerator
                                                  The program allowed
                                                  us to identify Proptech
                                                  opportunities
Digitalization
    Tenant engagement App
                                    Prized proptechs                        Portfolio companies

                                    Proptech Ecosystem
   User experience

                                                  +
                                                                                                                 ı 40 ı
Sustainability    |    ESG Indexed Loan

          # Largest in the European                         KPI’s
            Real Estate sector to date

                                                            1                      2
                                                                Continuous
                                                                                        xternal LEED/
                                                                                       E
                                                                investment
              # Second largest                                  in energy
                                                                                       BREEAM energy
        ever in Spain across all industries                                            certifications
                                                                efficiency
                                                                                       achieved in
                                                                improvement
                                                                                       office, logistics
                                                                across the
                                                                                       and retail assets
                                                                portfolio
                    € 1.55 bn
                                                            3                      4
                                                                Handicapped            Electric
        Sustainability-linked financing                         access for all         consumption
                                                                tenants and            sourced by
                                                                customers              renewal
      € 850 m                      € 700 m                      throught AIS           energies
        Term Loan            Revolving Credit Facility          certification
                                                                of its buildings

Leading national and international financing institutions

                                                                                                       ı 41 ı
Sustainability    |    European Investment Bank funding

                                                                   Projects funded
                 € 115m
       logistics loan funded by the                       AZUQUECA II               AZUQUECA III
        European Investment Bank

         € 51m                € 64m
           Tranch I             Tranch II
                                                            SESEÑA               CABANILLAS PARK II

     Advantageous terms

           10 years loan
                                                          Assets
                                                                exceeding 400,000 sqm
           Fixed or variable rates                       European  Investment Bank support
                                                          
                                                          based on:
            Interest substantially below                 • Project location
             MERLIN’s average funding cost
                                                          • Energy efficiency certification

                                                                                                   ı 42 ı
Paseo de la Castellana, 257
28046 Madrid
+34 91 769 19 00
info@merlinprop.com
www.merlinproperties.com
You can also read