Forecasting Analysis Using Double Exponential Smoothing On The Indonesian Wholesale Trade Price Index
←
→
Page content transcription
If your browser does not render page correctly, please read the page content below
Vol-8 Issue-1 2022                                                                        IJARIIE-ISSN(O)-2395-4396

Forecasting Analysis Using Double Exponential
Smoothing On The Indonesian Wholesale Trade
                 Price Index
                  Firsty Giovanni Naoki Panca Putra1, Nurafni Eltivia2, Nur Indah Riwajanti3
            123
               Information System Accountancy, State Polytechnic of Malang, Malang, Indonesia

                                                    ABSTRACT
The purpose of this study is to determine the forecast of Indonesian Wholesale Trade Price Index using the
analytical method Double Exponential Smoothing based on the data from 2015 to 2020. This type of research is a
quantitative research that uses a sample data from Statistics Indonesia (BPS) in the Export-Import Sector. The
analyzing data used forecast analysis using Double Exponential Smoothing. Based on the results of data
analysis, it can be concluded the Forecasting of Indonesia Wholesale Trade Price Index Export-Import Sector
from January 2015 to December 2020. The limitation of this research is that the research only focuses on
forecasting results from the export and import sectors, as well as the limitations of the variables used. The research
is expected to be able to contribute to companies in knowing the rate forecast that affects the increase and decrease
in the Indonesia export and import sectors in the coming year.

Keywords: Forecasting, Wholesale Trade Price Index, Export, Import

    1. INTRODUCTION

         Indonesia's reliance on international trade as a source of national economic growth is quite high. According
to Salvatore (2007), capital flow activities at home and abroad are one of the economic activities that cannot be
isolated from international trade. Because of the difference in the cost of international trade processing, factors of
production can migrate from a country exporter to a country importer when international trade is done in the form of
imports and exports. Exports fluctuateSeveral factors strongly influence import and export nets. According to
Mankiw (2006), there are factors in the economy that have an effect. Among them are: To begin with, consumers
favor artificial products, both at home and abroad. Second, consider the cost of an outdoor product in both the
country and the home market. The third factor is the exchange rate, which influences the amount of domestic
currency required to purchase a specific amount of foreign currency. Consumers with a fourth opinion both inside
and outside the country Fifth, an item for cost transfer from one country to another. The sixth point is government
policy in international trade. As a result, the strength of the oil and gas trade balances, as well as non-oil and gas
trade balances, as well as the volatility of Indonesia's foreign exchange reserves, determine the best strategy for
achieving sharia and macroeconomic stability in Indonesia.

          When imports exceed exports, the trade balance will be in negative territory. A surplus in the trade balance,
on the other hand, occurs when exports exceed imports. Exports are classified into two categories in international
trade: oil and gas (oil and gas) and non-oil and gas (non-oil and gas). International trade is defined as "the activity of
exchanging goods and services generated by a country to be sold elsewhere to meet needs." 2014 (Razak & Indra).

         Indonesian entrepreneurs are very interested in this export. However, there are numerous barriers to
exports. Because the cost of exporting raw materials is already high, many firms opt to export ingredients rather than

15882                                              www.ijariie.com                                                   265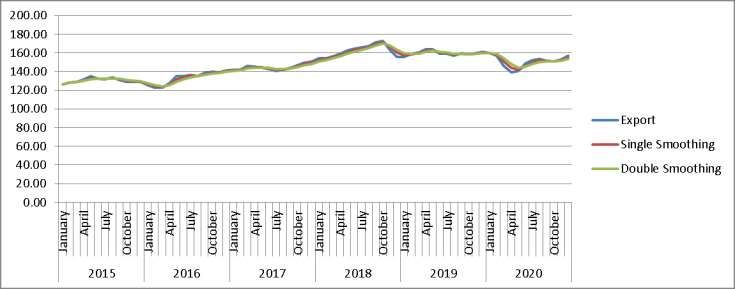
Vol-8 Issue-1 2022                                                                       IJARIIE-ISSN(O)-2395-4396

finished products. Almost every year, Indonesia has a surplus in exports. Indonesia's surplus is due to price rises for
exports, not increased value. The activity of issuing or sending commodities in quantity abroad for commercial
purposes is known as export. This includes selling property in a foreign country, demanding payment in a foreign
currency, and communicating in a foreign language (Amir MS, 2000:1). The goal of export activities is to improve
revenues for a firm or country, establish new markets outside of the country, and become accustomed to worldwide
competition.

          An import is defined as the acquisition of goods or services from another country for a country that has
entered into a cooperative arrangement with two or more countries. Imported products can also be defined as a type
of trade that involves bringing goods into Indonesia from other countries while adhering to all necessary restrictions
(Hutabarat, 1996: 403). An import is the legal movement of products or goods from one country to another, usually
through a trading transaction. Importation is the process of bringing items from another country into the country.
Importing products in bulk frequently necessitates customs action in the country. Imports are a crucial component of
international trade. Import activities are carried out in order to suit the needs of the general public. Imported goods
are products that cannot be manufactured or countries that have acquired manufactured goods but are unable to meet
public demand.

         In general, the unit value index of exports and imports is a measure of how prices for exported and
imported goods in Indonesia have changed over time. The unit value index of exports and imports is used to
calculate: (a) GDP at constant prices, particularly for the export and import components in the expenditure GDP
structure; and (b) trade exchange rates (terms of trade), by comparing the development of the export and import
price indices (BPS, 2019). According to the CPI calculation reported by the Indonesia Statistics (BPS), the value of
the export and import CPI tends to be stable, increasing and falling consistently every month.

          The COVID-19 viral pandemic is currently affecting the entire world and is still spreading. Since January
30, 2021, the WHO has recognized this virus as an epidemic of worldwide concern (Guo et al., 2020). In 2021, it
had even progressed to the second wave stage (Iftimie et al., 2021). This epidemic has had a significant influence on
a variety of sectors, including the country's economy. A country's export and import activities are crucial. A
country's income will come from its export and import activity. Lockdowns have been implemented in a number of
countries, affecting both export and import activities. According to data released by the Indonesia Statistics (BPS) in
2020, the COVID-19 virus pandemic had an impact on oil and gas and non-oil and gas import activities in Indonesia
from January to June 2020.Imports, particularly in the non-oil and gas sector, were subject to volatility at the time.
Oil and gas account for over 60% of global energy production (Kong, Dong, Shao, Wan, Tang, & Liu, 2016).
According to BPS 2020 data on the value of oil and gas and non-oil and gas imports, the number of imports from the
oil and gas industry is less than that of imports from the non-oil and gas sector.This is due to the oil and gas
industry's imports in the form of crude oil, oil products, and gas, all of which are natural resources in finite amounts,
resulting in a tiny amount of imported crude oil, oil products, and gas. According to BPS 2020 data on the value of
oil and gas and non-oil and gas imports, the number of imports from the oil and gas industry is less than that of
imports from the non-oil and gas sector.This is due to the oil and gas industry's imports in the form of crude oil, oil
products, and gas, all of which are natural resources in finite amounts, resulting in a tiny amount of imported crude
oil, oil products, and gas. According to BPS 2020 data on the value of oil and gas and non-oil and gas imports, the
number of imports from the oil and gas sector is smaller when compared to imports from the non-oil and gas sector.
This is due to the oil and gas industry's imports in the form of crude oil, oil products, and gas, all of which are
natural resources in finite amounts, resulting in a tiny amount of imported crude oil, oil products, and gas.

    2. LITERATURE REVIEW
    2.1 Wholesale Trade Price Index (IHPB)

         The Wholesale Trade Price Index is an economic indicator that includes index data and depicts changes in
wholesalers' purchasing prices from consumers. The bulk quantity of is determined. Wholesalers will find this data
extremely useful in determining changes in good purchase prices as well as predicting future price conditions (BPS,
2009). The Wholesale Trade Price Index is a price index that tracks the average price change of a group of goods in
the wholesale trade over time. This price index is one of the indicators used to track the economy's overall progress,
as well as a source of data for market and monetary analysis. Agriculture, mining and quarrying, industry, imports

15882                                             www.ijariie.com                                                   266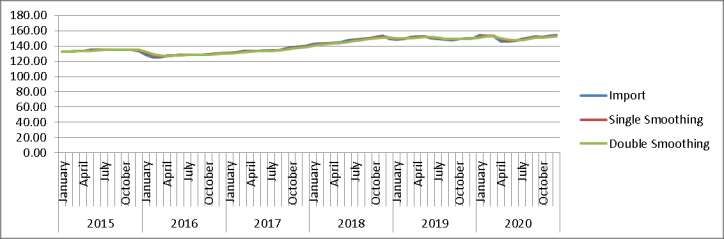
Vol-8 Issue-1 2022                                                                       IJARIIE-ISSN(O)-2395-4396

and exports are all covered by the Wholesale Trade Price Index in the form of general and sectoral indexes.
Although it is difficult to define the boundaries of large quantities in a trade because they are typically viewed from
two dimensions that are not always satisfied, large quantities do not always imply retail.The parameters of concern,
according to the BPS website, are the number and value of Lenggogani (2012).

    2.2 Forecasting Method

          There are two types of forecasting methods: qualitative and quantitative. Quantitative forecasting is the
method employed. There are two types of forecasting in the quantitative method: causal forecasting and time series
forecasting. Data collected over time in the form of daily, weekly, monthly, and yearly time series to describe a
certain event or condition is referred to as a time series (Makridakis et al. 1998). The term "time series analysis"
refers to a collection of observations that occur at regular intervals over time (Wei, 2006). Forecasting is a vital part
of planning that is both successful and efficient. According to Makridakis (1999), forecasting approaches are split
into two categories: subjective forecasting and objective forecasting. A qualitative model is used in the subjective
forecasting approach, while time series and causal models are used in the objective forecasting method. Qualitative
models seek to incorporate subjective aspects into forecasting models; this model will be especially useful if reliable
quantitative data is difficult to obtain.

    2.3 Time Series Analysis

         Time series analysis was introduced Box and Jenkins (1970). Since then, the time series has begun to
develop a lot. A time series is a series of observational data that occurs based on a time index sequentially with fixed
time intervals. Time series analysis is a statistical procedure that is applied to predict the probabilistic structure of
conditions that will occur in the future in order to make decisions. A sequence of observations has a time series
model if it fulfills two things: the time interval between time index t and t can be expressed at the same time
(identical), and there is a dependency between observations separated by a time interval in multiples of as much as k
times (expressed as lag). The purpose of time series analysis is to predict future conditions, determine the
relationship between variables and control interests (to determine whether the process is under control or not) (Aswi
and Sukarna, 2006).

    2.4 Smoothing Method

         According to Subagyo (2002), the smoothing method is a forecasting technique by taking the average of the
values several periods ago to estimate the value in a future period. This smoothing method is divided into two,
namely the average method and the exponential smoothing method.

    2.5 Average Method

           The average approach generates forecasts by averaging previous observations. Single moving averages and
double moving averages are two common methods for averaging historical data (Hanke, Reitsch, and Wichern,
2003). When a new observation value arrives, a single moving average can be generated by eliminating the oldest
observation values and replacing them with the most recent observation values (Makridakis, Wheelwright, and
McGee, 2003). This strategy is more appropriate. used to foresee unforeseen events. The following are some of the
method's limitations: Since eachpiece of data is given the same weight, it is not suitable for use when there are
fluctuations; the data is not random (there are trends and seasonality); it is less sensitive to drastic changes; and
determining the amount of data is subjective or impractical (Aritonang, 2002). The moving average of the moving
average is referred to as the double moving average (DMA) (Makridakis, Wheelwright, and McGee, 2003).
According to Subagyo (2002), the moving average is initially sought in this approach and placed in the last period.
Then, using the first moving average as a starting point, look for the moving average again and construct a forecast.
This approach works well for predicting data that is trending. Although the double moving average is simple to
calculate, it has the drawback of assigning the same weight to all data. The exponential smoothing method can be
applied to solve this problem. The moving average of the moving average is referred to as the double moving
average (DMA) (Makridakis, Wheelwright, and McGee, 2003). According to Subagyo (2002), the moving average
is initially sought in this approach and placed in the last period. Then, using the first moving average as a starting

15882                                             www.ijariie.com                                                   267
Vol-8 Issue-1 2022 IJARIIE-ISSN(O)-2395-4396
point, look for the moving average again and construct a forecast. This strategy is appropriate for anticipating data
that is trending. The double moving average is simple to calculate, but it has the drawback of giving each piece of
data the same weight. The exponential smoothing method can be used to solve this problem. The moving average of
the moving average is known as the double moving average (Makridakis, Wheelwright, and McGee, 2003).
According to Subagyo (2002), the moving average is initially searched in this approach, and it is placed in the last
period. Then, from the initial moving average, check for the moving average again and generate a forecast. This
strategy is appropriate for anticipating data that is trending. The double moving average is simple to calculate, but it
has the drawback of giving each piece of data the same weight. The exponential smoothing method might have been
employed in the last period to solve this problem. Then, from the initial moving average, check for the moving
average again and generate a forecast. This strategy is appropriate for anticipating data that is trending. The double
moving average is simple to calculate, but it has the drawback of giving each piece of data the same weight. The
exponential smoothing method can be used to solve this problem. placed in the previous period. Then, from the
initial moving average, check for the moving average again and generate a forecast. This strategy is appropriate for
anticipating data that is trending. The double moving average is simple to calculate, but it has the drawback of
giving each piece of data the same weight. The exponential smoothing method can be used to solve this problem.
2.6 Exponential Smoothing
Exponential smoothing is a technique in which the weighting reduces exponentially as the number of observations
increases. As a result, this approach is known as the exponential smoothing procedure. The exponential smoothing
approach, like moving averages, consists of single, multiple, and more elaborate methods. They all share the same
features, in that the newer value is given a higher weight than the older observation value (Makridakis, Wheelwright
and McGee, 2003). Continuous revisions of forecasts based on more recent experience are performed using this
exponential smoothing method, which involves averaging (smoothing) the values of previous data series by
exponentially decreasing them.
2.7 Double Exponential Smoothing
Brown's Double Exponential Smoothing is a linear model introduced by Brown, according to Makridakis
(2003). When the data exhibits a pattern, this method is used. A smoothed estimate of average growth at the
conclusion of each period is called the trend. It is also possible to go from a double moving average (Double Moving
Average) to a double exponential smoothing (Double Exponential Smoothing) using the same analogy used when
going from a single moving average (Single Moving Average) to a single exponential smoothing (Single
Exponential Smoothing). Because one of the restrictions of the Single Moving Average (i.e. the necessity to keep
the last n data) is still present in the Double Moving Average, such a change could be intriguing. Only three data
values and one value for can be used to calculate Double Exponential Smoothing. Past observations are likewise
given less weight in this approach. For this reason Double Exponential Smoothing is preferred over Double Moving
Average as a forecasting method in many major cases.
3. RESEARCH METHODOLOGY
Secondary data in the form of time series in the form of monthly data from January 2015 to December 2020
was used in this investigation. The annual results of the Wholesale Trade Price Index (IHPB) including commodity
sectors, imports, and exports are the source of data for the Indonesia Statistics (BPS) report. Robert G Brown's
Double Exponential Smoothing method was used to analyze it (1950). Brown's Double Exponential Smoothing is a
linear model created by Brown that uses only one parameter and adds double smoothing values to single smoothing
values. When the data reveals a trend but does not include the seasonal component, this method is used. Brown's
double exponential smoothing is implemented using the following formula:
Calculating single smoothing value
Calculating the value of double smoothing (double smoothing)
15882 www.ijariie.com 268Vol-8 Issue-1 2022 IJARIIE-ISSN(O)-2395-4396
Determining the smoothing constant
Doing forecasting
Where :
: Single smoothing value
: Double smoothing value
: Smoothing constant value in period t
: Coefficient value trend in period t
: Smoothing parameter where
: The number of future periods that will be predicted
: Forecasting m period
4. RESULTS AND DISCUSSION
In this section, we will discuss forecasting using the Double Exponential Smoothing method generated
using Excel. The data used in this study is data from the Pusan Statistics Agency (BPS) for 2015-2020, with a lot of
72 data, starting from January in 2015 to December in 2020, regarding the Indonesian Wholesale Trade Price Index
for Export Commodity Groups. and Import.
Graph. 1: Export and Import Sector Chart
Based on the Graph 1 above, the export and import sectors from 2015 to 2018 experienced an increase in
October 2018 from 172.82 to imports in November to 153.10. From 2018 to 2020 in April there was a decline
because in 2020 there was a Covid-19 pandemic which showed a decline in prices in the import sector by 145.77
and in the export sector of 139.01. This shows that there is an increase and decrease in the price of the wholesale
trade index for the export and import sectors as shown in the graph.
In this study, perform calculations with Brown's Double Exponential Smoothing using the parameter is
= 0.60 then perform the calculation of Brown's Double Exponential Smoothing as follows:
a. Determining the First Smoothing ( )
15882 www.ijariie.com 269Vol-8 Issue-1 2022 IJARIIE-ISSN(O)-2395-4396
To determine the smoothing value ( ) there are 2 data, namely exports and imports can use the following
equation:
For t=1
Because at t=1 the value is not yet available, then to overcome this problem it can be done by
setting a value equal to the value of the first period data ( ) for exports of 126.07 while
imports of 132.15.
For t=4
Export
Import
And so on until the calculation for t = 72 as follows:
For t=72
Export
Import
b. Determining the Second Smoothing Value ( )
To determine the second smoothing ( ) on export and import data, you can use the following equation:
For t=1
Because at t=1 the value is not yet available, then to overcome this problem it can be done by
setting a value equal to the value of the first period data ( ) of 126.07 for exports and 132.15
for imports.
For t=4
Export
Import
15882 www.ijariie.com 270Vol-8 Issue-1 2022 IJARIIE-ISSN(O)-2395-4396
And so on until the calculation for t = 72 is as follows:
For t=72
Export
Import
c. Determining the Size of the Constant ( )
To determine the value of export and import data, you can use the following equation:
For t=1
Export
=126,07
Import
=132,15
For t=4
Export
=131,01
Import
=133,47
and so on until the calculation for t = 72 is as follows:
For t=72
Export
=156,54
Import
=154,29
d. Determining the Slope( ) Value
To determine the value of export and import data, you can use the following equation:
For t=1
Export
=0
Import
15882 www.ijariie.com 271Vol-8 Issue-1 2022 IJARIIE-ISSN(O)-2395-4396
=0
For t=4
Export
=0,76
Import
=0,20
and so on until the calculation for t = 72 is as follows:
For t=72
Export
=2,06
Import
=0,98
15882 www.ijariie.com 272Vol-8 Issue-1 2022 IJARIIE-ISSN(O)-2395-4396
e. Forecasting the Price Index for Wholesale of Export and Import Commodities
After calculating the first smoothing value, the second smoothing value, the a t value and the bt
value using the parameter value = 0,6.
Graph 2: Graph of First Smoothing Value and Second Smoothing Value of Export Commodities
Based on Graph 2, which shows the movement of data patterns in the Export Commodity, the first
smoothing value and the second smoothing value. And it can be concluded that the first smoothing value
and the second smoothing value lag behind the actual data.
Table 1: First Smoothing Value, Second Smoothing Value, at and bt Values on Export Commodities
t Xt at bt
1 126.07 126.07 126.07 126.07 0.00
2 128.53 128.53 128.53 128.53 0.00
3 129.24 129.24 129.24 129.24 0.00
4 131.35 130.51 130.00 131.01 0.76
5 134.89 133.14 131.88 134.39 1.88
6 132.28 132.62 132.33 132.92 0.44
7 131.78 132.12 132.20 132.03 -0.13
8 133.38 132.87 132.61 133.14 0.40
9 131.19 131.86 132.16 131.57 -0.44
10 129.05 130.18 130.97 129.38 -1.19
11 129.09 129.52 130.10 128.95 -0.87
12 128.73 129.05 129.47 128.63 -0.63
13 125.29 126.79 127.86 125.72 -1.61
14 122.93 124.48 125.83 123.12 -2.03
15 122.76 123.45 124.40 122.49 -1.43
16 127.54 125.90 125.30 126.50 0.90
17 135.17 131.46 129.00 133.93 3.70
15882 www.ijariie.com 273Vol-8 Issue-1 2022 IJARIIE-ISSN(O)-2395-4396 18 135.33 133.78 131.87 135.70 2.87 19 136.65 135.50 134.05 136.96 2.18 20 135.36 135.42 134.87 135.96 0.82 21 138.45 137.24 136.29 138.18 1.42 22 139.62 138.67 137.72 139.62 1.43 23 139.29 139.04 138.51 139.57 0.79 24 141.33 140.41 139.65 141.18 1.14 25 141.99 141.36 140.68 142.04 1.02 26 141.88 141.67 141.27 142.07 0.60 27 145.76 144.12 142.98 145.27 1.71 28 145.22 144.78 144.06 145.50 1.08 29 144.04 144.34 144.23 144.45 0.16 30 142.91 143.48 143.78 143.18 -0.45 31 140.85 141.90 142.65 141.15 -1.13 32 142.17 142.06 142.30 141.83 -0.35 33 144.29 143.40 142.96 143.84 0.66 34 146.90 145.50 144.48 146.52 1.52 35 149.49 147.89 146.53 149.26 2.05 36 150.83 149.66 148.41 150.91 1.88 37 153.92 152.21 150.69 153.74 2.29 38 154.46 153.56 152.41 154.71 1.72 39 156.64 155.41 154.21 156.61 1.80 40 159.12 157.64 156.27 159.01 2.05 41 162.77 160.72 158.94 162.50 2.67 42 164.43 162.94 161.34 164.55 2.41 43 166.04 164.80 163.42 166.19 2.08 44 167.11 166.19 165.08 167.29 1.66 45 171.36 169.29 167.61 170.98 2.53 46 172.82 171.41 169.89 172.93 2.28 47 162.86 166.28 167.72 164.84 -2.16 48 155.93 160.07 163.13 157.01 -4.59 49 155.59 157.38 159.68 155.08 -3.45 50 159.05 158.38 158.90 157.86 -0.78 51 160.57 159.70 159.38 160.01 0.48 52 163.77 162.14 161.04 163.24 1.66 53 163.96 163.23 162.35 164.11 1.32 54 158.92 160.64 161.33 159.96 -1.03 55 158.96 159.63 160.31 158.96 -1.02 56 157.07 158.10 158.98 157.21 -1.33 57 159.46 158.91 158.94 158.89 -0.04 58 158.26 158.52 158.69 158.35 -0.25 15882 www.ijariie.com 274
Vol-8 Issue-1 2022                                                                    IJARIIE-ISSN(O)-2395-4396

 59       159.92          159.36                   159.09                   159.63          0.40
 60       161.14          160.43                   159.89                   160.96          0.80
 61       159.65          159.96                   159.93                   159.99          0.04
 62       157.06          158.22                   158.91                   157.54          -1.03
 63       146.27          151.05                   154.19                   147.91          -4.71
 64       139.01          143.83                   147.97                   139.68          -6.22
 65       140.33          141.73                   144.23                   139.23          -3.75
 66       148.47          145.77                   145.15                   146.39          0.93
 67       152.31          149.70                   147.88                   151.51          2.72
 68       153.76          152.13                   150.43                   153.84          2.55
 69       151.32          151.65                   151.16                   152.13          0.73
 70       150.84          151.16                   151.16                   151.16          0.00
 71       152.78          152.13                   151.74                   152.52          0.58
 72       157.20          155.17                   153.80                   156.54          2.06

           Graph 3: Graph of First Smoothing Value and Second Smoothing Value of Imported Commodities

                    Based on Graph 3, which shows the movement of data patterns in Import Commodities, the first
           smoothing value and the second smoothing value. And it can be concluded that the first smoothing value
           and the second smoothing value are slightly parallel to the actual data.

           Table 2: First Smoothing Value, Second Smoothing Value, at and bt Values on Imported Commodities

      t            Xt                                                          at                     bt
      1       132.15           132.15                 132.15                 132.15                  0.00
      2       132.14           132.14                 132.14                 132.14                  0.00
      3       133.00           133.00                 133.00                 133.00                  0.00
      4       133.56           133.34                 133.20                 133.47                  0.20
      5       134.75           134.18                 133.79                 134.58                  0.59
      6       134.97           134.66                 134.31                 135.00                  0.52

15882                                            www.ijariie.com                                              275
Vol-8 Issue-1 2022 IJARIIE-ISSN(O)-2395-4396 7 135.00 134.86 134.64 135.08 0.33 8 135.10 135.00 134.86 135.15 0.22 9 135.40 135.24 135.09 135.39 0.23 10 135.29 135.27 135.20 135.34 0.11 11 135.39 135.34 135.28 135.40 0.09 12 133.52 134.25 134.66 133.83 -0.62 13 128.36 130.72 132.29 129.14 -2.37 14 125.17 127.39 129.35 125.43 -2.94 15 125.01 125.96 127.32 124.61 -2.03 16 127.23 126.72 126.96 126.48 -0.36 17 127.65 127.28 127.15 127.41 0.19 18 128.62 128.08 127.71 128.46 0.56 19 128.23 128.17 127.99 128.36 0.28 20 128.13 128.15 128.08 128.21 0.10 21 128.73 128.50 128.33 128.66 0.25 22 129.34 129.00 128.73 129.27 0.40 23 130.11 129.67 129.29 130.04 0.56 24 130.66 130.26 129.88 130.65 0.58 25 131.09 130.76 130.41 131.11 0.53 26 131.88 131.43 131.02 131.84 0.62 27 133.36 132.59 131.96 133.22 0.94 28 133.41 133.08 132.63 133.53 0.67 29 133.76 133.49 133.15 133.83 0.51 30 133.90 133.74 133.50 133.97 0.35 31 133.89 133.83 133.70 133.96 0.20 32 134.34 134.14 133.96 134.31 0.26 33 136.65 135.64 134.97 136.32 1.01 34 138.26 137.21 136.32 138.11 1.35 35 139.01 138.29 137.50 139.08 1.19 36 140.45 139.59 138.75 140.42 1.25 37 142.35 141.24 140.25 142.24 1.50 38 143.18 142.41 141.54 143.27 1.29 39 143.78 143.23 142.56 143.91 1.01 40 143.98 143.68 143.23 144.13 0.67 41 145.11 144.54 144.01 145.06 0.78 42 147.32 146.21 145.33 147.08 1.32 43 148.64 147.67 146.73 148.60 1.40 44 149.30 148.65 147.88 149.41 1.15 45 150.36 149.67 148.96 150.39 1.08 46 151.51 150.78 150.05 151.50 1.09 47 153.10 152.17 151.32 153.02 1.27 15882 www.ijariie.com 276
Vol-8 Issue-1 2022 IJARIIE-ISSN(O)-2395-4396
48 149.59 150.62 150.90 150.34 -0.42
49 148.45 149.32 149.95 148.69 -0.95
50 149.56 149.46 149.66 149.27 -0.29
51 151.55 150.72 150.29 151.14 0.63
52 152.20 151.61 151.08 152.13 0.79
53 152.92 152.39 151.87 152.92 0.79
54 150.36 151.17 151.45 150.90 -0.42
55 149.34 150.07 150.62 149.52 -0.83
56 148.19 148.94 149.62 148.27 -1.01
57 147.91 148.32 148.84 147.81 -0.78
58 149.45 149.00 148.94 149.06 0.10
59 149.80 149.48 149.26 149.70 0.33
60 150.24 149.94 149.67 150.21 0.40
61 154.02 152.39 151.30 153.47 1.63
62 153.81 153.24 152.46 154.02 1.17
63 152.91 153.04 152.81 153.27 0.35
64 145.77 148.68 150.33 147.03 -2.48
65 145.62 146.84 148.24 145.45 -2.09
66 146.44 146.60 147.26 145.95 -0.98
67 149.65 148.43 147.96 148.90 0.70
68 150.85 149.88 149.11 150.65 1.15
69 152.60 151.51 150.55 152.47 1.44
70 151.62 151.58 151.17 151.99 0.61
71 153.23 152.57 152.01 153.13 0.84
72 154.35 153.64 152.99 154.29 0.98
Based on the results of the calculations in table 1 and table 2, it is possible to forecast the
Wholesale Trade Price Index for export and import commodities for the next 2 years. To calculate the
forecast value can use the following equation:
Forecast t=4 (m=1) is for April 2015
Export:
F4+1=129,24+0,00
F4=129,24
Import:
F4+1=133,00+0,00
15882 www.ijariie.com 277Vol-8 Issue-1 2022 IJARIIE-ISSN(O)-2395-4396
F4=133,00
Forecast t=73 in January 2021
Export:
F73+1=156,54+2,06
F73=158,60
Import:
F73+1=154,29+0,98
F73=155,27
f. The Result of Forecasting the Consumer Price Index of Indonesian Export and Import Commodities
After obtaining the results of the forecasting calculations, the forecasting results can also be presented in
the following graphic form:
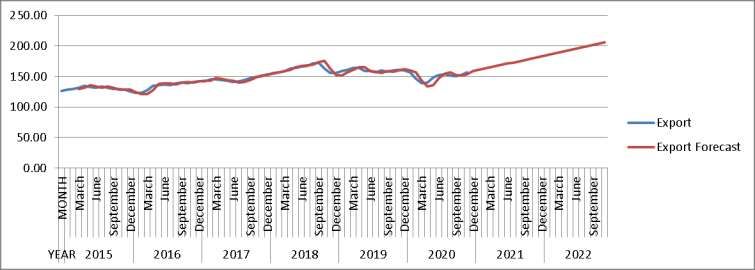
Graph 4: Forecasting Graph of Export Commodities
The Export Commodity CPI in August 2018 declined as a result of the 25% DMO policy for coal,
according to the forecasting results. Since we stopped coal traders from exporting, and now we're creating
export allowances, the DMO provision is no longer an obligation, and I believe we'll be able to compensate
next month," said Trade Minister Enggartiasto Lukita in the Kelapa Gading region of Jakarta North on
Monday (17/9). Due to the start of the lockdown against the Covid-19 pandemic in March 2020, the price
decreased by 139.01, however on the Forecast chart, it decreased in April, with a price value of 133.46.
"Oil and gas exports declined 16.29 percent in March, but non-oil and gas exports rose 1.24 percent," stated
BPS Head Suhariyanto in a virtual conference in Jakarta on Wednesday, March 15 2020. In March of this
year, export values were lower than in March of the previous year. Exports fell 0.20 percent to $14.12
billion in March 2020. Oil and gas exports decreased by 40.91 percent, while non-oil and gas exports
increased by only 3.38 percent. Both experienced a large growth in the months following until December.
Due to the start of the lockdown against the Covid-19 pandemic in March 2020, the price fell to 139.01, but
the Forecast chart fell to 133.46 in April. "Oil and gas exports declined 16.29 percent in March, but non-oil
and gas exports rose 1.24 percent," stated BPS Head Suhariyanto in a virtual conference in Jakarta on
Wednesday, March 15 2020. In March of this year, export values were lower than in March of the previous
year. Exports fell 0.20 percent to $14.12 billion in March 2020. Oil and gas exports decreased by 40.91
percent, while non-oil and gas exports increased by only 3.38 percent. Both experienced a large growth in
the months following until December. Exports fell in value in March 2019 compared to March 2019.
Exports declined 0.20 percent to $14.12 billion in March 2020. Oil and gas exports decreased by 40.91
15882 www.ijariie.com 278Vol-8 Issue-1 2022 IJARIIE-ISSN(O)-2395-4396
percent, while non-oil and gas exports increased by only 3.38 percent. Both experienced a large growth in
the months following until December.
Graph 5: Forecasting Graph of Import Commodities
Because the Ministry of Finance released a Regulation of the Minister of Finance (PMK) addressing the
increase in income tax (PPh) article 22 related to imports, the CPI of Imported Commodities in December 2018
dropped, according to the forecasting findings. According to Heru, the average daily import realization for the
finished consumer products group increased to 7.5 percent, while import activity decreased by 12.3 percent
(finance.detik.com). In June of this year, the drop occurred again. According to Suhariyanto, the reduction in
imports in June 2019 was driven by a drop in oil and gas imports as well as non-oil and gas imports. The drop in
imports owing to the holiday commerce is attributable to the period of leave and holidays associated with the 2019
Eid al-Fitri. "The 9-day sabbatical in June 2019 had a significant impact on the pace of imports in Indonesia,"
Suhariyanto stated in a press conference at the BPS Headquarters in Jakarta on July 15, 2019. Oil and gas imports
declined by 21.50 percent in June 2019, from USD 2.18 billion in May to USD 1.71 billion. Then, from USD 12.42
billion in May 2019 to USD 9.87 billion in June 2019, non-oil and gas imports dropped 20.55 percent. Due to the
early lockdown of the Covid-19 epidemic in March 2020, the price value decreased to 145.77, however on the
Forecast chart, it decreased to 143.36 in May. Both experienced a large growth in the months following until
December.
5. CONCLUSION
Based on the results of the basic analysis and discussion in the previous presentation, conclusions are
obtained as answers to research problems, namely, Parameter namely = 0.60 for the forecasting of the Export and
Import Commodity Trade Price Index, the results of the forecasting of the Export and Import Commodity Trading
Price Index in January 2021 and in November 2022 using Parameter namely the Double Exponential Smoothing
method from Brown showing an increase every month, namely in Exports and Imports in January 2021 and in
December. Based on the results of the analysis and conclusions, the limitations of this study are that this research
only focuses on forecasting results from the export and import sectors, as well as the limitations of the variables
used, determining the accuracy of forecasting results in 2021 with actual data and considering the factors that
influence it in the following year. from the external and internal environment.
6. ACKNOWLEDGMENT
In this study, the researchers would like to thank Mrs. Nurafni Eltivia as the first supervisor and Mrs. Nur
Indah Riwajanti as the second supervisor who never tire of providing very useful directions and suggestions. I also
thank my parents, namely my beloved father Suatmo Pantja Putra and my beloved mother Siti Sri Handayani and
my beloved sister Noriko Hanna Jeannette Panca Putri who always give prayers, encouragement and best wishes.
15882 www.ijariie.com 279Vol-8 Issue-1 2022 IJARIIE-ISSN(O)-2395-4396
Thank you also to the MTSIA Polinema classmates who helped each other in the process of doing this research.
Don't forget to thank my friends, Tasya, Epin, Iro, Gilang, Doni, Haykal, Arum, Vina, Bimo and other friends who
always give encouragement, advice and motivation.
7. REFERENCES
[1]. Pujiati, E., Yuniarti, D., & Goejantoro, R. (2016). Peramalan Dengan Menggunakan Metode Double
Exponential Smoothing Dari Brown (Studi Kasus: Indeks Harga Konsumen (IHK) Kota Samarinda), 7(1).
[2]. Setyawan, B., Riwajanti, N. I., & Ismanu, S. (2020). Analisis Peramalan menggunakan arima Pada Indeks Harga
Perdagangan Besar Indonesia kelompok komoditi pertanian tahun 2000-2019. Media Mahardhika, 18(2),
198–205. https://doi.org/10.29062/mahardika.v18i2.148
[3]. Putri, D. P., Damayanti, E. W., & Sianturi, I. (2021). Pengaruh covid-19 Terhadap Kegiatan ekspor impor di
Indonesia. Dinamika Bahari, 2(2), 169–174. https://doi.org/10.46484/db.v2i2.271
[4]. Sihombing, M., Sihotang, J., & Purba, M. L. (n.d.). Analisis Pengaruh Ekspor Migas, Ekspor Non Migas Dan
penanaman modal asing terhadap pertumbuhan ekonomi indonesia tahun 2000-2019 Retrieved December
22, 2021, from
https://www.researchgate.net/publication/354150485_ANALISIS_PENGARUH_EKSPOR_MIGAS_EKSPO
R_NON_MIGAS_DAN_PENANAMAN_MODAL_ASING_TERHADAP_PERTUMBUHAN_EKONOMI
_INDONESIA_TAHUN_2000-2019
[5]. Lesmana, E., Jasman, H., & Nahar, J. (2021). International Journal of Entrepreneurship and Business
Development. Forecasting of Production and Export Indonesian Pepper Commodities Using Smoothing
Exponential and Holt Winter Methods, 4.
[6]. Nindian Puspa Dewi. (2020). Implementasi Holt-winters exponential smoothing untuk Peramalan Harga Bahan
Pangan di Kabupaten Pamekasan. Digital Zone: Jurnal Teknologi Informasi Dan Komunikasi, 11(2), 223–
236. https://doi.org/10.31849/digitalzone.v11i2.4797
[7]. AJUNU, Y. U. L. I. N. A. R. I., ACHMAD, N. O. V. I. A. N. I. T. A., & PAYU, M. U. H. A. M. M. A. D. R. E.
Z. K. Y. (2020). Perbandingan metode autoregressive integrated moving average Dan metode double
exponential smoothing Dari Holt Dalam meramalkan nilai impor di Indonesia. Jambura Journal of
Probability and Statistics, 1(1), 37–46. https://doi.org/10.34312/jjps.v1i1.5393
[8]. Purwanti, D., & Purwadi, J. (2019). Metode Brown’s double exponential smoothing Dalam Peramalan Laju
inflasi di Indonesia. Jurnal Ilmiah Matematika, 6(2), 54. https://doi.org/10.26555/konvergensi.v6i2.19548
[9]. Ali, K. (2021). Forecasting analysis of share price index in construction companies registered in Indonesia Stock
Exchange 2015-2019. Journal of Economics Research and Social Sciences, 5(1), 42–63.
https://doi.org/10.18196/jerss.v5i1.11044
[10]. Analisis Deret Waktu - Researchgate. (n.d.). Retrieved December 24, 2021, from
https://www.researchgate.net/profile/Sukarna-
Sukarna/publication/338293807_Analisis_Deret_Waktu_Teori_dan_Aplikasi/links/5e0c6f0392851c8364a93
6e9/Analisis-Deret-Waktu-Teori-dan-Aplikasi.pdf
[11]. Makridakis, S., Steven C Wheelwright., Victor E Mc.Gee. 1999. Metode dan Aplikasi Peramalan. Edisi Kedua.
Jilid 1. Binarupa Aksara : Jakarta
[12]. Makridakis, S. (1996). Strategic business forecasting. International Journal of Forecasting, 12(3), 435–437.
https://doi.org/10.1016/0169-2070(96)90049-7
15882 www.ijariie.com 280Vol-8 Issue-1 2022 IJARIIE-ISSN(O)-2395-4396
[13]. Kusuma, H. (n.d.). Karena Aturan Baru, impor Barang Harian turun US$ 3 juta. detikfinance. Retrieved
December 25, 2021, from https://finance.detik.com/berita-ekonomi-bisnis/d-4347776/karena-aturan-baru-
impor-barang-harian-turun-us-3-juta?_ga=2.194792741.924381997.1640407057-905651072.1640407057
[14]. Analisis Deret Waktu - Researchgate. (n.d.). Retrieved December 24, 2021, from
https://www.researchgate.net/profile/Sukarna-
Sukarna/publication/338293807_Analisis_Deret_Waktu_Teori_dan_Aplikasi/links/5e0c6f0392851c8364a93
6e9/Analisis-Deret-Waktu-Teori-dan-Aplikasi.pdf
[15]. P., B. G. E., & Jenkins, G. M. (1976). Time Series Analysis: Forecasting and Control. Holden-Day.
[16]. Badan Pusat Statistik. (n.d.). Retrieved December 25, 2021, from
https://www.bps.go.id/publication/2020/03/23/0477d77fc5ccf3c3ca7a6fe6/indeks-harga-perdagangan-besar-
indonesia--2010-100--tahun-2019.html
[17]. Badan Pusat Statistik. (n.d.). Retrieved December 25, 2021, from
https://www.bps.go.id/publication/2021/02/26/00539965de58d1f7dd4e95f6/indeks-harga-perdagangan-besar-
indonesia--2018-100--2020.html
[18]. Badan Pusat Statistik. (n.d.). Retrieved December 25, 2021, from
https://www.bps.go.id/publication/2021/10/27/e06c29c56f5d22eff7d2970b/indeks-unit-value-ekspor-2018-
2020.html
15882 www.ijariie.com 281You can also read