Formulation of a Functional Lactic Drink Enriched with Different Proportions of Quinoa (Chenopodium Quinoa) - International Journal of Food ...
←
→
Page content transcription
If your browser does not render page correctly, please read the page content below
International Journal of Food Engineering Vol. 7, No. 1, June 2021 Formulation of a Functional Lactic Drink Enriched with Different Proportions of Quinoa (Chenopodium Quinoa) Wilber Quispe2, Doris Esenarro2, Ciro Rodriguez1, 2, Maria Veliz1, 2, and Giancarlo Cordova2 1 Specialized Institute for Ecosystems and Natural Resources Research (INERN) UNFV, Lima, Peru 2 Federico Villarreal University Lima, Lima, Peru Email: wqprado_09@hotmail.com, mveliz@unfv.edu.pe, desenarro@unfv.edu.pe gcordova@unfv.edu.pe. Abstract—The present research work is to propose, curd. It contains about 50% of the concentration of milk formulate an optimal functional drink and reduce the solids and particularly its serum proteins, which are of impact generated by the cheese industries. Different excellent quality because they provide essential amino formulations enriched with quinoa were evaluated and thus acids and have a high absorption coefficient; it is be able to characterize it as sensorial acceptable. The Taguchi methodology was used in the formulation process, considered a high-value product nutritious as it is which allowed us to work with three control factors: serum discussed in [2]. (LC), water (AG), and quinoa flour (HQ), with two levels of Physicochemical tests were carried out on milk and work and four experimental runs. The four formulations cheese and texture profile analysis (TPA) on cheese. The were F1 (LC (50%), AG (30%) and HQ (5%)), F2 (LC results indicate that the incorporation of whey protein (50%), AG (40%) and HQ (10%)); F3 (LC (60%), AG (30%) concentrates into cheese increases yield [3]. Functional and HQ (10%)) and F4 (LC (60%), AG (40%) and HQ drinks are characterized by offering the customer a (5%)). A sensory acceptability (AS) analysis determined by beneficial and nutritious product for health. The taste, color, and the smell was performed. The best development of the profile of available drinks should also formulation was F3 with an AS (4.46) equivalent to the consider the preservation of valuable compounds or "moderately similar" signal/noise ratio (12,987). properties. Consumers are looking for practical and convenient foods that save time and effort. In the Index Terms—Functional lactic, proportions of quinoa, elaboration of available drinks, it is necessary to lactic drink characterize the ingredients to be used. It is needed to find the optimal mixture of components that generate a I. INTRODUCTION new product whose formulation offers functional product Milk is the raw material with which cheese is made. characteristics with high nutritional value). Whey, a Cheese production requires a large amount of milk; to material that is usually discarded by the dairy industry is obtain a kilogram of cheese, approximately 10 liters of whey is rich in phosphorus. It is also more abundant in milk are needed, and 9 liters of whey are generated as a calcium and lactic acid. It is estimated that 10 liters of byproduct. Whey is the liquid residue that is obtained cow's milk can produce 1 to 2 kg of cheese and an mainly after the separation of the curd in cheese making. average of 8 to 9 kg of whey, representing about 85-90% On average, it contains more than half of the solids of the volume of milk, which contains around 55% of its present in the original milk, including about 20% of the nutrients. Water is the component that allows the drink to proteins, most of the lactose minerals, and soluble generate the characteristic of freshness. Quinoa is an vitamins. Andean cereal. Protein content can range in range from According to an FAO work, whey, a liquid residue 7.47% to 22.08%. Quinoa is a natural product of the from the manufacture of cheese and casein, is one of the Andean region. Sugar is an ingredient whose attribution largest reserves of food proteins still outside human to the drink improves taste and allows better sensory consumption channels. Paradoxically, even today, a large acceptance. However, it must be taken into account that proportion of the entire litters generated by the day sugary beverages do not provide any nutritional benefit, continue to be wasted. Traditionally, serum was as is found in [4]. considered an undesirable element, of little interest and This paper identified technological trends in the high cost of disposal. In the concentration of milk during production of sweetener syrup and the use of whey cheese processing [1], whey is released, which through a patent review in the databases of Espacenet, corresponds to about 83% of the volume of milk used as Google Patent Search, and the Superintendence of raw material, which is exuded from inside the cheese Industry and Commerce of Colombia SIC. Two hundred twenty-six documents were found, 119 Manuscript received January 12, 2021; revised May 21, 2021. international patents and 107 applications were ©2021 International Journal of Food Engineering 12 doi: 10.18178/ijfe.7.1.12-16
International Journal of Food Engineering Vol. 7, No. 1, June 2021

 registered with the SIC. Only three papers deal with The raw materials used for the manufacture of the
 the production of sweetener syrup; the rest are mainly dairy beverage are quinoa, milk, and whey. Four
 oriented to the extraction of the proteins contained in formulations were made containing different percentages
 the whey and its application in different fields. [5]. of quinoa.
 The fact of obtaining a mathematical model is
 D. Information Processing and Analysis
significant because you can get many answers just by
studying some levels of work through discrete simulation The analysis of the information received was
and the design of experiments. A mathematical model) performed; that is to say, ablution of incorrect
with a function as in formula (1) that describes sensory information: incompatible, inconclusive, not pertinent,
acceptability was used. [6] since when making cupping, it is necessary to be aware
 that all the information that is collected is helpful for the
 = + 1 1 + 2 2 + 11 21 + 22 2 2 investigation, the indispensable data for the research
 + 12 1 2 (1) should have been clear taking the study variables were
 taken into account, since regarding these variables, the
 = ℎ necessary information that would allow establishing the
 ℎ best beverage mix had to be collected. [9]
 2 =
 III. EXPERIMENTAL DESIGN
 To calculate the sample size, you have the following Acceptability through the Taguchi Method: Three
formulation: independent variables were identified: whey (LC), water
 (AG), quinoa flour (HQ), two levels of work will be
 = (2)
 ( − 1) + presented (Table I), and the dependent variable is
 formulation (F). The indicators to be analyzed are
 2 sensory acceptance (AS), signal to noise (S/R), and delta.
 =1− =
 4
 TABLE I. LEVELS CONSIDERED IN THE TAGUCHI EXPERIMENTAL
 DESIGN
N = population size
p = probability of success Control factors Levels
 1 2
q = probability of failure
 Whey 50 % 60 %
D = precision (maximum permissible error in terms of Water 30 % 40 %
proportion) Quinoa Flour 5% 10 %
B = magnitude estimation error * 1 = minimum; 2 = maximum
 Table I shows the percentage composition of the mixes
 II. METHOD AND MATERIALS and the levels
 The research, the procedures to elaborate a functional
drink of Lacto-serum enriched with quinoa are detailed to TABLE II. EXPERIMENTAL FORMULATIONS WITH TAGUCHI DESIGN
characterize it sensually acceptable. The design is an Design point LC AG HQ
experimental transactional type evaluated on time. It will F1 1 1 1
consist of an explanatory level where the causes that F2 1 2 2
 F3 2 1 2
cause the problem are sought based on independent and F4 2 2 1
correlational variables. [7]
A. Instruments for Data Collection and Data In Table II, four experimental formulations of the
 Processing functional drink of Lacto-serum fortified with quinoa
 The following programs will be used for data were obtained.
processing: Minitab version 16, Microsoft Office Excel
2013, and IBM SPSS Statistics.
B. Supplies, Materials, and Equipment
 The following ingredients are required: whey, water,
quinoa flour, sugar, additives (citric acid, potassium
sorbate, and others). Moreover, scales, test tubes,
thermometers, Erlenmeyer glasses, pots, spoons, bowls,
and containers will be used.
C. Experimental Design
 The experimental design of a single utterly
randomized factor was applied used in the food industry,
with three replicas for each treatment, to determine the
best milk beverage mix. [8] Figure 1. Process flow diagram

©2021 International Journal of Food Engineering 13
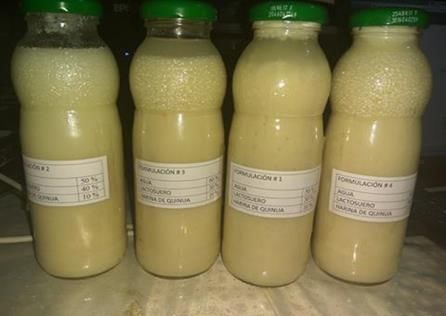
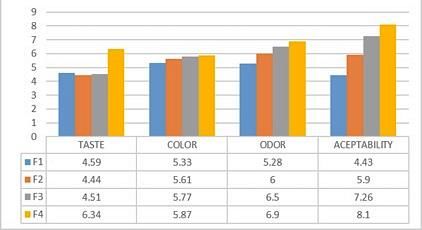
International Journal of Food Engineering Vol. 7, No. 1, June 2021

 In Fig. 1 shows the sequence of the production process C. Sensory Analysis of the 4 Samples of Milk Drink
during its elaboration of the fortified beverage. The evaluation establishes that between treatments and
 tasters, there is a significant difference (P≥0.05) for all
 IV. RESULTS evaluation parameters, these differences depended on the
A. Population Sample Determination criteria of the tasters, which shows that the different
 proportions in the formulations of each treatment cause
 The following equation determined the sample size of structural and sensory differences in the drink, which the
the student population of the School of Agricultural panel could easily detect and caused the sensory mean
Engineering: With 130 students from the total population,
 between the samples and the tasters to be similar for each
B (0.05), p (50%), and q (50%). parameter analyzed. [10]

 = ( −1) + (3)
 TABLE IV. REASON FOR THE VARIANCE

N = 162 n = 61 people to survey Sample Taste Color Odor Aceptability
where: F1 4,59 5,33 5,28 4,43
N = population size F2 4,44 5,61 6,00 5,90
Z = confidence level
 F3 4,51 5,77 6,50 7,26
P = probability of success, or expected proportion
Q = probability of failure F4 6,34 5,87 6,90 8,10
D = precision (Maximum permissible error in terms of
proportion) In Table IV shows the behavior of the reason the
 variance of the samples about taste, color, odor, and
B. Statistical Analysis acceptability
 The results of the evaluation of sensory attributes and
acceptability are presented in the figure. It is evidenced
that the treatment with higher acceptability was F3; in
this case, the concentrations of the three components of
the drink in this treatment give an appearance and
sensory stimuli similar to a whole UHT milk, hypothesis
argued by the tasters (untrained panel). [10]

 Figure 3. Reason for the variance.

 In Fig. 3 shows the behavior of the four levels, in
 which we can observe the variation

 D. Optimal Formulation
 Table IV shows that the best combination of
 independent variables corresponded to F3 with an
 average AS score equal to 4.46 equivalent of a
 Figure 2. Summary of the sensory test.
 “Moderately Like” rating and an S / R-value of 12,987
 In Fig. 2 shows demonstrates that the incorporation of (higher is better).
quinoa, its balance with whey and milk in mixture three, The Taguchi methodology was used in the formulation
considerably improves sensory attributes concerning process, which allowed us to work with three control
white, making this the best mix. factors: whey (LC), water (AG), and quinoa flour (HQ),
 with two levels of work and four experimental runs. The
 TABLE III. SENSORY TEST DATA four formulations were F1 (LC (50%), AG (30%) and
 HQ (5%)), F2 (LC (50%), AG (40%) and HQ (10%)); F3
 Sample Taste Color Odor Aceptability (LC (60%), AG (30%) and HQ (10%)) and F4 (LC (60%),
 AG (40%) and HQ (5%)). A sensory acceptability (AS)
 F1 4,59 5,33 5,28 4,43
 analysis determined by taste, color, and the smell was
 F2 4,44 5,61 6,00 5,90 performed. The best formulation was F3 with an AS
 F3 4,51 5,77 6,50 7,26 (4.46) equivalent to a "moderately liked" Signal / Noise
 ratio (12,987). [11]
 F4 6,34 5,87 6,90 8,10
 E. Ready Formulations
 In Table III shows the behavior of the sensory test data In Fig. 4 shows the four bottles of the final products
of the samples with the different variance

©2021 International Journal of Food Engineering 14
International Journal of Food Engineering Vol. 7, No. 1, June 2021

 the CD Experimentation development and data analysis.
 We carried out the exploratory field study, the authors'
 contribution is reflected in all the research approved in its
 final version.

 REFERENCES
 [1] S. Strite and H. Morkoc, J. Vac. Sci. Technol., B 10 1237, 1992.
 [2] S. Nakamura, M. Senoh, S. Nagahama, N. Iwase, T. Yamada, T.
 Matsushita, H. Kiyoku, and Y. Sugimoto, Japan. J. Appl. Phys. 35
 L74, 1996.
 [3] S. M. Sze Earth and Environmental Science of Semiconductor
 Devices, New York: Wiley–Interscience, 1969.
 Figure 4. Final product. [4] L. I. Dorman, Variations of Galactic Cosmic Rays, Moscow:
 Moscow State University Press, 1975, p. 103.
 [5] R. Caplar and P. Kulisic, Proc. Int. Conf. on Nuclear Earth and
 Environmental Science (Munich), Amsterdam: North-
 TABLE V. AVERAGE AS AND S / R VALUES OF EXPERIMENTAL
 Holland/American Elsevier, 1973, vol. 1, p. 517
 FORMULATIONS
 [6] A. Szytula and J. Leciejewicz, Handbook on the Earth and
Sample Taste Color Odor Aceptability Environmental Science and Chemistry of Rare Earths, K. A.
 Gschneidner Jr and L. Erwin, Eds., Amsterdam: Elsevier, 1989,
F1 4,59 5,33 5,28 4,43 vol. 12, p 133
F2 4,44 5,61 6,00 5,90 [7] T. Kuhn, “Density matrix theory of coherent ultrafast dynamics,”
 in Theory of Transport Properties of Semiconductor
F3 4,51 5,77 6,50 7,26 Nanostructures (Electronic Materials) E. Schöll, Ed., London:
F4 6,34 5,87 6,90 8,10 Chapman and Hall, 1998, vol. 4, pp. 173–214
 [8] J. P. Conti, M. C. Ceriani, M. A. Juliarena, and E. N. Esteban,
 “Protein and peptide profile of a fluid base for functional drinks
 In Table V shows the average of one repetition; work obtained by fermentation of Lactoserum,” Technological
levels: 1 = lower and 2 = higher Information, vol. 23, no. 2, p. 62, 2012.
 [9] M. M. Arteaga, L. H. C. Molina, P. C. Manuel, et al.
 “Characterization of chanco cheese enriched with whey powder,”
 V. CONCLUSION Rev Chil Nutr, vol. 36, no. 1, pp. 53-62, March 2009.
 [10] D. Acevedo, J. D. C. Jaimes, and C. R. Espitia, “Effect of the
 The optimal formulation for making a functional drink addition of lactoserum to kneaded costeño cheese,” Technological
of Lacto-serum fortified with quinoa was determined by Information, vol. 26, no. 2, pp. 11-16, 2015
30% water, 60% whey, and 10% quinoa flour. [12] [11] J. S. M. Jiménez, “Application of an emulsifying blend in the
 The ingredients with the most significant influence in development of a dairy beverage through the UHT process, with
 partial replacement of milk by sweet whey,” Technological
the elaboration of the functional drink of Lacto-serum Information, vol. 26, p. 33-50, 2019.
enriched with quinoa depending on the sensory [12] J. A. Gómez-Soto, O. J. Sánchez-Toro, and X. Benavides-Salazar,
acceptability determined by the S / R were water (30%) “Patent analysis as an approach to the conceptual design of the
and whey (60%). process for obtaining whey syrup,” Rev. Investig. Desarro. Innov.,
 vol. 7, no. 2, pp. 331-353, 2017.
 The addition of quinoa flour if it affects the sensory [13] R. Blanquicet, C. Flórez, Y. González, E. Meza, and J. Rodrí guez,
acceptability of the product according to the S / R, “Synthesis and properties of films based on chitosan / lactoserum,”
determines that the higher the amount of quinoa flour Polymers: Science and Technology, vol. 25, no. 1, pp. 58-69, 2015.
shows lower the acceptability of the product. [13]
 Copyright © 2021 by the authors. This is an open-access article
 distributed under the Creative Commons Attribution License (CC BY-
 VI. DISCUSSION NC-ND 4.0), which permits use, distribution, and reproduction in any
 The formulations 15%: 7.5%, 15%: 10%, and 11.5%: medium, provided that the article is properly cited, the use is non-
10% were preferred by consumers, which is related to a commercial, and no modifications or adaptations are made.
sweeter and more intense flavor of this formulation. Wilber Quispe
However, in the present study, the higher acceptability of Andahualas 1981 Agronomist, graduated from
the product (4.46) was determined by applying a 5-point the National University José Marí a Arguedas,
hedonic test, when 60% of whey is used, which qualifies master in environmental engineering, with
 extensive experience in beekeeping, university
it as "moderately liked." professor, a doctoral student in environmental
 engineering.
 CONFLICT OF INTERESTS Contribution: Experimentation development
 and data analysis.
 This research was carried out as a contribution to the
knowledge, society, and academic purposes contribute to
 Doris Esenarro
the understanding of the development of new perfume System engineer, professor of Faculty of
essences, "The authors declare that we have no conflicts Environmental Engineering of the University
of interest." Federico Villarreal, professor of the Graduate
 School EUPG. The research topics are focused
 on the environmental pollution generated by
 AUTHOR CONTRIBUTIONS vehicles, sustainable ecotourism constructions,
 A carried out the research design; AB select the and renewable technologies.
 Contribution: supervision of the methodology
materials to experience, AC carried out the creation of

©2021 International Journal of Food Engineering 15
International Journal of Food Engineering Vol. 7, No. 1, June 2021

used Giancarlo Cordova
 Lima 1992, bachelor of engineering in agro-
 Maria Veliz industry, graduated from the National
 Biologist with experience in Planctology and University Federico Villarreal, works in a
 Evaluation of Fishery Resources, Ecology, food processing company
 from the Universidad Nacional Mayor de San Contribution: Data processing
 Marcos, Research Professor, candidate for a
 doctorate in Environment and Sustainable
 Development.
 Contribution: Data analysis technologies.

 Ciro Rodriguez
 Industrial engineer of the National University
 Federico Villarreal, Lima, Peru 1990. He has
 worked in the National Registry since 2003 as
 an associate professor of the Faculty of
 Computer and Electronic Engineering of the
 University Federico Villarreal, professor of
 the Graduate School EUPG and the School of
 Software Engineering of the National
 University Mayor de San Marcos.
Contribution: supervision of the methodology used

©2021 International Journal of Food Engineering 16
You can also read