Fragmentation of plastic objects in a laboratory seawater microcosm
←
→
Page content transcription
If your browser does not render page correctly, please read the page content below
www.nature.com/scientificreports
OPEN Fragmentation of plastic objects
in a laboratory seawater microcosm
Jan Gerritse1*, Heather A. Leslie2, Caroline A. de Tender3,4, Lisa I. Devriese5 &
A. Dick Vethaak2,6
We studied the fragmentation of conventional thermoplastic and compostable plastic items in a
laboratory seawater microcosm. In the microcosm, polyurethane foams, cellulose acetate cigarette
filters, and compostable polyester and polylactic acid items readily sank, whereas polyethylene
air pouches, latex balloons, polystyrene foams and polypropylene cups remained afloat. Microbial
biofilms dominated by Cyanobacteria, Proteobacteria, Planctomycetes and Bacteriodetes grew on
the plastics, and caused some of the polyethylene items to sink to the bottom. Electrical resistances
(ER) of plastic items decreased as function of time, an indication that seawater had penetrated into
microscopic crevices in the plastic that had developed over time. Rate constants for ER decrease in
polyethylene items in the microcosm were similar to tensile elongation decrease of polyethylene
sheets floating in sea, measured previously by others. Weight loss of plastic items was ≤ 1% per year
for polyethylene, polystyrene and polypropylene, 3–5% for latex, polyethylene terephthalate and
polyurethane, 15% for cellulose acetate, and 7–27% for polyester and polylactic acid compostable
bags. The formation of microplastics observed in the microcosm was responsible for at least part of the
weight loss. This study emphasizes the need to obtain experimental data on plastic litter degradation
under conditions that are realistic for marine environments.
Millions of tonnes of plastic waste are estimated to enter the oceans annually1,2. The issue of widespread
plastic waste in the environment is exacerbated by the durability and persistence of these materials in the
environment3–17. In the marine environment plastic breaks up into smaller particles18–20. An estimated 13%
to 32% of the total weight of buoyant plastics in the oceans consists of microplastic particles of 0.3–5 mm in
size14,21,22. It is currently unknown how and at which rates fragmentation of plastic proceeds. We also do not
know to which degree biodegradation contributes to the mineralization of plastic in s eawater23–32. This lack of
data limits our capability to assess and predict the fate and residence times of plastic litter in marine ecosystems.
The present study sought to shed some light on plastic litter fate in a marine microcosm to learn more about the
processes and rates that could be observed.
Fragmentation of plastics is thought to be initiated by polymer chain backbone weathering through exposure
to sunlight (UV), oxidants, hydrolysis and physical shearing, for example through currents, waves, or friction
with sand4,33–40. The oxidation and shortening of polymer chains and leaching of plasticizers makes plastic
materials brittle and stimulates the formation of surface cracks and f ragmentation18,19. As a result micro- and
nanometer sized plastic particles may be released from the surface of larger f ragments19. In time this can result
in the generation of numerous micro- and nanoplastic particles from a single plastic object18. In theory, one bag
composed of two plastic sheets 50 cm × 40 cm × 50 µm thick could generate 20 particles with a volume of 1 mm3,
20 million particles with a volume of 1 µm3 or 20 trillion particles with a volume of 1 n m 3.
The size of the plastic particles is important because it affects their potential hazard to individual organisms,
communities, and ecosystems. Larger plastic litter items may be eaten by or cause entanglement of marine fish,
birds and mammals, while the micro- and nanoplastic particles are more prone to being ingested not only by
large, but also by smaller invertebrates such as mussels and zooplankton with the potential for accumulation in
food chains19,41.
1
Deltares, Unit Subsurface and Groundwater Systems, Daltonlaan 600, 3584 BK Utrecht, The
Netherlands. 2Department of Environment and Health, Vrije Universiteit Amsterdam, De Boelelaan 1085, 1081
HV Amsterdam, The Netherlands. 3Department of Applied Mathematics, Computer Science and Statistics,
Ghent University, Krijgslaan 281 S9, 9000 Ghent, Belgium. 4Plant Sciences Unit, Flanders Research Institute for
Agriculture, Fisheries and Food (ILVO), Burgemeester Van Gansberghelaan 92, 9820 Merelbeke, Belgium. 5Flanders
Marine Institute (VLIZ), InnovOcean Site, Wandelaarkaai 7, 8400 Ostend, Belgium. 6Deltares, Unit Marine and
Coastal Systems, Boussinesqweg 1, 2629 HV Delft, The Netherlands. *email: jan.gerritse@deltares.nl
Scientific Reports | (2020) 10:10945 | https://doi.org/10.1038/s41598-020-67927-1 1
Vol.:(0123456789)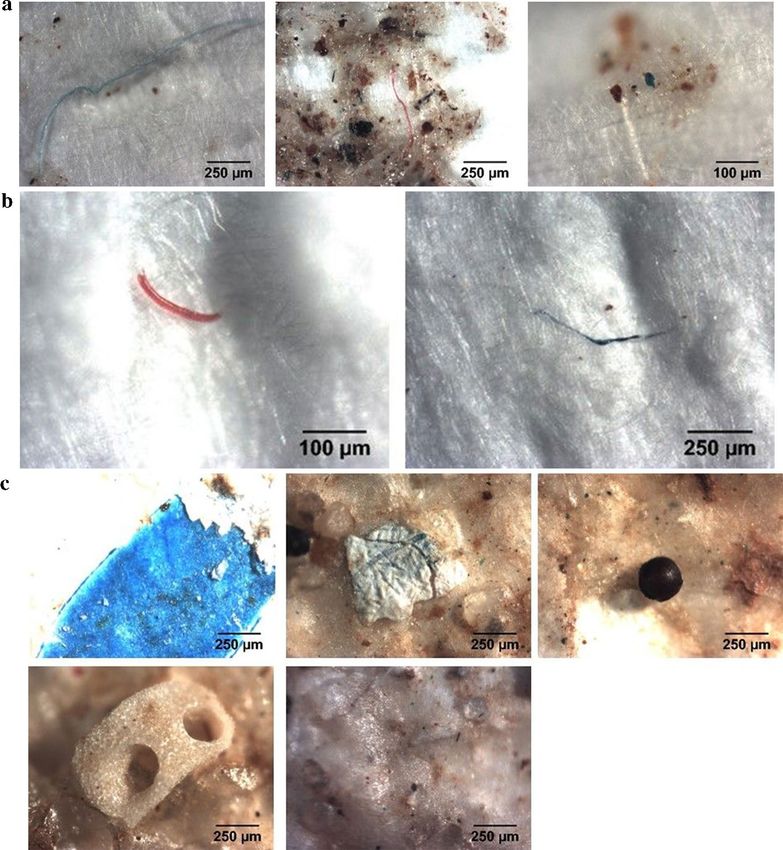
www.nature.com/scientificreports/
Fragmentation also affects plastic litter transport through marine systems because smaller particles are
transported differently horizontally and vertically than larger items42–48. Smaller particles have a relatively large
exposed surface area compared to their volume. This may result in increased degradation rates, adsorption sites
per unit mass and reduced buoyancy (upon biofouling), resulting in transfer of microplastic particles from the
sea surface to the water column or s ediment9,11,14,18,48. The larger specific surface area generated through frag-
mentation increases contact with water with faster leaching or sorption rates for chemicals and additional area
for biofouling49.
In 2018, about 359 million tonnes plastic were produced globally, of which 62 million tonnes in Europe. About
80% consisted of thermoplastics with polymer backbones of polyethylene (PE), polypropylene (PP), polyvinyl-
chloride (PVC), polyurethane (PU), polystyrene (PS) or polyethylene terephthalate (PET)50. The material com-
position, e.g. chain backbone, crosslinking and additives, affects to a high degree the repertoire of mechanisms
and rates of abiotic and biological degradation that can occur. Polymers with a carbon–carbon backbone, high
molecular weight, and few functional groups, such as PE, PP, PS and PVC, are very resistant to degradation9.
Ultraviolet (UV) light from the sun produces breaks in for example PE, PP, PS and PVC polymer chains. But in
marine ecosystems such plastic particles are readily transferred downwards and often become buried in the sedi-
ment. Floating plastic particles become rapidly covered by biofilms, which protect them from UV r adiation51,52
and weigh them down, causing them to sink. The timescale of the mineralization process of most plastic materials
with a carbon–carbon backbone in the marine environment is usually estimated at decades or longer9,24,33,38.
Plastic materials with heteroatoms in the main polymer chain are susceptible to h ydrolysis9. In the marine
environment, cleavage of the ester bonds in PET and PU and amide bonds in nylon can occur through abi-
otic hydrolysis, photolysis and oxidation. In addition, biodegradation of PET and PU may be significant, since
microorganisms that are capable of this process can readily be isolated from the environment, including marine
systems26,27,30,53,54.
Microorganisms in biofilms are sometimes able to catalyze the partial or complete mineralization of plastic
to energy, biomass and inorganic molecules such as carbon dioxide, water, and/or methane, hydrogen and
ammonia21–30,53–61. The biodegradability of plastic materials is usually determined under conditions optimized
for high metabolic rate (temperature, nutrients, pH) such as in sewage sludge, landfill, soil or compost, but not
under conditions which prevail in marine e nvironments57. Therefore, such tests are unreliable indicators of the
fate of plastic items in the sea.
One way proposed to reduce the persistence of plastic objects in the environment is to use polymers that
mineralize more readily through b iodegradation58. Natural resources such as cellulose, starch, polylactic acid
(PLA), and polyhydroxyalkanoates (PHA) are often used for the production of biodegradable p lastics58–60. Inter-
nationally recognized standards, EN 13,432 (European), ASTM 6400 (USA) or ISO 17088 (International) are used
to define and label the biodegradability of plastic m aterials59,60. According to these standards, a plastic product
can be “compostable-labelled” if at least 90% (weight) disintegrates into particles that pass through a 2 × 2 mm
mesh within 3 months and mineralize within 6 months in an industrial composting environment. According to
these laboratory tests, plastic items are mixed with biowaste and typically exposed at temperatures in the range
between 40 and 60 °C. Obviously, these tests do not represent the conditions prevailing in the marine environ-
ment, which points out the need to assess the fragmentation and biodegradation of compostable-labelled plastic
materials in seawater.
Fragmentation rates of plastic litter are likely to vary widely according to environmental conditions and the
plastic material grade in question. The rates will also not be constant in time, as the degradation results from a
variety of independent and interdependent processes (e.g.biodegradation, hydrolysis, photooxidation, erosion,
cracking, etc.) that do not proceed at the same rates and do not stay constant over time. Such rates have only
been roughly estimated in outdoor exposure experiments in seawater, with rare attempts to determine loss of
tensile strength or surface a rea4,19,33,38. The rates at which we can expect plastics to completely mineralize in the
sea are expected to be very low and challenging to empirically measure or quantify61.
Quantifying weathering, fragmentation and mineralization rates of different types of plastic objects in a
marine environment with existing methods is not s traightforward57. We therefore designed a fit-for-purpose
laboratory microcosm experiment to investigate biofouling and fragmentation of a variety of plastic objects
within a relatively short time span. We determined growth and species composition of biofilms on the plastic
items in the microcosm to observe if differences developed depending on the type of material. We hypothesized
that weathering and release of small fragments result in the development of pores and crevices in the surface of
plastic objects in the microcosm, and when these pores are filled with seawater this can be measured as a decrease
of electrical resistance of the plastic objects62,63. Therefore, we tested the effectiveness of electrical resistance of
plastic objects as a simple and fast indicator of plastics weathering and fragmentation. We analyzed weight loss
to determine fragmentation caused by microplastics generation and/or biodegradation of each plastic type, to
test our prediction that plastic products carrying ‘compostable’ labels would fragment faster than conventional
thermoplastics in the microcosm over the course of a one-year experiment.
Results
Once the silicon tubes, PET bottles and fleece, PS coffee cups and the PLA materials were placed in the micro-
cosm, they immediately sank to the bottom because of a higher density than seawater. The PU foams, cigarette
filters, paper coffee cups and compostable plastic bags with registration numbers 7P0059 and 7P0069 became
waterlogged and sank within 4 days. The other plastics, including the HDPE and the LDPE air pouches, latex
balloons, PS foams and PP cups remained afloat on the water surface in the microcosm during the entire experi-
ment (Fig. 1). After one year, only one of the six HDPE and two of the three LDPE air pouches had sunk to the
bottom of the microcosm.
Scientific Reports | (2020) 10:10945 | https://doi.org/10.1038/s41598-020-67927-1 2
Vol:.(1234567890)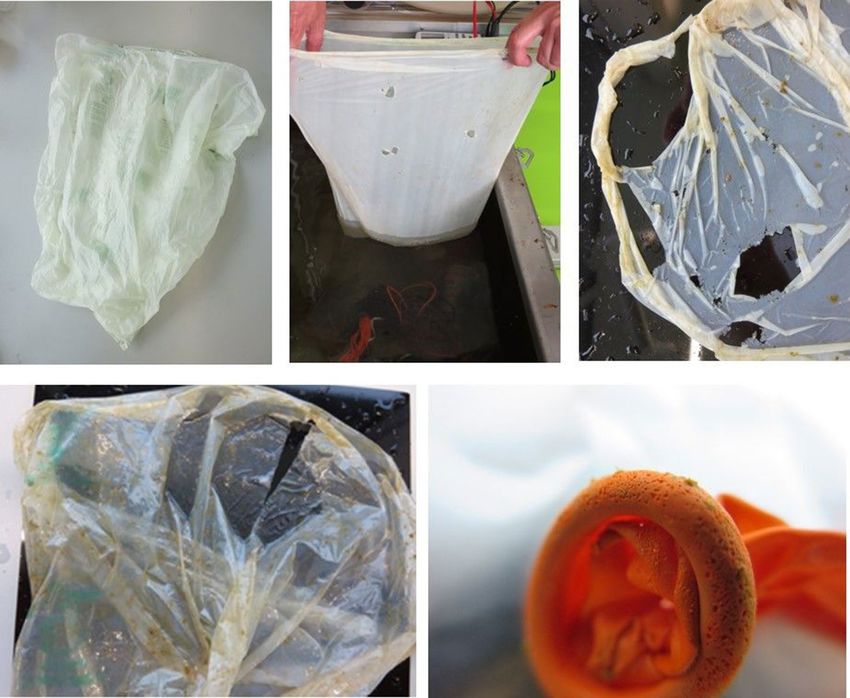
www.nature.com/scientificreports/
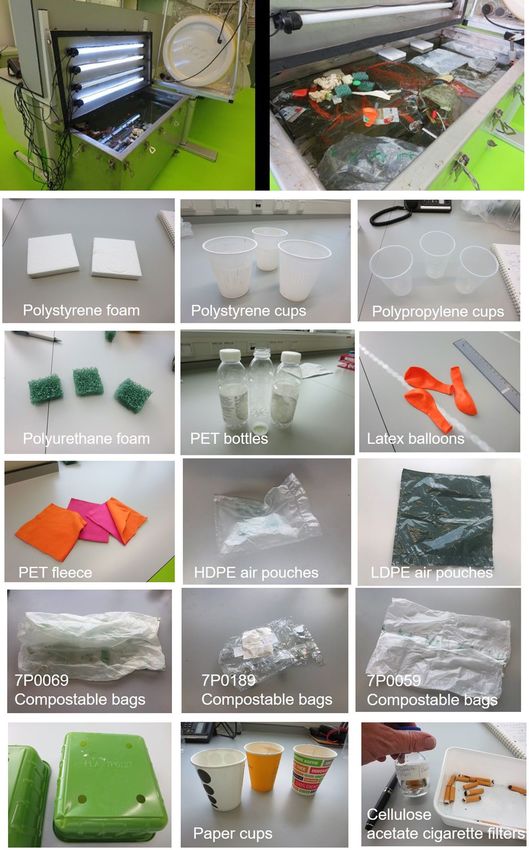
Figure 1. Pictures of (A) the marine microcosm and (B) added plastic objects with different polymer
backbones.
After 378–383 days in the microcosm the volume fraction (Φ) of water in different plastic items (estimated
by triplicate measurements of the capacitance) were 0.79 ± 0.47 (LDPE air pouch), 1.34 ± 0.32 (HDPE air pouch),
Scientific Reports | (2020) 10:10945 | https://doi.org/10.1038/s41598-020-67927-1 3
Vol.:(0123456789)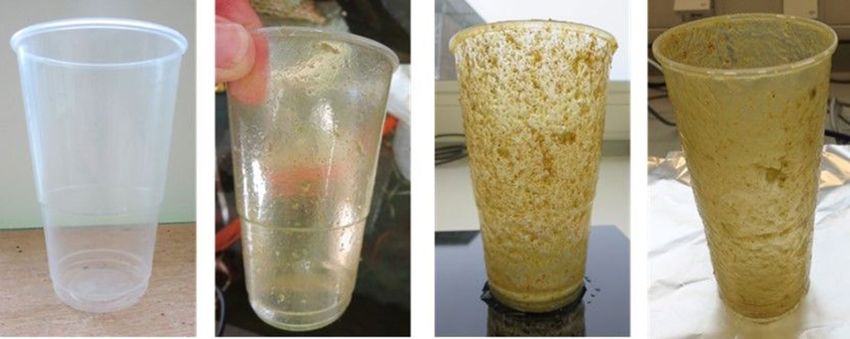
www.nature.com/scientificreports/
Component Material Frequency (Hz) Initial resistance (Ohm) Rate constant (day−1) R2
100 13,682 0.0053 0.75
Air pouch LDPE 120 13,784 0.0053 0.76
1,000 1,989 0.0003 0.08
100 6,594 0.0061 0.85
Air pouch HDPE 120 6,556 0.0061 0.85
1,000 2,483 0.0035 0.74
100 93,384 0.0140 0.92
Coffee cup PS 120 93,186 0.0140 0.91
1,000 86,894 0.0138 0.91
100 4,134 0.0089 0.86
Cup PP 120 4,146 0.0088 0.86
1,000 4,174 0.0088 0.86
100 183,984 0.0144 0.86
Bottle PET 120 187,986 0.0145 0.86
1,000 183,993 0.0145 0.86
100 249,484 0.0165 0.90
Bottle PET 120 251,686 0.0165 0.90
1,000 238,793 0.0164 0.90
100 8,794 0.0045 0.93
Balloon Natural Latex 120 8,976 0.0045 0.93
1,000 9,053 0.0046 0.93
100 61 0.0089 0.84
Compostable postal bag 7P0059 120 62 0.0097 0.84
1,000 64 0.0075 0.96
100 42 0.0145 0.98
Compostable trash bag 7P0069 120 40 0.0137 0.98
1,000 38 0.0142 0.98
Table 1. Initial electrical resistances (ER) of plastic objects, and ER-decrease rate constants determined during
385 days incubation in the microcosm.
1.38 ± 0.39 (PP cup), 1.45 (PET bottle), 2.01 ± 0.11 (PS coffee cup), and 2.18 ± 0.25 (latex balloon). This indicated
the uptake of seawater into the plastic objects during incubation in the microcosm.
Electrical resistance (ER) measurements. The ER of different plastic materials in seawater was meas-
ured in triplicate within 8 days after incubation, and subsequently at 50 to 150-day intervals during one-year
incubation in the microcosm (Table 1). Initially, ER values of the compostable-labelled plastic bags were more
than two log-factors lower than those of the non-compostable plastic items. The highest ER values were found
for the PET bottles. For all plastic items the ER values measured at 100 Hz, 120 Hz or 1,000 Hz decreased during
incubation in the microcosm (Fig. 2). The rate constant at which the ER-values measured at 100 Hz and 120 Hz
decreased ranged from 0.0045 day−1 to 0.0165 day−1, depending on the plastic material (Table 1).
After 378–390 days in the microcosm, the ER values of PP and PS cups and an LDPE air pouch were measured
before and immediately after removing biofilms and washing in demineralized water. We did this in order to
remove seawater from the plastics. After this cleaning and washing, the ER values had increased to the range of
the initial values when we started the microcosm. This indicated that low ER-values were primarily due to the
uptake of seawater by the plastic items.
Fragmentation and weight loss of the plastics. The first effects of microcosm incubation on the plas-
tic material could be observed within the first week of the experiment. First, we observed a change in colour of
the compostable trash bags with registration number 7P0069 from translucent light green into opaque white
after four days of incubation. In addition, cigarette filters started to lose their paper covers.
Within two months many holes of 1 mm to 10 mm diameter appeared in the 7P0069 compostable trash bags
(Fig. 3). Small particles of < 1 mm broke off of the rims of the larger holes. The compostable postal bags with
registration number 7P0059 kept their integrity longer, but some holes of about 1 mm were observed after six
months in the microcosm (Fig. 3).
After 378 days, loss of small crumbles (< 1 mm) was visible around the neck of the latex balloons (Fig. 3). The
compostable PLA food bags and the paper coffee cups however did not show any signs of fragmentation. These
materials did however become fragile and easily disintegrated upon touch. Fragmentation of the PLA bags did
not result in formation of small crumbs, but rather elongated snippets. The other plastic materials showed no
visible fragmentation within one year in the microcosm.
Scientific Reports | (2020) 10:10945 | https://doi.org/10.1038/s41598-020-67927-1 4
Vol:.(1234567890)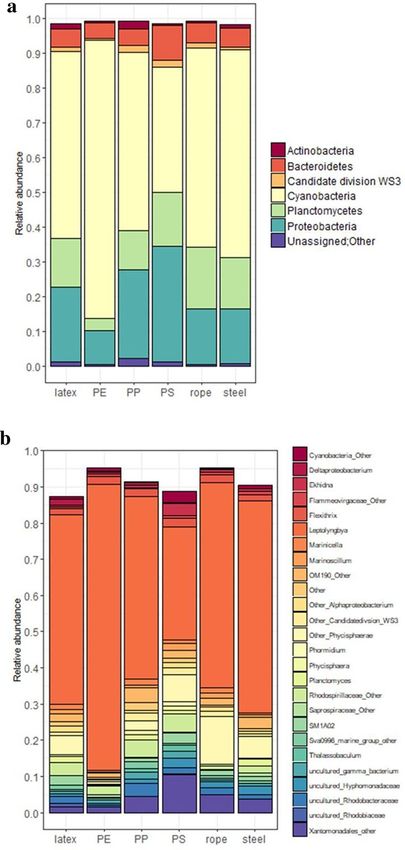
www.nature.com/scientificreports/
Figure 2. Electrical resistances of latex balloons (upper panel), and compostable trash bags 7P0069 (lower
panel), measured at different times during incubation in the microcosm. Electrical resistances were recorded at
100 Hz (□), 110 Hz (∆), or 1,000 Hz (x)0 Hz (o), respectively.
After 378–427 days the plastics were taken from the microcosm and the dry weight of 3 to 12 replicates was
determined after removing the biofilms from the surfaces (Fig. 4). The LDPE and HDPE air pouches, the PS coffee
cup, the PP cup and the PLA food tray had lost less than one percent of their weight (fragmentation rates < 1%
per year). Based on weight loss, the silicon tubes and the PS packaging foam had fragmentation rates of about
1% per year. Fragmentation rates of the PET materials, PUR foam and the latex balloons were between 3 and
5% per year. Higher fragmentation rates, ranging from 7 to 27% per year were found for the compostable bags
and the cigarette filters. The fragmentation rate of the paper coffee cups, as natural cellulose polymer reference,
was about 8% per year.
Microplastics. Qualitative observations with light microscopy revealed that the water samples taken from
the bottom of the microcosm tank contained the highest number and variety of particles, both plastic and
organic matter. Samples of water taken at 25 cm depth contained relatively low amounts of particles, mainly
fibres (Fig. 5). Small plastic fragments were detected mainly in the water from the surface and on the bottom of
the microcosm, indicating materials present in the plastic mixture were generally not neutrally buoyant. Numer-
ous fibers and non-plastic debris were observed in the water samples taken from the surface and bottom of
the microcosm (Fig. 5). In the reference synthetic seawater, only one particle was detected in a 522 mL sample
volume, indicating a very low background level of the incubation seawater compared to the microcosm test.
Biofouling and microbial populations on plastics. Heavy biofouling occurred within several months,
indicating the growth of algae, bacteria and other microorganisms on the surfaces of the plastic materials (Fig. 6).
After 378–427 days in the microcosm, the wet and dry weights of the biofilms growing on 2 to 6 replicates of
plastic items were determined (Table 2). Determination of the weight of biofilms growing on the cigarette fil-
ters, paper coffee cups and PLA food bags was not possible because these materials were too fragile for biofilm
collection. The wet weight measurements indicated the presence of thick slimy biofilm layers on all the compo-
nents added to the microcosm. The dry weight of the biofilms removed from the plastics ranged from 0.068 to
0.459 mg per cm2 of plastic surface exposed to the seawater, which corresponded to biofilm growth rates of 0.063
to 0.441 mg per cm2 per year.
To study the microorganisms in these biofilms, we performed a DNA metabarcoding approach on six sam-
ples, in which we focused on the bacterial community (V3-V4 16S rRNA gene sequencing). First, we checked
the bacterial community diversity (Shannon–Wiener index) and the richness on the basis of the number of
observed operational taxonomic units (OTUs). The lowest number of bacterial OTUs (189) was counted on the
Scientific Reports | (2020) 10:10945 | https://doi.org/10.1038/s41598-020-67927-1 5
Vol.:(0123456789)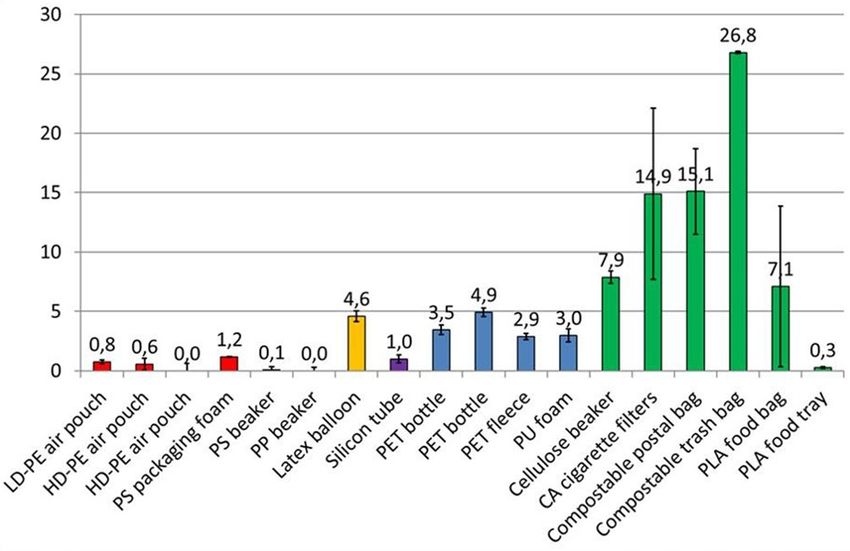
www.nature.com/scientificreports/

                                      Figure 3.  Pictures of fragmentation of compostable trash bag 7P0069 after 0, 57 and 183 days from left to right,
                                      respectively (upper panels), compostable postal bag 7P0059 after 294 days (lower left panel) and latex balloon
                                      after 383 days (lower right panel) in the microcosm.

                                      Figure 4.  Fragmentation rates (% weight loss per year) of objects with different polymer backbones in the
                                      marine laboratory microcosm. Red bars indicate polymers with a backbone with single “C–C” carbon bonds,
                                      orange a backbone with double “C = C” bonds, purple a siloxane backbone, blue a polyester backbone, and green
                                      indicates compostable polymers.

                                      PE sample, which also corresponded to the lowest community diversity (2.02). The number of observed OTUs
                                      ranged between 307 and 452 for the other samples (Table 3). For the diversity, a mean value of 3.63 ± 0.42 was
                                      measured (Table 3). Second, we looked to the community composition on the plastics. Cyanobacteria dominated

          Scientific Reports |   (2020) 10:10945 |              https://doi.org/10.1038/s41598-020-67927-1                                            6

Vol:.(1234567890)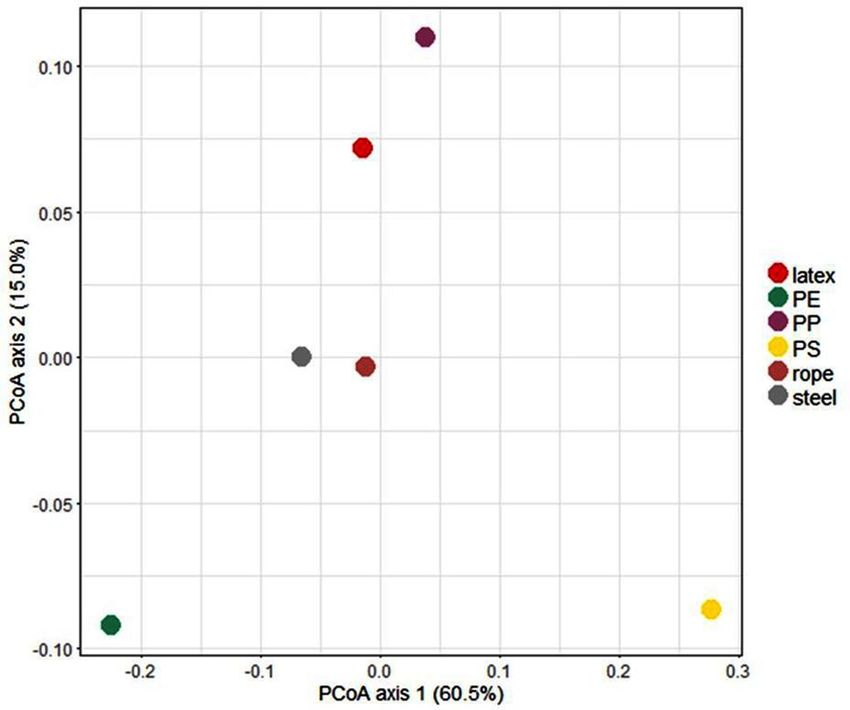
www.nature.com/scientificreports/
Figure 5. Images of microplastics and -debris from the microcosm. a Microdebris from the surface water,
blue fiber (left), red fiber (middle), blue foil (right). b Red (left) and blue (right) fibers detected at 25 cm depth.
c Microdebris from the bottom at 50 cm depth, blue foil (upper left), white foil (upper middle), brown sphere
(upper right), unknown white piece (lower left), and unknown particles (lower right).
in all samples, followed by the phyla Proteobacteria, Planctomycetes and in lesser amount the Bacteriodetes
(Fig. 7A). Analysis on genus level showed that one specific genus, Leptolyngbya, which was assigned to seven
OTUs, dominated the biofilms on all plastic samples and the steel (Fig. 7B). The phyla and genus plots indicated
differences in composition between samples, which are also illustrated by a principal coordinates analysis (PCoA)
plot (Fig. 8). PE, PP and PS bacterial communities phylogenetically differed most from each other. In comparison,
the microbial community of the rope and the steel wall showed the most resemblance.
Discussion
Fragmentation of plastic items can be estimated with a variety of analytical techniques, based on morphological
and rheological changes, or on gravimetric, scanning electron microscopy (SEM), spectroscopic or chromato-
graphic analyses56. Many of these methods destroy the plastic samples during analysis and rely on the availability
of expensive laboratory equipment. We therefore investigated if electrical resistance (ER) measurements can be
applied as a cheap, easy to use, non-destructive alternative. A similar technique, electrochemical impedance
spectrometry (EIS), is used to detect pits in paints and coatings, that are too small to be seen microscopically63,64.
We used a simple setup to measure the ER of plastic objects submerged in seawater. The decrease of ER-values
Scientific Reports | (2020) 10:10945 | https://doi.org/10.1038/s41598-020-67927-1 7
Vol.:(0123456789)www.nature.com/scientificreports/
Figure 6. Biofouling of polypropylene cup, after (from left to right) 0, 57, 183 and 390 days in the microcosm,
respectively.
Biofilm growth rate (mg/cm2/
Component Material Wet weight (mg/cm2) Biofilm dry weight (mg/cm2) year)
Air pouch LDPE 9.6 ± 1.2 0.069 ± 0.029 0.067 ± 0.028
Air pouch HDPE 14.4 ± 0.2 0.129 ± 0.029 0.121 ± 0.028
Air pouch HDPE 22.2 ± 0.6 0.163 ± 0.028 0.154 ± 0.027
Tube Silicon 24.7 ± 2.8 n.d n.d
Packaging foam PS 10.1 ± 7.8 0.115 ± 0.003 0.102 ± 0.003
Coffee cup PS 16.3 ± 1.8 0.195 ± 0.088 0.186 ± 0.084
Cup PP 39.4 ± 1.8 0.311 ± 0.095 0.291 ± 0.089
Coffee cup Cellulose 29.5a n.d n.d
Bottle PET 32.4 ± 2.3 0.398 ± 0.012 0.382 ± 0.011
Bottle PET 38.7 ± 1.6 0.459 ± 0.204 0.441 ± 0.196
Fleece clothing PET 119.9 ± 1.3a n.d n.d
Reticulated foam PU 1.2 ± 0.9 n.d n.d
Balloon Natural latex 17.5 ± 2.9 0.211 ± 0.103 0.199 ± 0.098
Cigarette filters Cellulose acetate 16.5a n.d n.d
Compostable postal bag 7P0059 13.3 ± 4.5 0.068 ± 0.038 0.063 ± 0.035
Compostable trash bag 7P0069 7.07 ± 0.04 n.d n.d
Compostable food bag PLA 44.4 ± 7.9 n.d n.d
Food tray PLA 21.3 ± 11.8 0.261 ± 0.136 0.232 ± 0.121
Table 2. Quantification of biofilms on the plastics. a These materials absorbed a significant amount of water.
Material Observed number of OTUs Shannon–Wiener diversity index
Latex 452 4.15
PE 189 2.02
PP 428 4.07
PS 420 5.02
Rope 307 3.05
Biofilm from steel 390 3.49
Table 3. Number of operational taxonomic units (OTUs) and Shannon–Wiener diversity index obtained from
bacterial 16S rRNA gene amplicons from biofilms from different materials exposed in the microcosm.
observed at low AC-frequencies (100 Hz–1,000 Hz) as a function of time is in line with EIS analyses of coatings.
Capacitance measurements, and the fact that after washing in demineralized water the ER restored to initial
high values, confirm that the ER measurements indicate penetration of water and ions into the plastics. One
Scientific Reports | (2020) 10:10945 | https://doi.org/10.1038/s41598-020-67927-1 8
Vol:.(1234567890)www.nature.com/scientificreports/
Figure 7. Relative abundance of 16S rRNA genes of biofilm samples from the microcosm (A) phylum level (B)
genus level. Figures show only those phyla/genera, which represent at least 1% of the total community in at least
one sample.
might hypothesize that this is correlated to the release of plastic particles from the macroplastic objects in the
microcosm. The decrease of tensile elongation at break is a common parameter used to asses polymer degrada-
tion rates19,33,65. Interestingly, the degradation rate constant of 0.005 day−1, obtained by ER measurements in our
laboratory microcosm at 24 °C for LDPE degradation, is in the range of those obtained by Andrady (1993) for
different types of control LDPE sheets floating in outdoor sea experiments, using tensile elongation measure-
ments. Degradation rate constants of LDPE sheets floating in sea at Seattle, at mean temperature of 15 °C, were
0.002–0.004 day−1, and at sea near Miami, with mean temperature of 29 °C, they were 0.004–0.008 day−1. Obvi-
ously, fragmentation rates obtained in our experiment should not be directly translated to those at sea, since in the
laboratory environment temperature, light, water movement, biodiversity, chemical composition of the seawater
e.g. due to metal leaching from the stainless-steel vessel are different. Our results suggest that ER-measurements
may be a promising cheap and easy technique to readily monitor the initial steps of the degradation of plastics
in water. Additional testing of ER-measurements, for example in freshwater and other environments is essential
to asses full application possibilities of this method.
Scientific Reports | (2020) 10:10945 | https://doi.org/10.1038/s41598-020-67927-1 9
Vol.:(0123456789)www.nature.com/scientificreports/
Figure 8. PCoA plot of the phyla and genus, indicating differences in bacterial population composition
between biofilm samples from different objects.
Once holes became visible in the plastic objects, ER measurements could no longer be used to measure fur-
ther degradation. The holes created a direct seawater connection between the electrode inside, and the electrode
outside the plastic object, with very low electrical resistance.
As an indicator of fragmentation, we determined weight loss of the plastic objects after 378–427 days in the
microcosm. The observation that plastic materials composed of polymers with a carbon–carbon “C–C” backbone,
PE, PS and PP, appeared most recalcitrant with a maximum fragmentation rate of 1% per year may be due to the
fact that their degradation is initiated through abiotic photolytic oxidation by UV radiation9,39. The spectrum of
the fluorescent lamps in our microcosm included UV light, but the rapid and extensive covering with microbial
biofilms may have protected the plastic objects from photolytic degradation, resulting in fragmentation and
measurable weight loss. In comparison, the latex balloons had fragmentation rates of about 5% per year in the
marine microcosm. Natural latex is a complex coagulation of about 90% polyisoprene with carbohydrates, lipids,
proteins, alkaloids, organic acids and amino acids66. The latex polymer consists of a backbone of isoprene mono-
mers connected with C=C double bonds. Previous studies indicated that solar radiation as the most important
environmental variable for fragmentation of latex films in freshwater and marine outdoor microcosms67. But
in addition, latex polymers are known to be degraded by a variety of microorganisms, including marine ones68.
Lambert et al. found that latex film exposed in an outdoor microcosm with artificial seawater lost weight at a
rate of 50% in 87 days. The big difference to the fragmentation rates of latex material obtained in our microcosm
experiment can be related to several factors: (i) a thicker membrane of our latex balloons (0.3 mm) versus the
latex films (0.08 mm), (ii) exposure to a lower UV dose in the laboratory microcosm (e.g. biofouling), opposed
to the outdoor microcosms, (iii) different composition or cross bonding of the latex polymers, and/or (iv) pres-
ence of plasticizers and UV absorbers in our balloons. The abundant presence of latex balloons in marine litter
suggests fragmentation rates at least are not higher than rates of littering i nput69. This underpins the importance
of testing degradation of real-life consumer plastic materials under realistic marine conditions. The fragmenta-
tion rates of PET and PU objects were between 3 and 5% per year. In PET and PU polymers the monomers are
connected through ester bonds, which are susceptible to photo-oxidation, hydrolysis and b iodegradation9,25,27.
Hydrolysis and biodegradation may have caused further weight loss of PET and PU, than that of carbon–car-
bon backbone polymers. We observed the greatest weight losses for the cellulose-containing objects and the
compostable plastics. Cellulose and cellulose acetate degrading microorganisms are abundant in the marine
environment70,71. Moran et al. reported similar rates of weight loss of cellulosic waste in microcosms with ocean
water, as we found for the cellulose coffee cups (8% per year) and the cellulose acetate cigarette filters (15% per
year). Degradation of the disposable bags, labelled compostable according to the EN 13432 standard, occurred,
but still 73% to 93% of their original weight remained after a year in the microcosm. Moreover, weight loss of the
PLA food trays (fragmentation rate < 0.3% per year) was insignificant. The difference between weight loss of the
PLA bags and the PLA food trays is most likely caused by the different PLA grades used for the production of
these items58. This demonstrates that the current standard tests based on composting do not reflect the realistic
(bio)degradation of plastic materials in the marine environment.
After a year, we detected numerous microplastic particles in the surface water and on the bottom of the
microcosm. The synthetic seawater used to prepare the microcosm contained insignificant amounts of micro-
plastics, which indicates fragmentation as a major cause for weight loss of the plastic objects in the microcosm.
We did not quantify the extent to which nano- and microplastics formation, and/or mineralization, respectively,
contributed to weight loss of the individual plastic items.
Biofilms on the plastics were visible within a month and increased during the experiment, indicating the
presence of active growing microbial communities. The biofilm mass on the plastic materials in the microcosm
(0.068–0.459 mg dry weight/cm2) was much lower than that on plastic objects which had been submerged for
Scientific Reports | (2020) 10:10945 | https://doi.org/10.1038/s41598-020-67927-1 10
Vol:.(1234567890)www.nature.com/scientificreports/
about one year in the Bay of Bengal, India (28–34 mg dry weight/cm2)34,51. Apparently, microbial growth on
plastic objects in our closed microcosm system was less abundant than that on plastics exposed in the sea. The
fact that one HDPE and two LDPE air pouches sunk after a year in the microcosm is in line with the observation
that biofilms can increase the density of plastic objects, causing them to s ink52,72. The impact of such ballasting
on microplastics, with high surface area versus volume ratio, could be higher than on macroplastics. Recently,
it was suggested that there appears to be a fast removal of plastic fragments smaller than a millimeter from the
ocean surface water11,14,73. These experiments are congruent with the assumption that ballasting by microbial
biofilms may be one explanation of this o bservation19,74,75.
Bacterial species richness was lowest in biofilms growing on a PE film and highest on the latex balloon.
Possibly, the presence of many different organic biodegradable substrates in natural latex might have enhanced
biodiversity on the b alloon66. In comparison, the composition of the microbial communities growing on the
plastic rope and the stainless-steel wall of the microcosm vessel showed the most resemblance. The observation
that microbial populations on PS contained less phototrophs and differed most from those on the other plastics
may be explained by the fact that PS items float on the water, and the sample for biofilm analysis was taken from
the relatively dark underside. The biofilms on the plastic items in our microcosm appear to be significantly less
diverse than those observed on plastic objects obtained from marine environments75–78. This may reflect the
relatively simple and homogeneous setting of our artificial laboratory system. The dominance of phototrophic
cyanobacteria was obviously sustained by the daily 12/12 h day/night cycle and the clear seawater, allowing the
light to easily reach to the bottom of the microcosm. The fact that about 50% of the 16S rRNA genes detected
corresponded to Leptolyngbya is significant, since this genus contains pathogenic species. This emphases the
observation of other researchers, that plastic objects can act as habitats for pathogenic m icroorganisms75,77,79,80.
There is a strong need to understand what happens to plastic litter that is entering our oceans. Monitoring
campaigns indicate that the amount of plastic found at the sea surface is not increasing proportionally to the
estimated inputs of plastic litter and that there appears to be a short residence time of micro-meter sized particles
at the sea s urface5,6,11,14,21,22,81,82. It has been suggested that the microplastic particles in the oceans may degrade
at faster rates when they become smaller, and that they continue to fragment into more hazardous nanoplastics,
which may be too small to detect with current sampling techniques19,83. Recently it was confirmed that parti-
cles in the nanometer range are indeed formed during degradation of PS sheets84. We showed that a decrease
in ER values may correlate to the formation of sub-microscopic pores, and thus can indicate the formation of
nanoparticles. ER measurements provide thus an interesting tool to quantify the initial stage of fragmentation
of plastics in seawater.
Biodegradation of compostable plastic objects in our microcosm occurred at much lower rates than in inter-
nationally recognized standard composting tests. The main reason may be that during composting tests deg-
radation processes are routinely examined under optimized conditions that are not representative for marine
environments. Our study and accumulating research indicates that even plastic materials labelled as compostable,
which are meant to reduce accumulation of plastic waste, may not biodegrade and mineralize within an accept-
ably short timeframe in marine e cosystems85. Solid experimental data on long term degradation of plastic litter
should therefore be collected in laboratory micro- and mesocosm systems under conditions that are realistic for
the marine environment in order to best inform our understanding of marine plastic degradability.
Materials and methods
Setup of the marine microcosm. A stainless-steel vessel (0.6 m × 0.6 m × 1.2 m) was filled with 350 L
artificial seawater (Fig. 1). The synthetic seawater was prepared by adding WesPro sea salt (www.wesdijk.nl) to
demineralized water to obtain an electrical conductivity (EC) of 46 mS/cm on a WTW LF 197 EC meter (WTW
Wissenschaftlich Technische Werkstätten, Weilheim, Germany). At about 10 cm below the surface, the seawater
in the vessel was recirculated at 6.7 L/min with a pump (Velda Aquarius Universal 600, Groenrijk Malkenscho-
ten, Apeldoorn, Netherlands) to create a mild constant water flow. Four fluorescent lamps (30-W, length 90 cm)
were installed in the stainless-steel lid of the vessel to expose the plastics to simulated daylight, including UV-a
and UV-b. The fluorescent lamps were two Zoo Med Ocean Sun T8 lamps, each generating 70 photons/m2/s, and
two Zoomed Repti Sun 5.0 UVB lamps, each generating 60 photons/m2/s on the water surface of the microcosm
(www.smulders.nl). Light intensities were measured with a LI-COR LI-192 underwater quantum sensor with
400–700 nm quantum response, connected to a LI-250 A light meter (CaTec b.v., Wateringen, The Netherlands).
The microcosm was subjected to a 12:12 h light and dark regime. The temperature of the seawater was 24 ± 1 °C
throughout the experiment. The microcosm was closed with a stain-less steel lid, to limit water evaporation and
contamination with microplastics from the ambient air.
The microcosm was inoculated with 9 L seawater (conductivity 46 mS/cm) and a variety of plastic materials
and stones, collected three days earlier at the North Sea beach at Katwijk aan Zee, The Netherlands. Different
types of plastic items with different polymer backbones from household items were collected and added to
the marine microcosm, in order to simulate a plastic contaminated marine environment (Fig. 1). The plastics
included a selection of conventional thermoplastic and compostable plastic products according to the DIN EN
13,432 standard. Of each material subsamples were stored at 4 °C in the dark. A 5 cm cut was made in the pack-
ing material air pouches, to let the air escape before they were added to the microcosm.
Electrical resistance (ER) measurements. Electrical resistance (ER) values (Ohm) of plastic materials
were measured with a Voltcraft LCR 300 m (www.conrad.nl). The LCR-meter was connected to two 20 cm long
messing electrodes, which were inserted inside Viton rubber tubing and fixed in a butyl rubber stopper. The elec-
trode tips were positioned 1 cm apart from each other. At the tip of the electrodes, 2 cm messing was exposed to
the seawater. For ER measurements one electrode tip was inserted in seawater inside a plastic bag, cup or bottle,
Scientific Reports | (2020) 10:10945 | https://doi.org/10.1038/s41598-020-67927-1 11
Vol.:(0123456789)www.nature.com/scientificreports/
respectively. The other electrode was positioned at the outside in the seawater of the microcosm. In this way, the
ER of the plastics were measured by recording the resistance between the electrodes at different frequencies AC
current: 100, 120 and 1,000 Hz, respectively. ER measurements at higher frequencies of 10.000 or 100.000 Hz,
respectively, were not consistent and not used for this study. The ER measurements were done in the serial
modus (Rs) of the LCR meter. The ER measurements were started 8 days addition after of the plastic objects to
the microcosm and at 2 to 5 months’ intervals thereafter. The ER measurements were routinely recorded in trip-
licate, and the coefficient of variation based on 75 triplicate measurements was 25 ± 2%. The plastics ER values
were calculated as follows:
ERplastic = ERplastic·emerged·in·seawater − ERseawater
Volume fraction (Φ) of water. The uptake of water by plastics was estimated by measuring the capaci-
tance (C in nF) immediately after they were added (C start) and just before they were removed (C end) from the
microcosm. The volume fraction of water of the plastics (Φ) was subsequently assessed according to the empiri-
cal relation of Brasher and Kinsbury86:
log(C end/C start)
�=
log80
Values of water fractions are averages ± standard deviations of capacitance measurements obtained at 100,
120 and 1,000 Hz, respectively.
Dry weight analyses and fragmentation rates. The weight of a selection of the plastic objects was
measured before and after 378–427 days of incubation in the microcosm (Table 4). After removal from the
microcosm, they were first drained for one minute before measurement of the wet weight of the plastics with the
biofilms. Subsequently, the biofilms were carefully removed with a nylon brush34. Then the plastics were rinsed
with tap water and incubated overnight in demineralized water to remove traces of seawater salts. Finally, the
plastics were swept with a tissue and dried on aluminum foil in a stove at 40 °C, typically for 2 to 5 days, until
constant weight. Plastics of more than 1 g were weighed on a Mettler PM 4600 balance, others on a Mettler AE
200 balance (Mettler Toledo, Tiel, Netherlands). The weight loss of 0 – 0.1% found for some PE and PP items
confirmed that the biofilm removal procedure did not cause significant degradation of these plastic objects. The
percentages loss of dry weight of the plastics were calculated subsequently as:
W0 − Wt
Dry · weight · loss(%) =
W0 ∗ 100
where W0 is the initial dry weight of a plastic sample before incubation, and Wt the dry weight determined after
“t” days incubation in the microcosm. Fragmentation rates were subsequently expressed as % dry weight loss
per year.
Biofilm removal with a toothbrush from the compostable plastic bags, labelled with registration numbers
7P0069, 7P0189 and 7P0204, respectively, was not possible without fragmenting these materials. Therefore, the
biofilms from the latter plastics were removed by incubation, with 30% H 2O2, overnight at 25 °C, and shaken at
100 rpm. Weight losses of triplicate subsamples of unexposed sheets of 7P0069 and 7P0189 by H2O2 treatment
were 1.92 ± 1.0% and 0.094 ± 0.232%, respectively. These values were used as correction factors for dry weight
loss analyses of the compostable plastic bags. Weight loss of the cigarette filters was corrected for the loss of their
paper covers in the microcosm, which accounted for 49 ± 20% of their mass.
The biofilm material removed from the plastics was suspended in 100 mL autoclaved synthetic seawater and
stored it at 4 °C in the dark for further analyses. The dry weight of the biofilms was determined by filtration of
25 mL subsamples of the biofilm suspensions on pre-weighed cellulose acetate filters with a diameter of 47 mm
and a pore size of 0.45 µm (www.merckmillipore.com). The filters were dried in a stove at 40 °C for 3 days until
constant weight.
Microplastics. Samples were collected at 389 days after plastic addition to the microcosm. For microplastic
sampling, 500 mL Erlenmeyer flasks were washed and immediately sealed with aluminum foil. Water samples
(approx. 500 mL each) in triplicate were collected from the left, the middle and the right sections of the micro-
cosm. Samples of buoyant microplastics were obtained by holding the opening of the Erlenmeyer flasks about
2 mm below the water surface. Three water samples were collected by opening the flasks 25 cm below the water
surface. Samples at the bottom (50 cm depth) were withdrawn with a 100 mL glass syringe (Sanitex Eterna-Matic
interchangeable) moving slowly over the bottom of the microcosm. The samples were stored at 4 °C in the dark.
Microplastic particles were filtered from the water samples over a Whatman glass filter (diameter 47 mm, pore
size 0.2 µm) and then rinsed with 30 mL H 2O2 (30%) followed by 30 mL MilliQ® analytical grade water accord-
ing to Leslie et al.87.
Identification of microbial populations. Five plastic objects and one biofilm sample scraped from the
steel wall with a 50 mL Greiner centrifuge tube (VWR International B.V., Amsterdam, Netherlands) were taken
665 days after starting the microcosm. The samples were kept at − 80 °C until DNA extraction and 16S rRNA
gene metabarcoding76,78. DNA was extracted using the Powersoil DNA isolation kit (MOBIO Laboratories,
Carlsbad, CA) according to the manufacturer’s instructions. The DNA extracts of all samples were stored at
Scientific Reports | (2020) 10:10945 | https://doi.org/10.1038/s41598-020-67927-1 12
Vol:.(1234567890)www.nature.com/scientificreports/
Weight before incubation
Component Material Surface area (cm2)a Dimension (mm) (g ±SD) n Days in microcosm
Air pouch Polyethylene (LDPE) 1714 210 × 204 3.330 ± 0.000 3 378
Air pouch Polyethylene (HDPE) 1,041 205 × 127 1.087 ± 0.012 3 389
Air pouch Polyethylene (HDPE) 1,024 200 × 128 1.450 ± 0.000 3 385
Tube Silicon 50 100 × ɸ10 4.537 ± 0.100 2 400
Packaging foam Polystyrene (PS) 272 100 × 100 × 18 1.495 ± 0.035 2 414
Coffee cup Polystyrene (PS) 339 82 × top ɸ70 × bottom ɸ47 3.957 ± 0.060 3 383
Cup Polypropylene (PP) 474 120 × top ɸ75 × bottom ɸ50 5.053 ± 0.085 3 390
Coffee cup Paper (cellulose) 337 82 × top ɸ74 × bottom ɸ48 4.773 ± 0.015 3 418
Bottle Polyethylene terephthalate (PET) 806 200 × ɸ65 19.240 ± 0.283 2 380
Bottle Polyethylene terephthalate (PET) 761 220 × ɸ65 22.625 ± 0.148 2 381
Fleece clothing Polyethylene terephthalate (PET) 900 150 × 150 9.037 ± 0.396 3 411
Reticulated foam Polyurethane (PU) 9500b 50 × 50 × 19 1.297 ± 0.059 3 412
Natural latex (about 90% cis-
Balloon 99 100 × 45 × 0.3 1.720 ± 0.046 3 386
1,4-polyisoprene)
Cellulose acetate in epichlorhy-
Cigarette filters 6.3 25 × 8 0.253 ± 0.043 13 418
drin resin
7P0059 (blend of about 50%
Compostable postal bag maize starch and 50% synthetic 2,926 331 × 221 × 0.04 3.070 ± 0.361 3 397
polyester)
7P0069 (made of compostable
Compostable trash bag 8,600 410 × 450 9.077 ± 0.072 3 411
materials)
1,056 230 × 165
7P0189 Poly lactic acid (PLA
Compostable food bag 1518 265 × 245 4.258 ± 1.666 3 427
film)
2,597 220 × 120
7P0204 Poly lactic acid (PLA
Compostable food bag 1,800 225 × 200 2.300 1 427
film)
Food tray 7P0127 Poly lactic acid (PLA) 535 125 × 115 × 42 7.975 ± 0.219 2 412
Table 4. Plastic objects with different polymer backbones added to the vessel, which were used for weight-
loss analyses. a This includes both the inside and the outside of the plastic surfaces exposed to the seawater.
b
According to a volume of 47.5 cm3 and specific surface area of 200 m2/m3 of the foam (www.velda.com).
− 20 °C until further processing. The extracted DNA was used for bacterial (V3-V4 16S rRNA gene) taxonomic
screening through amplicon sequencing using the Illumina technology (Illumina, San Diego, CA, USA). Frag-
ments were amplified and extended with Illumina specific adaptors by using an amplification and dual-index
PCR successively (detailed description in De Tender et al.). Each PCR step was followed by a PCR product
clean-up using the CleanPCR reagent kit (MAGBIO, Gaithersburg, MD, USA). Quality of the final libraries was
checked using the Qiaxcel Advanced with the Qiaxcel DNA High Resolution kit (QIAGEn, Germantown, MD,
USA) and concentrations were measured using the quantus double-stranded DNAassay (Promega, Madison,
WI, USA). The final barcoded libraries of each sample were diluted to 10 nM and equally pooled. The resulting
library was sequenced on an Illumina MiSeq 2 × 300 bp paired-end by Macrogen (Seoul, South Korea), using
30% PhiX DNA as spike-in. Demultiplexing of the amplicon dataset and barcode removal was done by the
sequencing provider. The raw sequence data is available in the NCBI Sequence Read Archive under the accession
number PRJNA3743322. The sequence read processing was done as described in detail i n76.
Statistical analysis. OTU tables of the 16S V3-V4 rRNA gene amplicon sequencing were analyzed using
the QIIME software package (v1.9.0)88. Taxonomy was assigned with the script “assign_taxonomy.py” using the
uclust method considering maximum 3 database hits, with the silva v119 97% rep set (provided by QIIME) as
reference for the bacterial sequences and UNITE v7 (dynamic) for fungal sequences89–91. For the analysis of the
bacterial populations, both community diversity and composition were studied. To study community diversity,
data was rarefied at 20,000 sequences. Based on this rarefied data, the number of observed OTUs and the Shan-
non–Wiener diversity index were calculated as an estimation of the community’s richness and diversity. Total
community composition was analyzed using the multivariate analysis of the specific R package vegan (version
2.3–2)92. The dissimilarity matrix, based on the Bray–Curtis dissimilarity index, was calculated from the OTU
table as generated by Usearch for bacterial sequences. This Bray–Curtis dissimilarity matrix was used as input
for the Principal Coordinate Analysis (PCoA).
Data availability
All sequence data of this study is available in the NCBI Sequence Read Archive under the accession number
PRJNA3743322.
Received: 24 March 2020; Accepted: 15 June 2020
Scientific Reports | (2020) 10:10945 | https://doi.org/10.1038/s41598-020-67927-1 13
Vol.:(0123456789)www.nature.com/scientificreports/
References
1. MacArthur, D. E. Beyond plastic waste. Science 358, 843 (2017).
2. Jambeck, J. R. et al. Plastic waste inputs from land into the ocean. Science 347, 768–771 (2015).
3. Allsopp, M., Walters, A., Santillo, D. & Johnston, P. Plastic Debris in the World’s Oceans (Greenpeace, Amsterdam, 2006).
4. Barnes, D. K. A., Galgani, F., Thompson, R. C. & Barlaz, M. Accumulation and fragmentation of plastic debris in global environ-
ments. Philos. Trans. R. Soc. Lond. B 364, 1985–1998 (2009).
5. Law, K. L. et al. Plastic accumulation in the North Atlantic Subtropical Gyre. Science 329, 1185–1188 (2010).
6. Law, K. L. et al. Distribution of surface plastic debris in the Eastern Pacific Ocean from an 11-year data set. Environ. Sci. Technol.
48, 4732–4738 (2014).
7. Sheavly, S. B. & Register, K. M. Marine Debris & Plastics: environmental Concerns, Sources, impacts and solutions. J. Polym.
Environ. 15, 301–305 (2007).
8. Ryan, P. G. & Moloney, C. L. Marine litter keeps increasing. Nature 361, 23 (1993).
9. Gewert, B., Plassmann, M. M. & MacLeod, M. Pathways for degradation of plastic polymers floating in the marine environment.
Environ. Sci. Process. Impacts 17, 1513–1521 (2015).
10. Beverloo, R., Bijsterveldt, M. V., Beentjes, T., Laurijsse, R. & Schouten, K. The Great Pacific Garbage Patch (National Geographic
Society, Washington, DC, 2010).
11. Cozar, A. et al. Plastic debris in the open ocean. Proc. Natl. Acad. Sci. USA 111, 10239–10244 (2014).
12. Cózar, A. et al. Plastic Accumulation in the Mediterranean Sea. PLoS ONE 10, e0121762 (2015).
13. Derraik, J. G. B. The pollution of the marine environment by plastic debris: A review. Mar. Pollut. Bull. 44, 842–852 (2002).
14. Eriksen, M. et al. Plastic pollution in the World’s Oceans: more than 5 trillion plastic pieces weighing over 250,000 tons afloat at
sea. PLoS ONE 9, e111913 (2014).
15. Eriksson, C., Burton, H., Fitch, S., Schulz, M. & van den Hoff, J. Daily accumulation rates of marine debris on sub-Antarctic island
beaches. Mar. Pollut. Bull. 66, 199–208 (2013).
16. Corcoran, P. L., Biesinger, M. C. & Grifi, M. Plastics and beaches: A degrading relationship. Mar. Pollut. Bull. 58, 80–84 (2009).
17. Galgani, F. et al. Litter on the sea floor along European coasts. Mar. Pollut. Bull. 40, 516–527 (2000).
18. Ter Halle, A. et al. Understanding the fragmentation pattern of marine plastic debris. Environ. Sci. Technol. 50, 5668–5675 (2016).
19. Andrady, A. L. Microplastics in the marine environment. Mar. Pollut. Bull. 62, 1596–1605 (2011).
20. Jahnke, A. et al. Reducing uncertainty and confronting ignorance about the possible impacts of weathering plastic in the marine
environment. Environ. Sci. Technol. Lett. 4, 85–90 (2017).
21. Koelmans, A. A., Kooi, M., Law, K. L. & Van Sebille, E. All is not lost: Deriving a top-down mass budget of plastic at sea. Environ.
Res. Lett. 12, 114028 (2017).
22. Lebreton, L., Egger, M. & Slat, B. A global mass budget for positively buoyant macroplastic debris in the ocean. Sci. Rep. 9, 1–10
(2019).
23. Birke, J., Röther, W. & Jendrossek, D. Latex clearing protein (Lcp) of Streptomyces sp. STRAIN K30 is a b -type cytochrome and
differs from rubber oxygenase A (RoxA) in its biophysical properties. Appl. Environ. Microbiol. 81, 3793–3799 (2015).
24. Bonhomme, S. et al. Environmental biodegradation of polyethylene. Polym. Degrad. Stab. 81, 441–452 (2003).
25. Howard, G. T. Biodegradation of polyurethane: A review. Int. Biodeterior. Biodegrad. 49, 245–252 (2002).
26. Russell, J. R. et al. Biodegradation of polyester polyurethane by endophytic fungi. Appl. Environ. Microbiol. 77, 6076–6084 (2011).
27. Rutkowska, M., Krasowska, K., Heimowska, A., Steinka, I. & Janik, H. Degradation of polyurethanes in sea water. Polym. Degrad.
Stab. 76, 233–239 (2002).
28. Shah, A. A., Hasan, F., Hameed, A. & Ahmed, S. Biological degradation of plastics: A comprehensive review. Biotechnol. Adv. 26,
246–265 (2008).
29. Sudhakar, M., Doble, M., Murthy, P. S. & Venkatesan, R. Marine microbe-mediated biodegradation of low- and high-density
polyethylenes. Int. Biodeterior. Biodegradation 61, 203–213 (2008).
30. Sudhakar, M., Priyadarshini, C., Doble, M., Sriyutha Murthy, P. & Venkatesan, R. Marine bacteria mediated degradation of nylon
66 and 6. Int. Biodeterior. Biodegrad. 60, 144–151 (2007).
31. Volova, T. G. et al. Biodegradation of polyhydroxyalkanoates (PHAs) in tropical coastal waters and identification of PHA-degrading
bacteria. Polym. Degrad. Stab. 95, 2350–2359 (2010).
32. Zheng, Y., Yanful, E. K. & Bassi, A. S. A review of plastic waste biodegradation. Crit. Rev. Biotechnol. 25, 243–250 (2005).
33. Andrady, A. L., Pegram, J. E. & Song, Y. Studies on enhanced degradable plastics. II. Weathering of enhanced photodegradable
polyethylenes under marine and freshwater floating exposure. J. Environ. Polym. Degrad. 1, 117–126 (1993).
34. Artham, T. et al. Biofouling and stability of synthetic polymers in sea water. Int. Biodeterior. Biodegradation 63, 884–890 (2009).
35. Cole, M. et al. Isolation of microplastics in biota-rich seawater samples and marine organisms. Sci. Rep. 4, 4528 (2014).
36. Cooper, D. A. & Corcoran, P. L. Effects of mechanical and chemical processes on the degradation of plastic beach debris on the
island of Kauai, Hawaii. Mar. Pollut. Bull. 60, 650–654 (2010).
37. Ivar do Sul, J. A. & Costa, M. F. The present and future of microplastic pollution in the marine environment. Environ. Pollut. 185,
352–364 (2014).
38. O’Brine, T. & Thompson, R. C. Degradation of plastic carrier bags in the marine environment. Mar. Pollut. Bull. 60, 2279–2283
(2010).
39. Singh, B. & Sharma, N. Mechanistic implications of plastic degradation. Polym. Degrad. Stab. 93, 561–584 (2008).
40. Song, Y. K. et al. Combined effects of UV exposure and mechanical abrasion on microplastic fragmentation by polymer types.
SETAC Eur. 1–2 (2015).
41. Wesch, C., Bredimus, K., Paulus, M. & Klein, R. Towards the suitable monitoring of ingestion of microplastics by marine biota: a
review. Environ. Pollut. 218, 1200–1208 (2016).
42. Cole, M., Lindeque, P., Halsband, C. & Galloway, T. S. Microplastics as contaminants in the marine environment: a review. Mar.
Pollut. Bull. 62, 2588–2597 (2011).
43. Farrell, P. & Nelson, K. Trophic level transfer of microplastic: Mytilus edulis (L.) to Carcinus maenas (L.). Environ. Pollut. 177, 1–3
(2013).
44. Goldstein, M. C. & Goodwin, D. S. Gooseneck barnacles (Lepas spp.) ingest microplastic debris in the North Pacific Subtropical
Gyre. PeerJ 1, e184 (2013).
45. Gregory, M. R. Environmental implications of plastic debris in marine settings–entanglement, ingestion, smothering, hangers-on,
hitch-hiking and alien invasions. Philos. Trans. R. Soc. Lond. B 364, 2013–2025 (2009).
46. Lusher, A. L., McHugh, M. & Thompson, R. C. Occurrence of microplastics in the gastrointestinal tract of pelagic and demersal
fish from the English Channel. Mar. Pollut. Bull. 67, 94–99 (2013).
47. Watts, A. J. R., Urbina, M. A., Corr, S., Lewis, C. & Galloway, T. S. Ingestion of plastic microfibers by the crab Carcinus maenas
and its effect on food consumption and energy balance. Environ. Sci. Technol. 49, 14597–14604 (2015).
48. Zhang, H. Transport of microplatics in coastal seas. Estuar. Coast. Shelf Sci. 199, 74–86 (2017).
49. Velzeboer, I., Kwadijk, C. J. A. F. & Koelmans, A. A. Strong sorption of PCBs to nanoplastics, microplastics, carbon nanotubes,
and fullerenes. Environ. Sci. Technol. 48, 4869–4876 (2014).
50. Plastics Europe. Plastics—The Facts 2019. (2019).
Scientific Reports | (2020) 10:10945 | https://doi.org/10.1038/s41598-020-67927-1 14
Vol:.(1234567890)You can also read