Free viewing of dynamic stimuli by humans and monkeys
←
→
Page content transcription
If your browser does not render page correctly, please read the page content below

Journal of Vision (2009) 9(5):19, 1–15             http://journalofvision.org/9/5/19/                                             1

Free viewing of dynamic stimuli by humans and monkeys
                                               Neuroscience Graduate Program, University of Southern
David J. Berg                                                      California, Los Angeles, CA, USA

                                                   Centre for Neuroscience Studies, Queen’s University,
Susan E. Boehnke                                                                Kingston, ON, Canada

                                                   Centre for Neuroscience Studies, Queen’s University,
Robert A. Marino                                                                Kingston, ON, Canada

                                                                 Centre for Neuroscience Studies and
                                                 Departments of Physiology, Psychology, and Medicine,
Douglas P. Munoz                                           Queen’s University, Kingston, ON, Canada

                                                    Department of Computer Science and Neuroscience
                                                    Graduate Program, University of Southern California,
Laurent Itti                                                                    Los Angeles, CA, USA

Due to extensive homologies, monkeys provide a sophisticated animal model of human visual attention. However, for
electrophysiological recording in behaving animals simplified stimuli and controlled eye position are traditionally used. To
validate monkeys as a model for human attention during realistic free viewing, we contrasted human (n = 5) and monkey
(n = 5) gaze behavior using 115 natural and artificial video clips. Monkeys exhibited broader ranges of saccadic endpoints
and amplitudes and showed differences in fixation and intersaccadic intervals. We compared tendencies of both species to
gaze toward scene elements with similar low-level visual attributes using two computational modelsVluminance contrast
and saliency. Saliency was more predictive of both human and monkey gaze, predicting human saccades better than
monkey saccades overall. Quantifying interobserver gaze consistency revealed that while humans were highly consistent,
monkeys were more heterogeneous and were best predicted by the saliency model. To address these discrepancies, we
further analyzed high-interest gaze targetsVthose locations simultaneously chosen by at least two monkeys. These were
on average very similar to human gaze targets, both in terms of specific locations and saliency values. Although substantial
quantitative differences were revealed, strong similarities existed between both species, especially when focusing analysis
onto high-interest targets.
Keywords: visual attention, computational model, salience, free viewing, saccades, monkeys
Citation: Berg, D. J., Boehnke, S. E., Marino, R. A., Munoz, D. P., & Itti, L. (2009). Free viewing of dynamic stimuli by
humans and monkeys. Journal of Vision, 9(5):19, 1–15, http://journalofvision.org/9/5/19/, doi:10.1167/9.5.19.

                                                                       conditions. This is important because, although there are
 Introduction                                                          similarities in the early stages of visual processing,
                                                                       cortical architecture differences exist in parietal and
  Monkeys are widely used as animal models for the study               frontal areas related to attention and cognitive processing
of human cognitive processes, such as visual attention, due            (Orban, Van Essen, & Vanduffel, 2004).
to the neural homologies between the species. More and                   Computational models (Itti, Koch, & Niebur, 1998; Le
more, there is a shift toward studying vision using natural            Meur, Le Callet, & Barba, 2007; Privitera & Stark, 2000)
and dynamic stimuli. When the visual system is examined                provide a quantitative framework to assess visual behavior
using such stimuli, it responds differently than it does to            and compare species under complex stimulus conditions.
simple stimuli traditionally used in the laboratory (for               For example, model output for the scene can be investigated
reviews, see Felsen & Dan, 2005; Kayser, Körding, &                   at actual saccadic target locations. Simple image statistics
König, 2004; Reinagel, 2001; Simoncelli & Olshausen,                  (such as local contrast, orientation) and deviations from
2001). The system also responds differently when mon-                  global image statistics exhibit differences between fixated
keys view such stimuli freely (Dragoi & Sur, 2006;                     vs. non-fixated locations (Parkhurst & Niebur, 2003;
Gallant, Connor, & Van Essen, 1998; Vinje & Gallant,                   Reinagel & Zador, 1999), and these statistics are factors in
2000). What is not yet known is whether humans and                     guiding attention. Such experiments have been done with
monkeys behave similarly under such natural viewing                    monkeys (Dragoi & Sur, 2006) and humans (Itti, 2005;
doi: 1 0. 11 67 / 9 . 5 . 19             Received December 9, 2008; published May 19, 2009                    ISSN 1534-7362 * ARVO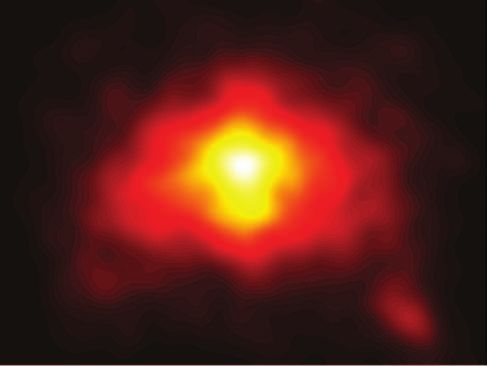
Journal of Vision (2009) 9(5):19, 1–15                    Berg et al.                                                        2

Parkhurst, Law, & Niebur, 2002; Peters, Iyer, Itti, & Koch,       played in random order) that varied in duration and
2005; Tatler, Baddeley, & Gilchrist, 2005) separately.            semantic content. The clips were subjectively categorized
However, viewing behavior has yet to be compared directly         into six coarse semantic groups (Building/City, Natural,
using a wide set of complex dynamic natural stimuli (video).      Sports, Indoor, Non-natural, and Monkey-relevant), as
   To investigate species correspondence, Einhäuser, Kruse,      shown in Figure 1. Stimuli were collected from television
Hoffmann, and König (2006) compared 2 monkeys and                (NTSC source) with a commercial frame grabber (ATI
7 humans who repeatedly viewed static, grayscale natural          Wonder Pro). Monkey-relevant clips were collected at the
images. Computational models equally predicted the species        Queen’s University animal care facility with a consumer
gaze shifts, however, differences in viewing strategies were      grade digital video camera. Frames were acquired and
observed when local image contrast was manipulated. Here,         stored at 30 Hz in raw 640  480 RGB555 format and
we expand on this significantly by comparing human and            compressed to MPEG-1 movies (640  480 pixels).
monkey free-viewing behavior using video clips ranging in         Stimuli were presented to human subjects, with head
semantic content and species relevance. Additionally, the         stabilized by a chin rest, on a 101.6  57.2 cm LCD TV
main computational model of viewing behavior, the saliency        (Sony Bravia) at a viewing distance of 97.8 cm. This
model, was adapted to better account for the temporal             provided a usable field of view of 54.9-  32.6-, which
dynamics of video (Itti & Baldi, 2006). We also measured          was the largest the video-based human eye-tracker could
consistency among observers’ gaze, which provided context         accommodate. Stimulus presentation was orchestrated
specific predictions of saccadic targets that complement the      using a Linux computer running in house-programmed
stimulus-driven predictions of the saliency model.                presentation software (downloadable at http://iLab.usc.
   Our results demonstrate correlations between saliency          edu/toolkit) under SCHED_FIFO scheduling to ensure
and both human and monkey visual behaviors; however,              proper frame rate presentation (Finney, 2001; Itti, 2005).
marked differences exist between species in eye move-             Subjects were given minimal instructionsV“watch and
ment statistics, model correspondence, and interobserver          enjoy the video clips, try to pay attention, but don’t worry
consistency. These differences must be considered when            about small details.” Each video presentation was pre-
using monkeys as a model of human attention during free           ceded by a fixation point, and the next video began when
viewing. We find that focusing analysis on a subset of            the subject pressed the space bar.
high-interest gaze locationsVto which two or more                    The exact same stimuli were also presented via the
monkeys looked simultaneouslyVcan alleviate such dif-             same Linux system to head-restrained monkeys who were
ferences. We speculate that high-interest locations reveal        seated 60 cm from a Mitsubishi XC2935C CRT monitor
commonalities between both species, possibly by empha-            (71.5  53.5 cm; 640  480 pixels). This provided a
sizing the role of their largely homologous and common            usable field of view of 61.6-  48.1-. Trial initiation was
low-level visual systems over their likely more different         self-paced. Each video presentation was preceded by a
and individualized cognitive systems.                             fixation point and the next video was initiated when the
                                                                  monkey’s eye position remained within a square elec-
                                                                  tronic window with 5- radius of the central fixation point
                                                                  for 300–500 ms. The monkey subjects were not rewarded
 Methods                                                          systematically for doing this task, but most monkey
                                                                  subjects easily learned to fixate in order to initiate the
                                                                  next clip.
Subjects

   Eye movements during free viewing were recorded from           Human eye-tracking procedure
five human (two male) and five monkey (Macaca Mulatta, all
male) subjects. Human subjects provided informed consent             Human eye movements were recorded using an infra-
under a protocol approved by the Institutional Review Board       red-video-based eye-tracker (ISCAN RK-464). Pupil and
of the University of Southern California. Monkeys were used       corneal reflections of the right eye were used to calculate
with approval by the Queen’s University Animal Care               gaze position with an accuracy 1-, sampled at 240 Hz. To
Committee and were in accordance with the Canadian                calibrate the system, subjects were asked to fixate on a
Council on Animal Care policy on the use of laboratory            central point and then saccade to one of nine target
animals and the Policies on the Use of Animals and Humans         locations distributed across the screen on a 3  3 grid.
in Neuroscience Research of the Society for Neuroscience.         This procedure was repeated until each location was
                                                                  visited twice. In subsequent offline analysis, the endpoints
                                                                  of saccades to targets were used to perform an affine
Stimulus presentation                                             transform followed by a thin-plate-spline interpolation
                                                                  (Itti, 2005) on the eye position data obtained in the free-
  Naive subjects (both human and monkey) watched 115              viewing experiment in order to yield accurate estimate of
video clips (totaling approx. 27 minutes in duration,             eye position given the geometry of the eye-tracker and
Journal of Vision (2009) 9(5):19, 1–15                           Berg et al.                                                              3

Figure 1. The six categories of scene types. Exemplars are shown from the six categories of scene types: (A) building and city, (B) natural,
(C) sports, (D) indoor, (E) non-natural (cartoons, random noise, space), and (F) monkey relevant (monkeys, experimenters, facilities).
Each group contains scenes with and without main actors (e.g., empty room vs. talk show). (G) An example of eye movement traces from
4 humans (blue) and 4 monkeys (green) superimposed on a video clip during a relatively stationary 3-s period. Notice that monkeys
looked around the screen while humans focused their gaze on the slowly moving car in the background (inset with yellow box).

display. Recalibration was performed every 13 movie                      Eye position data were digitized at 1000 Hz using data
clips during the experiment.                                             acquisition hardware by Plexon. Concurrently, timestamps
                                                                         of the time of fixation point onset, acquisition of the
                                                                         fixation target by the monkey, and initiation of the clip
Monkey eye-tracking procedure                                            were recorded.
                                                                            To calibrate eye position, monkeys performed a step
   A stainless steel head post was attached to the skull via             saccade paradigm in which targets at three eccentricities
an acrylic implant anchored to the skull by stainless steel              and eight radial orientations from the fixation point were
screws. Eye coils were implanted between the conjunctiva                 presented in random order. Monkeys were given a liquid
and the sclera of each eye (Judge, Richmond, & Chu,                      reward if they fixated a target within a square electronic
1980) allowing for precision recording of eye position                   window of 4- radius within 800 ms. During calibration,
using the magnetic search coil technique (Robinson,                      behavioral paradigms and visual displays were controlled
1963). Surgical methods for preparing animals for head-                  by two Dell 8100 computers running UNIX-based real-
fixed eye movement recordings have been described                        time data control and presentation systems (Rex 6.1:
previously (Marino, Rodgers, Levy, & Munoz, 2008).                       Hays, Richmond, & Optican, 1982). In order to control for
Monkeys were seated in a primate chair with their heads                  small non-linearities in the field coil, the weighted average
restrained for the duration of an experiment (2–4 hours).                of several visits to each target endpoint was later used to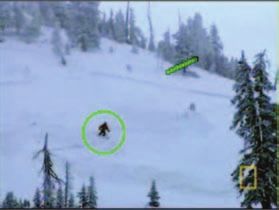
Journal of Vision (2009) 9(5):19, 1–15                       Berg et al.                                                          4

perform an affine transform and thin-plate-spline interpo-           data. In total, 1.9% of human and 27.3% of monkey eye
lation on the eye position data collected during free                traces were rejected. Note that the individual rejection
viewing of the video clips.                                          percentages do not add to the total percentage rejected due
                                                                     to overlap between clips containing tracking loss and off-
                                                                     screen data. Analysis was consequently performed on
Quantifying eye movement behavior                                    different subsets of clips for each observer with the
                                                                     limitation that at least three observers from each species
   In order to quantify viewing behavior, an algorithm was           had to have successfully viewed each clip for it to be
used for both species, which parsed the analog eye position          retained in the analysis.
data into saccadic, fixational, and smooth pursuit eye
movements. Traditional techniques to separate these various
eye movements did not work well with these data, because             Implementation of computational models
many of the eye movement patterns elicited during free
viewing of dynamic stimuli were non-traditional (e.g.,                  To assess the visually guided behavior of humans and
blends of smooth pursuit, optokinetic, and saccadic eye              monkeys, two validated computational models of visual
movements). To deal with such idiosyncrasies, standard               attention (contrast and saliency) and an interobserver con-
velocity measurements were combined with a simple                    sistency metric were used to predict individual eye move-
windowed Principal Components Analysis (PCA). The eye                ments (Figure 2). Models were created and run under Linux
position data were first smoothed (63 Hz Lowpass Butter-             using the iLab C++ Neuromorphic Vision Toolkit (Itti,
worth), and eye positions with velocities greater than 30 deg/s      2004). First, a luminance contrast model (Reinagel & Zador,
were marked as possible saccades. Within a sliding window,           1999), defined as the variance of pixel values in 16  16
the PCA was computed and the ratio of explained variances            pixel patches tiling the input image frame (Figure 2, left), is
(minimum over maximum) for each of the two dimensions                a simple but non-trivial model of attention and serves as a
was stored. A ratio near zero indicates a straight line, and         control for the performance of the saliency model. Second,
hence a likely saccade. The results of several different             we used the saliency model of visual attention framework
window sizes were linearly combined to produce a robust              (Figure 2, center; Itti & Koch, 2000; Itti et al., 1998). The
and smooth estimate. Eye positions with a ratio near zero but        Itti and Koch model computes salient locations by filtering
with insufficient velocity to be marked as a saccade were            the movie frames along several feature dimensions (color,
labeled as smooth pursuit. The remaining data were marked            intensity, orientation, flicker, and motion). Center–surround
as fixation. Saccades with short (G80 ms) intervening                operations in each feature channel highlight locations that
fixations or smooth pursuits and small differences in                are different from their surroundings. Finally, the channels
saccadic direction (G45-) were assumed to represent read-            are normalized and linearly combined to produce a saliency
justments of gaze en route to a target, and so were combined         map, which highlights screen locations likely to attract the
into a single saccadic eye movement toward the final target,         attention of human or monkey observers. To process our
rather than two or more separate saccades. Additionally,             video clips, we used the latest variant of the saliency model,
saccades of G2- in amplitude and G20 ms in duration were             which uses Bayesian learners to detect locations that are not
removed in order to decrease the false positive rate of              only salient in space but are also salient (or so-called
saccade parsing and to focus analysis on eye movements that          “surprising”) over time (Itti & Baldi, 2006). This model
more likely reflected a shift of attention to a new target as        hence substantially differs from and generalizes other
opposed to minor gaze adjustments on a current target (Itti,         models of stimulus-driven attention (Itti et al., 1998; Le
2005). This saccade parsing algorithm is freely available as         Meur et al., 2007; Privitera & Stark, 2000; Tatler et al.,
part of the stimulus presentation software.                          2005) in that both spatial and temporal events within each
   For each subject (human or monkey), clips that                    feature map that violate locally accumulated “beliefs” about
contained excessive durations (930% of clip length) of               the input cause high output for that location.
tracking loss (blinks, loss of signal from search coil, or              The contrast model contains no temporal dynamics and,
video-based tracker) or off-screen eye movements (sleep-             consequently, would not be expected to outperform the
ing, inattentive behavior) were excluded from the analy-             saliency model. Since many simple models would perform
sis. The majority of monkey clips was rejected for                   significantly above chance, we use the contrast model as a
excessive off-screen eye position (18.6% of the monkey               lower bound of performance for any non-trivial model of
data, 0.7% for humans); 11.8% of the monkey data (1.4%               attention. Additionally, luminance contrast is correlated
for humans) were discarded for loss of tracking. In                  with many features used in the saliency computation.
monkeys, the implanted search coil still produces a signal           Comparing the static luminance contrast model with the
when a subject is in a blink, however, strain on the coil            saliency model gives some insight into the contribution of
due its implanted position (along with other noise factors)          the dynamic features irrespective of luminance contrast.
will cause some loss of tracking. Due to technical errors,              To compute a measure of gaze agreement among and
data were not recorded for 17 clips for 1 monkey and                 between species, an interobserver metric was created
2 clips for another, accounting for 3.3% of the monkey               separately for each species using a leave-one-out approach
Journal of Vision (2009) 9(5):19, 1–15 Berg et al. 5
Figure 2. Architecture of the contrast and saliency models, and interobserver agreement metric. (Left) A simple luminance contrast model
computed as the variance of luminance values in 16 16 pixel image patches. (Center) The latest implementation of the saliency model (Itti &
Baldi, 2006). (Right) An interobserver agreement metric (see Methods section) created by making a heat map from the pooled eye
movements of all observers, except the one under test, on a given movie clip (leave-one-out analysis). The yellow circle indicates the
endpoint of a saccadic eye movement. At the start of the saccade, the maximum value within a 48-pixel radius circular aperture was stored
along with 100 values chosen randomly from the saccadic endpoint distribution of all clips and subjects except for the one under test. To test
for agreement between or among species, the interobserver agreement metric was sampled at the time when the eye landed at its target.
(Figure 2, right). A master map is created by placing 4.7- monkeys: A 48-pixel window but different viewing
Gaussian blobs (A = 48 pixels) centered at the instantaneous distances and screen sizes for each species) around human or
eye positions of a subset of human or monkey observers. For monkey saccadic endpoints were compared to 100 map
each subject, a map is created from the eye positions of the values collected from locations randomly chosen from the
2–4 other subjects in the same species who viewed the clip. distribution of saccadic endpoints from all saccades (in the
A maximum output for this map is achieved when all same species) except those generated in the same clip by
subjects look at the same item simultaneously. This map the same subject as the sample. This approach is similar to
represents a combination of stimulus-driven and goal- the image-shuffled analysis method used by others for static
directed eye movements and has been used as an upper images (Parkhurst & Niebur, 2003; Reinagel & Zador,
bound for human gaze prediction (Itti & Baldi, 2006). 1999; Tatler et al., 2005) and allows for an unbiased
measure of model performance despite any accidental
correlation between a particular species saccadic endpoint
Comparing eye movements to model and distribution and model output. For a particular subject, at
metric output the onset of a saccade we measured the value in each
model map at the endpoint of the saccade, i.e., the activity
To compute the performance of each model or metric, the in the map just before the saccade. For the interobserver
maximum map values in a circular window (3.6- humans, model, the map value was measured at the time of theJournal of Vision (2009) 9(5):19, 1–15 Berg et al. 6
endpoint of the saccade to assess the congruency of gaze framework (Monte Carlo simulation, 10,000 repetitions).
locations, either within or between species. Confidence intervals for model and metric scores were
Differences between saliency at human or monkey gaze estimated by repeating the ordinal dominance measurement
targets and at the randomly selected locations were on a randomly selected half of the data, to form a sampling
quantified using ordinal dominance analysis (Bamber, interval. Tests between species or models were carried out
1975). Model or metric map values at observers’ saccadic using a permutation test, computed by taking all saccades
endpoints and random locations were first normalized by from both groups under test and randomly assigning each
the maximum value in the map when the saccade occurred saccade to one of the two groups, irrespective of the actual
(i.e., when the map was sampled). For each model, group membership of the saccades. The difference between
histograms of values at eye positions and random mean ordinal dominance values for the two randomly
locations were created. To non-parametrically measure assigned groups was computed and stored. The process
differences between observer and random histograms, a was repeated to form a sampling interval. The p value
threshold was incremented from 0 to 1, and at each represents the probability of observing a value more
threshold value we tallied the percentage of eye positions extreme than the original group assignment (Good,
and random locations that contained a value greater than 1994). Statistical analysis of the saccadic endpoint
the threshold (“hits”). A rotated ordinal dominance curve distributions was also carried out in the permutation
(similar to a receiver operating characteristic graph) was framework, but the symmetric Kullback–Leibler distance
created with “observer hits” on one axis and “random function was used in place of ordinal dominance.
hits” on the other (Figure 5, inset). The curve summarizes
how well a binary decision rule based on thresholding the
map values could discriminate signal (map values at
observer eye positions) from noise (random map values). Results
The overall performance can be summarized by the area
under this curve. This value is calculated and stored for
each of the 100 randomly sampled sets. The mean of the Saccade metrics
100 ordinal dominance values is taken as the final ordinal
dominance estimate. A model that is no more predictive Several differences in the saccade metrics of humans
than chance would have equal random and model hits for and monkeys were observed. Figures 3A and 3B show the
each threshold, creating a straight line with an ordinal smoothed distribution of saccadic endpoints used for
dominance of 0.5. The interobserver metric is assumed to analysis. “Hotter” colors represent a higher likelihood
provide the upper bound of predictability, between 0.5 and that a subject made a gaze shift to that location. Human
1.0 (see Results section), which the best computational and monkey saccadic endpoint distributions were signifi-
models might be expected to approach. Note that an cantly different (permutation test, p e 0.0001), but both
ordinal dominance of 1.0 is not achievable by any model, species showed the characteristic center bias reported in
because there is imperfect agreement among observers, human experiments using natural photographs (Reinagel
hence it is impossible for a single model to exactly & Zador, 1999; Tatler, 2007). This may reflect a
pinpoint the gaze location of each observer. physiological bias to return the eyes to the center of the
orbits (Paré & Munoz, 2001). Monkeys seemed to explore
the spatial extent of the display more thoroughly than
humans, who were very center-biased. This difference
“High-interest” gaze targets may be due to a variety of factors including motor
differences, cognitive awareness of the main actors and
For some analyses, we defined a subset of saccadic actions that were often near the center of the video, or a
endpoints as “high-interest” gaze targets. These were general search strategy. The TV channel logo that often
locations separated by less than 48 pixels (3.6- humans, appeared in the lower right-hand corner (Figure 1G) also
4.7- monkeys) that two or more observers of a given species attracted a high number of gaze shifts for both species.
looked at within 150 ms of one another. For monkeys, Figures 3C and 3D show the saccadic main sequence for
filtering the 12,826 saccades used for the overall analysis by humans and monkeys. The main sequence plots the
these criteria resulted in a subset of 1,812 saccades; for relationship between saccadic peak velocity and ampli-
humans, filtering the original 12,148 saccades resulted in a tude and is well known to be an exponential function
subset of 4,142 saccades. (Bahill, Clark, & Stark, 1975). The shape of this function
is thought to reflect the brainstem circuitry controlling
saccades and is altered when there is damage in the
Statistical analysis brainstem circuits or muscles controlling saccades (Ramat,
Leigh, Zee, & Optican, 2007). The main sequence data
Distributions of model and metric output at gaze targets combined across the 5 monkeys were noticeably more
were statistically compared using the permutation variable than the human main sequence. When analyzedJournal of Vision (2009) 9(5):19, 1–15 Berg et al. 7 on a log–log scale, a linear regression revealed an R2 of (Figure 3, although a small magnitude difference) in 0.77 (ANOVA test, F(1, 15168) = 52002, p G 0.0001) for humans, indicating a steeper relationship between ampli- monkeys compared to an R2 of 0.96 (ANOVA test, F(1, tude and peak velocity. 14835) = 342150, p G 0.0001) for humans. Monkeys were Figure 4 compares saccadic amplitude, fixation dura- much faster for a given amplitude, and regression lines tion, and intersaccadic interval distributions for monkeys showed monkeys had significantly higher velocity offset (green bars) and humans (blue bars). The probability (Figure 3). The slope of the line was significantly higher distribution of saccadic amplitudes differed significantly, Figure 3. Saccade Metrics: Endpoint distributions and main sequences. (A–B) Saccadic endpoint distributions for the 12,138 human and 12,832 monkey saccades (computed after removing noisy data and clips with fewer than three observers, resulting in less data for monkeys) used for comparison with the contrast and saliency models and the interobserver agreement metric. Points were smoothed by convolving each map with a Gaussian kernel (A = 1.5-). “Hotter” colors represent a higher likelihood that a human or monkey gaze shift landed at that screen location. Distributions were significantly different at p e 0.0001, using the Kullback–Leibler distance function between distributions in a permutation test (see Methods section). (C–D) Main sequence for all saccades (14,837 from humans and 15,170 from monkeys, before removing clips with fewer than three observers) recorded from humans (blue) and monkeys (green). The main sequence was computed before combining multi-step saccadic eye movements into a single saccade, yielding separate entries for each component of the multi-step saccade. Main sequences for humans and monkeys were significantly different (ANOVA test, F(2,30003) = 58024.55, p G 0.0001), testing for coincident regression lines on a log–log scale. Significant differences were observed for both the slope (ANOVA test, F(1,30003) = 1703.29, p G 0.0001) and velocity offset (ANOVA test, F(1,30003) = 21805.25, p G 0.0001) components of the main sequence. Black lines fitted to the data were computed by minimizing V = a (1 j ejA/s), where V and A are saccadic velocities and amplitudes, respectively; a and s are the model parameters representing maximum amplitude and slope of the lines.
Journal of Vision (2009) 9(5):19, 1–15                              Berg et al.                                                          8

                                                                            median durations (Figures 4B and 4C). Monkey fixation
                                                                            and intersaccadic interval distributions were narrower,
                                                                            which possibly indicates a stereotyped fixation pattern (e.g.,
                                                                            fixate for 250 ms and then saccade to new place). In
                                                                            contrast, human fixation durations and intersaccadic inter-
                                                                            vals were spread over a wide range of values.

                                                                            Model predictions of gaze shift endpoints

                                                                               To further quantify species differences, we used a
                                                                            computational model of saliency-based visual attention.
                                                                            In previous human experiments, this model has revealed
                                                                            that observers gaze more frequently toward the salient
                                                                            “hot-spots” computed by the model in both static images
                                                                            and dynamic scenes (Itti, 2005; Itti, 2006; Itti & Baldi,
                                                                            2006; Parkhurst et al., 2002; Peters et al., 2005). The
                                                                            model takes as input an image or video clip frame and
                                                                            outputs a salience map that gives a prediction of the
                                                                            screen locations likely to attract attention. The specific
                                                                            implementation details of this model have been described
                                                                            previously (Itti & Baldi, 2006; Itti et al., 1998).
                                                                               We measured the amount of computed saliency for each
                                                                            video frame at the endpoints of saccadic eye movements in
                                                                            both species (see Methods section), to assess the extent to
                                                                            which humans and monkeys exhibited similar computations
                                                                            of salience (perhaps represented in monkey LIP, Goldberg,
                                                                            Bisley, Powell, & Gottlieb, 2006) and strategies for
                                                                            deploying gaze toward salient locations. To quantify the
                                                                            chance-corrected performance of the saliency model,
                                                                            values at gaze targets were compared to values at gaze
                                                                            targets taken at random from other video clips, giving an
                                                                            ordinal dominance score (see Methods section). Measure-
Figure 4. Saccade Metrics: Distributions of saccade amplitude,              ments from the contrast model and interobserver agreement
fixation durations, and intersaccadic intervals. Probability histograms      metric were similarly chance-adjusted. Figure 5A shows
for (A) saccadic amplitude, (B) fixation duration after a saccade, and       the comparison of human and monkey ordinal dominance
(C) intersaccadic interval (which may include smooth pursuit) for           scores for different models and metrics, and Figure 5B
humans (blue) and monkeys (green) calculated before combining               shows a summary of the statistical analysis. All models and
multi-step saccades into a single saccade. For display purposes             metrics predicted human and monkey gaze targets signifi-
only, the green bars are half the width of the blue bars, which             cantly better than chance (permutation test, p e 0.0001),
represent the actual interval for both. The time axes are truncated         and saliency predicted human and monkey gaze behavior
at 1000 ms. Amplitude (Two-tailed Kolmogorov–Smirnov, D = 0.34,             significantly better than the baseline-control contrast model
n1 = 14837, n2 = 15170, p G 0.0001), fixation duration (Two-tailed           (permutation test, p e 0.0001). This finding validated the
Kolmogorov–Smirnov, D = 0.12, n1 = 14837, n2 = 15170,                       use of the saliency model as a good predictor of visually
p G 0.0001), and intersaccadic interval (Two-tailed Kolmogorov–             guided attentive behavior in both humans and monkeys.
Smirnov, D = 0.13, n1 = 14837, n2 = 15170, p G 0.0001) histograms              Interestingly, we found that saliency correlated with
were significantly different. Green and blue circles represent the           human behavior significantly better than monkey behav-
median scores for each species.                                             ior, over all clips combined (permutation test, p e 0.0001).
                                                                            Differences in the likelihood to deploy attention to salient
in that monkeys had a broader distribution and a greater                    items should be minimized when using monkeys as a
median (Figure 4A). This could in part have been because                    model for human attention during free viewing. The
monkey subjects had a slightly wider field of view;                         saliency differences were, however, small in magnitude
however, when amplitudes were replotted on a normalized                     compared to the difference in interobserver agreement
axis, the same qualitative results were obtained (not                       (Figure 5). Comparing saliency scores with interobserver
shown). The probability distributions for fixation dura-                    agreement may provide insight into a way to reconcile such
tions and intersaccadic intervals also significantly differed               differences. Although saliency was a strong predictor of
between species with humans having slightly longer                          human visually guided behavior, the stimulus-driven nature
Journal of Vision (2009) 9(5):19, 1–15 Berg et al. 9
of the model limited its predictive power. The interobserver
agreement metric captured aspects of stimulus-driven
(saliency) and top-down (context specific) attentional
allocation, the latter of which has also been shown to be a
significant factor in guiding human gaze shifts in natural
scenes (De Graef, De Troy, & Dydewalle, 1992; Neider &
Zelinski, 2006; Noton & Stark, 1971; Oliva, Torralba,
Castelhano, & Henderson, 2003; Yarbus, 1967). The
interobserver agreement metric was the best predictor of
human saccadic targets (permutation test, p e 0.0001).
Interestingly, this trend did not hold for monkeys and the
interobserver agreement metric was significantly less
correlated with monkey gaze shifts than the saliency model
(permutation test, p = 0.0027). That is, the computational
saliency model better predicted where one monkey might
look than was predicted from the gaze patterns of two to
four other monkeys. Any top-down information present in
the monkey interobserver agreement metric was insufficient
to increase predictability of gaze patterns over a purely
stimulus-driven model. Monkey top-down attentional allo-
cation may be completely inconsistent among observers
(e.g., Figure 1G), leaving saliency to be the best predictor
of visually guided attentive behavior.
Figure 6 shows a scatter plot of median normalized (not
chance corrected) monkey vs. human saliency values at all
saccadic endpoints that occurred during each entire clip.
This clip-by-clip analysis revealed that saliency values
from monkeys and humans were significantly correlated
(Figure 6). The best fitting line (solid black) had
significantly lower slope than the unity line (dashed
black), indicating that monkeys’ saliency scores varied
less than those of humans from clip to clip, and clips that
Figure 5. Model and metric scores at human and monkey saccadic contained higher saliency values for humans contained on
endpoints. (A) Comparison of the contrast and saliency model, and average slightly lower saliency values for monkeys. The
interobserver agreement metric values at human (blue) and monkey y-offset, however, was not different from 0 (Figure 6),
(green) saccadic endpoint locations with values at randomly indicating that there was no systematic bias, or baseline
selected eye positions. Overall, human and monkey gaze shifts shift, in human or monkey raw saliency scores. The
were predicted (permutation test, p e 0.0001) by all models and majority of the regression line falls below the unity line;
metrics greater than chance levels (ordinal dominance of 0.5). Error hence, on average the saliency scores were lower for
bars show the 95% confidence interval on the ordinal dominance monkeys, as was already the case with our aggregate
estimate (see Methods section). (B) This figure summarizes the analysis (Figure 5). Individual clip content affected
statistical differences between species and models as obtained deployment of gaze to salient locations for humans and
through permutation tests (see Methods section). Blue (human), monkeys in a comparable way; however, monkeys may
green (monkey), and white (human–monkey) bars show the have had a tendency to be less modulated by clip content.
magnitude of the test statistic (mean ordinal dominance difference) This likely reflects differences in semantic understanding
obtained between pairs labeled on the x-axis. Values greater than 0 of the clips between the two species.
indicate that the first model or species in the pair had a larger We defined a subset of clips (Figure 1F) as monkey
ordinal dominance score. Black bars represent the 95% confidence relevant. These clips contained scenes from the monkeys’
interval of the test statistics sampling distribution. (Left) Saliency daily environment (e.g., their housing, familiar monkeys
performed better than the baseline-control contrast model for both and humans, facilities) and represented a contextual
humans and monkeys (permutation test, p e 0.0001). (Center) control to ensure monkeys attended to familiar natural
Interobserver agreement was more predictive than saliency for scenes similarly to novel ones. The points in the scatter
humans (permutation test, p e 0.0001), however, interobserver plot for monkey-relevant clips (Figure 6, green triangles)
agreement was less predictive than saliency for monkeys (permu- were in the same distribution as those for other clips. Only
tation test, p = 0.0027). (Right) The human saliency ordinal considering these monkey-relevant clips, a significant
dominance score was significantly higher than the monkey score linear correlation was found (Pearson correlation, r(13) =
(permutation test, p e 0.0001). 0.72, p = 0.005). This line was not significantly differentJournal of Vision (2009) 9(5):19, 1–15 Berg et al. 10
agreement metric might be due to idiosyncratic search
strategies and/or cognitive systems by monkeys, which
may or may not have been related to the video content. To
remove idiosyncratic gaze shifts from the analysis, we
determined a subset of “high-interest” gaze targetsVthose
locations that attracted the attention of two or more
observers toward the same location at the same time (see
Methods section). Saliency and interobserver agreement
metrics were then reanalyzed based on this subset for each
species. Figure 7A shows the effect of filtering by high-
interest gaze targets on an “interspecies agreement”
metric. This metric represents the correlation between
monkey saccadic target locations and those target loca-
tions selected by humans. This metric was computed by
testing monkey saccadic endpoints against the same
human-derived interobserver metric that was used for
human interobserver agreement analysis. The interspecies
agreement metric allowed us to directly measure the
extent to which monkey gaze target locations were also
looked at by humans. The lowest score the interobserver
agreement metric obtained for humans was when all
Figure 6. Correlation between saliency values at human and human saccades were analyzed together (Figures 5A and
monkey eye positions. The scatter plot shows median saliency 7A, lower black line). This can serve as a lower bound for
values considering all saccadic endpoints in a given video clip for our interspecies agreement metric; as to be a good model
monkeys vs. humans. Each point represents the median of raw of human visual behavior, monkeys should be as con-
(not chance corrected) saliency values for each video clip, with sistent with human gaze targets as humans are with one
green triangles indicating clips that would be relevant to a monkey another. A useful upper bound for this metric is obtained
as described in the Methods section. Human and monkey scores by recalculating the interobserver agreement metric for
were well correlated (Pearson correlation, r(98) = 0.80, p G 0.0001). saccadic target locations where at least two humans
Analysis of coefficients obtained by major axis regression (Sokal & agreed to look (Figure 7A, upper black line). We expect
Rohlf, 1995) revealed that the best fitting line (y = 0.82x + 0.032, the best models of human visual behavior (animal or
solid black) was significantly different from unity (dotted black) computational) to approach this level of correlation with
in slope (F-test, F(1,98) = 7.26, p = 0.0083) but not y-offset (t-test, humans, as it means the model is often selecting the
t(98) = 0.089, p = 0.38). The regression line for monkey-relevant strong attractors of attentionVthose scene locations that
clips (y = 0.91x j 0.00021, solid green) was not significantly on average attracted the attention of multiple human
different from the regression line for all other clips (chi-square test, observers.
c2(1, N = 100) = 0.2, p = 0.65), computed by testing for coincident When all monkey saccades were considered, the
lines. Hypothesis testing was performed according to Warton, interspecies ordinal dominance score was lower than the
Wright, Falster, and Westoby (2006). The sample frames in the score obtained from the human interobserver agreement
upper left and lower right corners are from videos where one metric (permutation test, p e 0.0001). That is, monkey
species had a considerably higher saliency score than the other. saccadic target selection was less consistent with human
The two adjacent frames are from the two videos where human and target selection than humans were with one another.
monkey scores were most similar. However, the interspecies ordinal dominance score dra-
matically increased (permutation test, p e 0.0001) when
from that calculated for all other clips (Figure 6). Taken analysis was limited to monkey saccades made toward
together, this analysis indicates that monkeys were monkey high-interest targets. In fact, the interspecies
visually attentive to the video clips in a similar fashion score for these high-interest monkey saccades fell above
to humans, at least as far as saliency is concerned, our human-derived lower bound (permutation test,
although from this analysis we cannot know if they p e 0.0001) but below our human-derived upper bound
looked at similar spatial locations at the same time, only (permutation test, p e 0.0001). This demonstrates a high
that they looked at similarly salient items. correlation between locations where humans and monkeys
looked when analysis of monkey saccades was restricted
to high-interest locations.
“High-interest” gaze locations Figure 7B compares human and monkey saliency
ordinal dominance scores for all gaze targets and high-
We wondered if the relatively poor predictability of interest gaze targets. As was shown in Figure 5, when all
monkey behavior by the saliency model and interobserver saccades were considered the monkey saliency ordinalJournal of Vision (2009) 9(5):19, 1–15 Berg et al. 11
better predictor of high-interest gaze targets than of low-
interest ones (e.g., when the five observers looked at five
different locations) for both species. Note that increasing
the number of humans who agreed on a saccadic target to
three did not significantly increase the saliency ordinal
dominance score (not shown). Thus, in our analysis, gaze
locations where two human observers agreed can serve as
an upper bound for human gaze predictability. Increasing
the number of agreeing monkeys beyond two seemed to
increase the ordinal dominance scores linearly (not
shown), but more data would be required for hypothesis
testing. Interestingly, the saliency ordinal dominance
score for monkey high-interest saccadic targets was
greater than the human score for all saccades (permutation
test, p e 0.0001) and was indistinguishable from the
score for human high-interest gaze targets (permutation
test, p = 0.16). That is, scene items that drew the attention
of multiple monkeys (high-interest gaze targets) contained
Figure 7. Analysis at high-interest gaze locations. To test the similar chance-corrected saliency values than those loca-
agreement in saccadic target selection between humans and tions that attracted the gaze of multiple humans.
monkeys, the human interobserver metric was used to predict the
gaze locations of monkeys (interspecies agreement metric).
(A) Ordinal dominance scores for the interspecies agreement metric
for all monkey saccadic endpoints, and a subset of “high-interest” Discussion
saccadic targets, that multiple monkeys looked at simultaneously.
When only high-interest targets were considered, monkey saccadic
endpoints were closer to human gaze locations (permutation test, The present study objectively compared, for the first
p e 0.0001). To serve as a reference, the lower black line is the mean time, human and monkey visually attentive behaviors
ordinal dominance score of the human interobserver agreement during free viewing of natural dynamic (video) stimuli. In
metric. The upper black line is the mean ordinal dominance score of addition to examining saccadic eye movement metrics,
the human interobserver agreement metric when only locations several models of visual attention were employed to
where two or more humans agreed to look were considered. Shaded provide objective metrics by which to compare human
regions represent the 95% confidence intervals of these estimates. and monkey viewing behaviors. We found significant
When all monkey gaze targets were considered, the interspecies differences between human and monkey gaze shifts during
agreement metric scored lower than the human interobserver free viewing. In summary, monkeys generated faster
agreement metric (permutation test, p e 0.0001). However, when saccades, which spanned a greater range of the screen
only high-interest gaze targets were considered, the interspecies and were separated by shorter fixation durations. Although
ordinal dominance score fell between the lower and upper bounds both species shifted gaze to locations that were deemed
derived from our human interobserver metric (permutation test, salient by the saliency model, humans were more likely to
p e 0.0001). (B) Saliency ordinal dominance scores for all gaze do so. The gaze locations of other humans were the best
endpoints and a subset of high-interest gaze locations for humans predictors of human behavior, but this was not true of
and monkeys. The ordinal dominance scores for all saccades monkeys. The saliency model predicted monkey gaze
(Figure 5) are replotted as a reference. When all monkey gaze shifts better than the combined gaze behavior of other
targets were considered, the monkey saliency ordinal dominance monkeys. These differences, however, could be mini-
score was lower than the human score (permutation test, p e 0.0001). mized if we only examined high-interest gaze locationsV
For the subset of high-interest gaze targets, where two or more those that at least two monkeys jointly attended. When the
monkeys agreed, the ordinal dominance score was increased saccades were filtered in this way, monkey behavior
(permutation test, p e 0.0001) and indistinguishable from the human became more human like, almost indistinguishable in
high-interest gaze targets (permutation test, p = 0.16), putting the terms of gaze location and saliency values. This filtering
monkeys in the range of human predictability. technique focuses analysis on common attractors of
attention between species, possibly by emphasizing the
dominance score was significantly lower than the human role of the shared low-level saccadic selection processes
score, indicating that the saliency model predicted human over the more idiosyncratic cognitive processes. High-
saccades better than monkey saccades. However, at high- interest targets minimize differences between the species,
interest gaze targets, the ordinal dominance scores were providing a method to make the best use of monkeys as a
significantly higher for humans and monkeys (permutation model of human visual behavior under free-viewing
test, p e 0.0001), indicating that the saliency model was a conditions.Journal of Vision (2009) 9(5):19, 1–15 Berg et al. 12
Monkey–human differences in eye movement viewing images (Peters et al., 2005) and videos (Itti, 2005;
metrics Itti & Baldi, 2006). The contrast model, although it does
not contain temporal dynamics, serves as a baseline to
Eye movement metrics under free viewing of video measure the performance of the saliency model, for even
stimuli were found to be quite different between monkeys simple models of attention will predict behavior signifi-
and humans. Monkeys were less center-biased and made cantly above chance (random sampling). Both models
saccades with larger amplitudes on average. This may predicted gaze shifts of both species above chance, but the
suggest that monkeys were less interested in the video saliency model performed better, as expected. Validation
actions and actors, which tended to be filmed near the of the saliency model with monkeys suggests that the
center. Monkeys may have had less cognitive under- species may possess similar computations of saliency
standing of the scenes, and/or they were more interested in during free viewing, and the model captures aspects of
exploring the screen, possibly in search of actions/ these mechanisms shared among primates. This is encour-
locations that could have resulted in reward. aging as it validates investigation of the neural substrates
At a more mechanical level, monkeys differed from of such computations in monkeys.
humans in features of their saccadic main sequence (saccadic Interestingly, the computational models predicted
velocity vs. amplitude). Monkeys made much faster sac- human gaze shifts better than monkey gaze shifts. This
cades for a given amplitude compared to humans, confirm- was surprising, as we had expected monkeys would be
ing what has been found by Harris, Wallman, and Scudder more saliency-driven than humans, due to their impov-
(1990). The main sequences under free-viewing conditions erished knowledge of the clips content (e.g., one video
were comparable to those obtained in previous studies using clip shows the earth viewed from space, likely a foreign
laboratory stimuli with humans (Bahill, Brockenbrough, & concept to our monkeys). Our finding was also in contrast
Troost, 1981; Bahill et al., 1975; Becker & Fuchs, 1969; to results from Einhäuser et al. (2006) who found
Boghen, Troost, Daroff, Dell’Osso, & Birkett, 1974) and monkeys and humans to be equally saliency-driven to
monkeys (Quaia, Paré, Wurtz, & Optican, 2000; Van grayscale images. However, inconsistency in gaze target
Gisbergen, Robinson, & Gielen, 1981) separately. Our data selection among monkey observers relative to humans
tended to have slower peak velocities, particularly in provided some insight into these discrepancies.
humans; however, velocities still fell within the normal Human attention has been described as a combination of
range defined by Boghen et al. (1974). Differences in our stimulus-driven (bottom-up) and contextually driven or
data may be a feature of free viewing, or idiosyncratic to goal-directed (top-down) factors (Itti & Koch, 2001;
our subjects and methodology. Treisman & Gelade, 1980), and monkey attention is likely
Discrepancies between species could be partly accounted controlled by similar mechanisms (Fecteau & Munoz,
for by differences in neural connectivity from the retina 2006). The interobserver agreement metric contains
through the oculomotor system to the eye muscles, and elements of both factors while the saliency algorithm
possibly by differences in the motor plant, e.g., smaller captures aspects of bottom-up processing only. As
viscous reactive forces in monkeys because they have a expected, for humans, the interobserver agreement metric
smaller eyeball. These plant differences probably reflect provided the best prediction of gaze deployment. It has
little on the processes involved in the deployment of visual been known since Henderson, Weeks, and Hollingworth
attention. However, some discrepancies (e.g., intersaccadic (1999) and Loftus and Mackworth (1978) that gaze
intervals, saccadic endpoint distributions) may stem from density among observers is increased over scene regions
different scanning strategies employed and should be containing semantically inconsistent or highly informative
accounted for when comparing species. objects. Hence, the gaze consistency among our humans
likely reflects their shared notion of semantically infor-
mative regions in the clips. Monkey gaze, however, was
best predicted by the saliency model. This suggests that
Monkey–human differences in model monkeys made many idiosyncratic eye movements,
correspondence and interobserver agreement possibly related to each monkey’s unique interpretation
of the scene, the goal of the experiment, or inattentiveness
More relevant to understanding visual attention is an to the stimuli. Monkeys may have been engaged by the
examination of image properties at human and monkey clips but shared less top-down knowledge of how to follow
gaze positions. To objectively compare species, we the main actions compared with humans. Alternatively, it
examined how computational models predicted saccadic may be that as a result of their training, monkeys were in
targets of humans and monkeys. We used a model that part examining the screen looking to “unlock the task” or
measures static luminance contrast, which has been shown find a screen location or action that would lead to a
to be an attractor of gaze in humans and monkeys reward. Such a search strategy is supported by the
watching grayscale images (Einhäuser et al., 2006), and stereotyped fixational pattern (more narrow distribution
a saliency model, which has been shown to capture of intersaccadic intervals). In either case, since their top-
aspects of stimulus-driven eye movements in humans down interpretation seems inconsistent, saliency-basedJournal of Vision (2009) 9(5):19, 1–15 Berg et al. 13
computations may serve as the lowest common denomi- possible with human behavior under such conditions.
nator in deploying gaze in natural scenes for monkey While doing so eliminates a significant portion of the data,
observers. more data can be collected more easily under free viewing
compared with traditional single-trial methods. This
technique may emphasize common attentional mecha-
High-interest image locations minimizes nisms between species, thus making the best use of our
monkey–human differences animal model to generate results meaningful to human
behavior and cognition.
Perhaps the most relevant question to consider, given
the observed differences, is to what degree monkeys
looked at the same places that humans looked. To address
this, we focused analysis on high-interest targets, those
locations that were gazed at by two or more monkeys Acknowledgments
simultaneously. This effectively forced consistency on our
monkey data by filtering out some idiosyncratic eye This work was supported by NSF (CRCNS), Canadian
movements that may have been due to differences in Institutes of Health Research, Canada Research Chair
top-down scene interpretation or general attentiveness to Program, NGA, DARPA, and ARO. The authors affirm
the stimuli. An interspecies agreement metric revealed that the views expressed herein are solely their own and
that when all saccade data were used, monkey saccadic do not represent the views of the United States govern-
targets were not as consistent with humans, as humans ment or any agency thereof.
were with each other. In other words, monkeys did not
often look where humans looked. This is not unexpected, Commercial relationships: none.
as monkeys were inconsistent with each other. However, Corresponding author: Laurent Itti.
when the analysis was repeated using only the subset of Email: itti@usc.edu.
monkey high-interest saccadic targets, those targets were Address: 3641 Watt Way, HNB-30A, Los Angeles, CA
dramatically closer to locations where, on average, 90089-2520, USA.
humans looked (Figure 7A). High-interest gaze targets
for monkeys became consistent with human visual
behavior and were within the expected range of human References
interobserver agreement scores. These saccadic targets
may focus our monkey analysis on scene locations that Bahill, A. T., Brockenbrough, A., & Troost, B. T. (1981).
were of common interest to both species, narrowing the Variability and development of a normative data base
gap between human and monkey visual behaviors during for saccadic eye movements. Investigative Ophthal-
free viewing of dynamic scenes. mology & Visual Science, 21, 116–125. [PubMed]
Interestingly, those same high-interest targets that [Article]
correlated well with human behavior were also highly
salient; in fact, indistinguishable from human high-interest Bahill, A. T., Clark, M. R., & Stark, L. (1975). The main
gaze targets in terms of their chance-corrected saliency sequence, a tool for studying human eye movements.
scores. Highly salient items, as predicted by our model, Mathematical Biosciences, 24, 191.
may have simultaneously attracted the attention of multi- Bamber, D. (1975). The area above the ordinal dominance
ple monkey observers. Since the monkey high-interest graph and the area below the receiver operating
targets are also close to human gaze targets, this may characteristic graph. Journal of Mathematical Psy-
indicate that saliency was the common factor in driving chology, 12, 387–415.
human and monkey attention to those locations. Analysis Becker, W., & Fuchs, A. F. (1969). Further properties of
of monkey high-interest saccades minimized species the human saccadic system: Eye movements and
differences both in terms of specific saccadic targets and correction saccades with and without visual fixation
saliency model agreement. This analysis may emphasize points. Vision Research, 9, 1247–1258. [PubMed]
the shared bottom-up attentional processes among humans
and monkeys, filtering out the more individualized Boghen, D., Troost, B. T., Daroff, R. B., Dell’Osso, L. F.,
cognitive processes. & Birkett, J. E. (1974). Velocity characteristics of
This result may be particularly relevant when using normal human saccades. Investigative Ophthalmol-
monkeys in experiments requiring neural recording or ogy, 13, 619–623. [PubMed] [Article]
imaging during free viewing of dynamic or natural scenes. De Graef, P., De Troy, A., & Dydewalle, G. (1992). Local
Restricting analysis of neural responses to stimuli that and global contextual constraints on the identification
attracted the gaze of at least two monkeys would ensure of objects in scenes. Canadian Journal of Psychol-
that the monkeys’ behavior would be as consistent as ogy, 46, 489–508. [PubMed]You can also read