FY21 Results Presentation - 18 August 2021 - Bell Direct
←
→
Page content transcription
If your browser does not render page correctly, please read the page content below
FY21 Results
Presentation
18 August 2021
Platform metrics FY21
PROFORMA1 WEIGHTED NET
PROFORMA1
TOTAL AVERAGE TANGIBLE
CAP RATE GEARING
ASSETS ASSETS
A$4.3bn 5.65%2,3 28.3% $3.43ps
30.0% on FY20 35bps on FY20 180bps on FY20 3.3% on FY20
STATUTORY
FFO FFO PS DPS
PROFIT
$369.4m $136.4m 18.4cps 17.5cps4
336.0% on FY20 9.5% on FY20 5.1% on FY20 5.4% on FY20
1. Includes post balance date transactions (as outlined on slide 5).
2. Includes equity accounted investments.
3. Commercial portfolio 5.6%, Self Storage portfolio 5.7%.
4. Includes additional 0.5c announced 18 August 2021.
2 Abacus Property Group | FY21 Results Presentation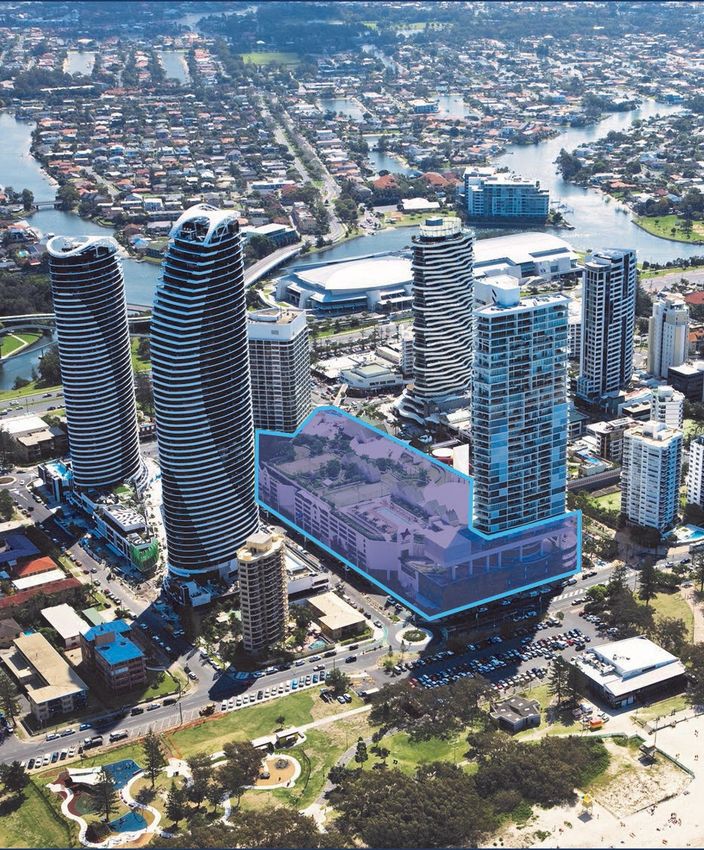
FY21 highlights
Abacus is a diversified Australian REIT with an investment portfolio concentrated in
the Commercial property and Self Storage sectors
Deployment of $1 billion1 into key sectors in FY21, funded with a combination of
non-core disposals, debt and the December 2020 equity raising
Extension of debt facilities by $500 million on favourable terms
Additional distribution of 0.5 cents per security driven by a stronger than expected
operating performance in the Self Storage sector2
Self Storage: Multi-pronged growth strategy has delivered strong FY21 trading
performance
– $575 million3 invested including acquisition of the remaining 75% interest in
our operating platform, Storage King
– 46% growth in Self Storage net property rental income to $79.7 million
Commercial: Acquisitions, collaboration and active asset management have
supported resilient FY21 trading performance
– $425 million invested4
– over 63,000 sqm of leasing completed with positive spreads
– 14% growth in Commercial net property rental income to $85.0 million5
1. Including $392 million purchased post balance date (as outlined on slide 5).
2. 3% increase on prior announced FY21 distribution.
3. Including $257 million exchanged post balance date.
4. Including $135 million exchanged post balance date.
5. Excluding equity accounted investments.
3 Abacus Property Group | FY21 Results Presentation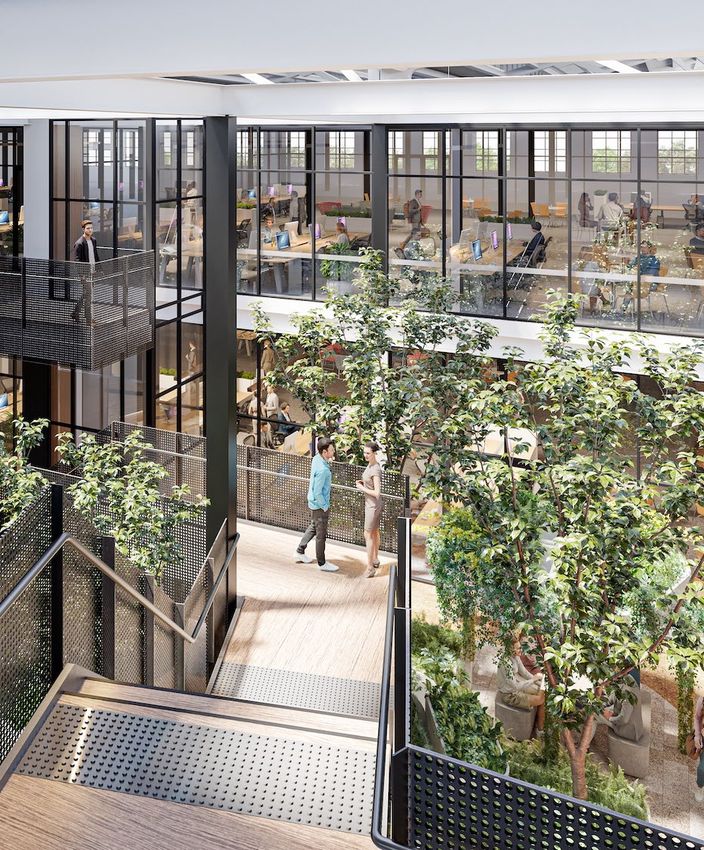
Proforma1 balance sheet allocation

                                      JUNE 2021                                                                                                  JUNE 2020

     $4.3                                          billion of
                                                   Total Assets2                                               $3.3                                        billion of
                                                                                                                                                           Total Assets2

       Commercial                                   Self Storage                                                  Commercial                               Self Storage
                                     49%                                            48%                                                          55%                        39%
       $2.1 billion                                 $2.0 billion                                                  $1.7 billion                             $1.2 billion

             Office                  $1,581m              Established3            $874m                                Office                    $1,493m     Established3   $722m

             Retail                  $478m                Stabilising4            $754m                                Retail                    $198m       Stabilising4   $294m

                                                          Other5                  $384m                                Other                     $37m        Other5         $191m

1.   Includes post balance date transactions (as outlined on slide 5).
2.   Includes investments in cash and other assets and Residential assets of $116 million in FY21 and $183 million in FY20 not pictured above.
3.   Established portfolio: 52 mature stores open at 1 July 2019.
4.   Stabilising portfolio: 44 stores owned or exchanged as at 18 August 2021. 22 stores owned at 30 June 2020.
5.   Includes Storage King, developments and other Self Storage investments.

4      Abacus Property Group | FY21 Results Presentation
Capital deployment
    Diligent deployment of over $2.3 billion into key sectors since FY17 has transformed Abacus into a strong asset backed,
    annuity style investment house

                                                               Movement in Investment Portfolio1 (in millions)

                                                                                                                                                               $4.1
       Commercial Property                                                                                                                      257           billion
       Self Storage
                                                                                                                           293   (16)                 (107)

                                                                                                                                 (3)            135
                                                                                                                     271
                                                                                              89     (47)                  117
                                                                                        257
                                                                                                                                                              2,012
                                                                                              (66)   (116)                              1,756
                                                                                                                     192
                                                                   76
                                                       166
                                   (27)                            30                                        1,207
     $1.8      10         54
                                                                        (265)           496
    billion               27       (52)                185
                                             666                                908
              287
     629

                                                                                                                                        2,034                 2,063
                                                                                                             1,728
                                            1,464                               1,415
     1,202

1. Excludes investments in cash, other assets and residential assets.

5      Abacus Property Group | FY21 Results Presentation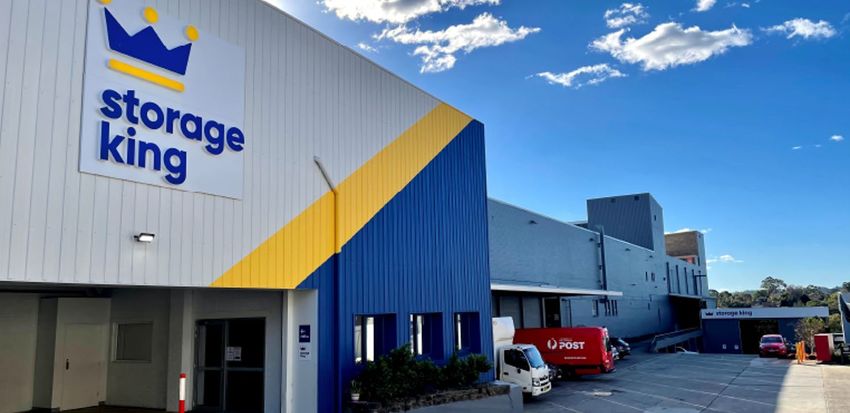
Financial Metrics

FY21 key financial metrics
Result highlights in FY21:
KEY FINANCIAL METRICS FY21 FY20 FFO up 9.5% to $136.4 million
– Commercial portfolio FFO contribution increased
23.9% to $86.9 million
AIFRS statutory profit $369.4m $84.7m – Self Storage portfolio FFO contribution increased
15.5% to $69.6 million
Established3 Self Storage portfolio of $874 million yielding
5.8% on an annualised basis
Funds from operations (FFO) $136.4m $124.6m
Additional distribution of 0.5 cents per security driven by a
stronger than expected operating performance in the Self
Storage sector4
FFO per security 18.40c 19.38c
(WAV securities on issue) (741m) (643m)
Distributions per security1 17.50c 18.50c
Cashflow from operating activities $131.6m $205.4m2
1. Includes additional 0.5c announced 18 August 2021.
2. Includes profit shares and interest payments from legacy residential business.
3. Established portfolio: 52 mature stores open at 1 July 2019.
4. 3% increase on prior announced FY21 distribution.
7 Abacus Property Group | FY21 Results PresentationBalance sheet – FY21
NTA per security up 3.3% to $3.43
Balance sheet gearing at 30 June 2021 was 22.5% KEY FINANCIAL METRICS FY21 FY20
Completion of a $402 million Entitlement Offer in December
2020
NTA per security $3.43 $3.32
Bank facility limit increase of $747 million1 on attractive terms
Acquisition capacity of over $400 million post balance date Abacus total assets2 $4,344m $3,342m
transactions
Anticipate FY22 cost of debt to be no greater than 2.0%
Net tangible assets $2,811m $2,171m
TOTAL ASSETS5
Non-core
3% Average cost of drawn debt 2.0% 3.0%
Retail & Other
10%
Gearing2,3 28.3% 26.5%
Office
42%
Gearing ratio calculated for
33.8% 31.9%
covenant measures2,4
Self Storage
45%
Debt term to maturity 4.8 yrs 3.9 yrs
1. Includes $500m of increased banking facility limits post balance date.
2. Includes post balance date transactions (as outlined on slide 5).
3. Bank debt minus cash divided by total assets minus cash. If JV and fund assets and debt are consolidated proportionately based on Abacus’ equity interest, FY21 proforma look through gearing is 29.0%.
4. Covenant gearing calculated as total liabilities (net of cash) divided by total tangible assets (net of cash).
5. Excludes investments in cash and other assets.
8 Abacus Property Group | FY21 Results PresentationInvestment portfolio – valuation
The revaluation process for Abacus resulted in a net increase in
investment property values for FY21 of $237.4 million
FY21 FY20
FY21 FY20 – Gain of $227.9 million or 19.0% across the Self Storage
INVESTMENT weighted weighted
Valuation Valuation
PORTFOLIO1 average average portfolio
$m $m
cap rate cap rate
– Gain of $9.5 million or 0.5% across the Commercial
portfolio
Self Storage $1,7562 $1,208 5.74% 6.58%
(93 assets)
Office $1,646 $1,493 5.50% 5.61%
(23 assets)
Retail & $388 $235 5.62% 6.19%
Other
(6 assets)
Total Abacus $3,790 $2,936 5.65% 6.00%
investment
portfolio
1. Includes equity accounted investments and other assets.
2. Cap rate applied to $1,430 million of Self Storage Investment Properties.
9 Abacus Property Group | FY21 Results PresentationOperating Performance
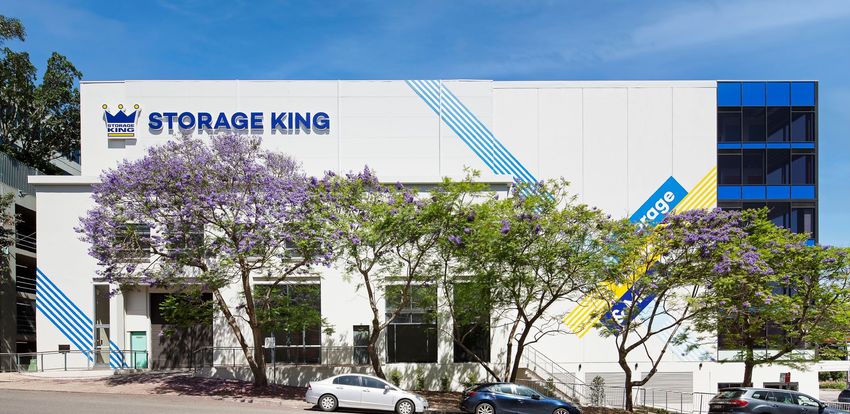
Self Storage – snapshot

                                                           SELF STORAGE $1.8 billion (45% of total assets1)

                                                                       5.8%                                              63%
                                                                  Passing yield2                          Assets located in Top 3
                                                                                                          Significant Urban Areas3

                                                                        $264                                             $290
                                                                      RevPAM2                                  Average rent psm2

                                                                     90.9%                                            75.1%
                                                                   Occupancy                                          Occupancy
                                                                  (Established)2                                     (Stabilising)4

                                                                       6.3%                                           20.1%
                                                                RevPAM growth                                    Revenue growth
                                                                 (Established)2                                   (Stabilising)5
                                                         1. As at FY21. Excludes investments in cash and other assets.
                                                         2. Established portfolio: 52 mature stores open at 1 July 2019.
                                                         3. As defined by the Australian Bureau of Statistics. Top 3 markets by population are Sydney,
                                                            Melbourne and Brisbane.
                                                         4. Stabilising portfolio: 34 stores owned at 30 June 2021. Excludes post balance date
                                                            transactions.
 Storage King, Robina QLD                                5. Stabilising portfolio (like for like): 10 stores owned at 1 July 2019.

11   Abacus Property Group | FY21 Results Presentation
Self Storage – occupancy trends1
VIC NSW QLD
94.0% 94.0% 96.0%
92.0% 92.0% 94.0%
90.0% 90.0% 92.0%
88.0% 88.0% 90.0%
86.0% 86.0% 88.0%
84.0% 84.0% 86.0%
82.0% 82.0% 84.0%
80.0% 80.0% 82.0%
Jul Aug Sep Oct Nov Dec Jan Feb Mar Apr May Jun Jul Aug Sep Oct Nov Dec Jan Feb Mar Apr May Jun Jul Aug Sep Oct Nov Dec Jan Feb Mar Apr May Jun
2020 2021 2020 2021 2020 2021
ACT NZ LIKE-FOR-LIKE
98.0% 96.0% 96.0%
96.0% 94.0% 94.0%
94.0% 92.0% 92.0%
92.0% 90.0% 90.0%
90.0% 88.0% 88.0%
88.0% 86.0% 86.0%
86.0% 84.0% 84.0%
84.0% 82.0% 82.0%
Jul Aug Sep Oct Nov Dec Jan Feb Mar Apr May Jun Jul Aug Sep Oct Nov Dec Jan Feb Mar Apr May Jun Jul Aug Sep Oct Nov Dec Jan Feb Mar Apr May Jun
2020 2021 2020 2021 2020 2021
1. Established portfolio: 52 mature stores open at 1 July 2019.
12 Abacus Property Group | FY21 Results PresentationStorage King – operational update
STORE GROWTH DRIVING REVENUE
Storage King currently manages 181 stores, (48% Abacus
vs 52% licensee stores) with 3 stores added in 2H21
Storage sector benefitting from tail winds of work from
home, decluttering, e-commerce and housing market
activity
Brand refresh program is being rolled out with 31 stores
completed during FY21
Established portfolio1 ancillary merchandise income growth
is up 14% driven by website/e-commerce platform
Digital marketing strategies – continue to focus heavily on
improving digital platforms (Storage King website, Google
AdWords, and YouTube)
1. Established portfolio: 52 mature stores open at 1 July 2019.
13 Abacus Property Group | FY21 Results PresentationSelf Storage – portfolio additions
ACQUISITIONS DEVELOPMENTS
Disciplined, metro acquisition strategy with a strong Over 13,000 sqm of NLA delivered
pipeline
Development pipeline of over $100 million will
$142 million of Self Storage acquisitions settled deliver more than 70,000 sqm of NLA
– 60% (by value) located in Top 3 SUAs1 Includes over 10,000 sqm of additional NLA to be
A further $257 million of acquisitions exchanged2 post generated from expansions across the existing portfolio
balance date
– 72% (by value) located in Top 3 SUAs1
Increased strategic stake in Self Storage AREIT3
Image on left is of Storage King, Pymble NSW. Image on right is of Storage King, Lane Cove NSW.
1. Significant Urban Areas, as defined by the Australian Bureau of Statistics. Top 3 markets by population are Sydney, Melbourne and Brisbane.
2. $251 million settled in July and August with remainder expected by September 2021.
3. Including take up of rights.
14 Abacus Property Group | FY21 Results PresentationCommercial: Office snapshot
OFFICE $1.6 billion (42% of total assets1)
95.5% 4.3%
Occupancy2 LFL income growth2,3
3.9 yrs 5.50%
WALE2 WACR4
100 372
Leasing deals Customers
98% 1%
Rent collected5 Waivers provided6
1. As at FY21. Excludes investments in cash and other assets.
2. Excludes development affected assets.
3. Occupancy increased 400bps during the period, at same occupancy LFL income
growth was flat for the period.
4. Including equity accounted investments.
5. Calculated as rent invoiced less arrears > 30 days, less any waivers provided.
6. Waivers provided during the year due to the impact of COVID-19.
14 Martin Place, Sydney NSW
15 Abacus Property Group | FY21 Results PresentationCommercial: Office leasing metrics
LEASE EXPIRY PROFILE (BY RENT)
58,170 sqm 32% new
23%
leased in FY211 68% renewals
29% 34% on new deals 19%
average incentive 23% on renewals
18%
3.9% 10% on new deals
leasing spreads 2% on renewals 14%
13%
3.8% 99% fixed 11%
average rent review 1% CPI
$6032 psm $773 average CBD2 rent
average rent $419 average fringe2 rent
2%
Short-term FY22 FY23 FY24 FY25 FY26 FY27+
leases
1. Based on 100% ownership.
2. Sydney and Melbourne.
16 Abacus Property Group | FY21 Results PresentationCommercial: Capital transactions and developments
COMMERCIAL TRANSACTIONS AND DEVELOPMENT
$425 million invested, including:
– Myer Bourke Street, Melbourne VIC - 33.3%
acquired for $135.2 million, settled post balance date
– Oasis Centre, Broadbeach QLD - Additional 60%
acquired for $103.5 million
– 241 Adelaide Street, Brisbane QLD - 50% acquired
for $31.8 million
710 Collins Street, Melbourne VIC - entered $56 million
50:50 strategic partnership with Walker Corporation
Commercial development pipeline of over $110 million in
progress:
– In partnership with Salta, delivery of approximately
19,000 sqm1 of new project NLA
– At Abbotsford, over 14,000 sqm of refurbishment
1. NLA based on 100% ownership.
Artist’s impression, 452 Johnson Street, Abbotsford VIC
17 Abacus Property Group | FY21 Results PresentationCommercial: Retail snapshot
RETAIL $343 million (9% of total assets1)
92.7% 1.9%
Occupancy2 LFL income growth2
5.4 yrs 6.37%
WALE2 WACR
26 205
Leasing deals Customers
97% 3%
Rent collected3 Waivers provided4
1. As at FY21. Excludes investments in cash and other assets.
2. Excludes development affected assets.
3. Calculated as rent invoiced less arrears > 30 days, less any waivers provided.
4. Waivers provided during the year due to the impact of COVID-19.
Oasis Centre, Broadbeach QLD 14 Martin Place, Sydney NSW
18 Abacus Property Group | FY21 Results PresentationSustainability – embedded in how we conduct business
Integration of ESG across the business to drive long term sustainable growth
Public Sustainability Targets Abacus Sustainability Strategy
Actively exploring opportunities and managing risks Deliver long-term sustainable outcomes for our stakeholders
25%
SINCE FY19
4.6
Scope 1 & 2 GHG NABERS Energy
emissions intensity Office portfolio average
SINCE FY19
Net zero emissions by 2050 (Scope 1 and 2)
24%
SINCE FY19
4.0
NABERS Water
Water intensity Office portfolio average
DIVERSION FROM
Landfill
30 June 2021
19 Abacus Property Group | FY21 Results PresentationSummary and Outlook
Outlook Abacus is positioned as a strong asset backed, annuity style investment house focused on the ownership and management of Commercial and Self Storage real estate and operation of storage locations Strategic focus is in key sectors of Self Storage and Commercial real estate Conservative gearing to provide optimum flexibility The size, nature and market positioning of key sector investments will permit the Group to deliver recurring income and value creation over the medium to long term Abacus continues to explore opportunities to optimise the diversity quality and nature of its investments FY22 full year distribution is expected to reflect a payout ratio broadly in line with the target range of 85 - 95% of FFO 21 Abacus Property Group | FY21 Results Presentation
FY21 Data Pack
Contents
Abacus Property Group Overview                           24
Financial Performance                                    25-31
Investment Portfolio                                     32-35
Non-Core Investments                                     36
Glossary                                                 37
Important information                                    38

23   Abacus Property Group | FY21 Results Presentation
About Abacus
Abacus Property Group (ASX:ABP), is a diversified Australian REIT with an investment
portfolio concentrated in the Commercial property and Self Storage sectors. We
invest capital in real estate opportunities to deliver superior long term returns and
maximise securityholder value.
Abacus is a strong asset backed, annuity style business model where capital is
directed towards assets that provide potential for enhanced income growth and
ultimately create value. Our people, market insight and repositioning capability
together with strategic partnering are the key enablers of our strategy.
Located in a single corporate office in Sydney, Australia, Abacus is listed on the
Australian Stock Exchange and is included in the S&P/ASX 200 index.
Abacus is comprised of Abacus Group Holdings Limited (the nominated parent
entity), Abacus Group Projects Limited and Abacus Storage Operations Limited,
Abacus Trust, Abacus Income Trust and Abacus Storage Property Trust. The shares
and units in these entities are stapled together and trade as one security in ABP.

24   Abacus Property Group | FY21 Results Presentation
Balance sheet allocation

                                        JUNE 2021                                                                                                JUNE 2020

     $4.1                                            billion of
                                                     Total Assets1                                                   $3.3                                  billion of
                                                                                                                                                           Total Assets1

       Commercial                                      Self Storage                                                    Commercial                          Self Storage
                                       52%                                              45%                                                      55%                        39%
       $2.0 billion                                    $1.8 billion                                                    $1.7 billion                        $1.2 billion

             Office                    $1,646m               Established2             $874m                                  Office              $1,493m     Established2   $722m

             Retail                    $343m                 Stabilising3             $511m                                  Retail              $198m       Stabilising3   $294m

             Other                     $45m                  Other4                   $370m                                  Other               $37m        Other4         $191m

1.   Includes investments in cash and other assets and Residential assets of $116 million in FY21 and $183 million in FY20 not pictured above.
2.   Established portfolio: 52 mature stores open at 1 July 2019.
3.   Stabilising portfolio: 34 stores owned at 30 June 2021. 22 stores owned at 30 June 2020.
4.   Includes Storage King, developments and other Self Storage investments.

25     Abacus Property Group | FY21 Results Presentation
Segment earnings
SELF PROPERTY
COMMERCIAL OTHER FY21 TOTAL FY20 TOTAL
STORAGE DEVELOPMENT
Rental income 120.3 111.3 231.6 195.7
Finance income 15.1 15.1 46.8
Fee income 3.5 9.6 13.1 5.0
Share of profit from equity accounted investments1, 2 7.5 7.5 9.7
Sale of inventory 3.0 3.0 15.4
Other income 3.5 8.0 3.8 15.3 1.7
Total Underlying Revenue 134.8 128.9 18.9 3.0 285.6 274.3
Expenses (31.3) (31.6) (62.9) (66.2)
Cost of inventory (2.7) (2.7) (12.7)
Segment result before corporate overheads 103.5 97.3 18.9 0.3 220.0 195.4
Administrative and other expenses (16.6) (27.7) (2.7) (0.1) (47.1) (25.9)
Underlying EBIT 86.9 69.6 16.2 0.2 172.9 169.5
Finance costs (25.7) (23.0)
Tax expense (10.6) (21.6)
Non-controlling interests (0.2) (0.2) (0.3)
Funds from Operations 86.9 69.6 16.2 - 136.4 124.6
Depreciation and amortisation (6.7) (4.9)
Rent straight-lining, incentives, movement in lease
(2.9) 0.5
liabilities, finance costs & impairments
Gains / (losses) in divestments 2.6 (0.1)
Tax benefit / (expense) on FFO items (5.0) 4.6
Change in fair value of investments, derivatives 245.0 (40.0)
Net Profit attributable to Abacus securityholders 369.4 84.7
1. Distributions from joint ventures.
2. Excludes fair value gain of $9.4 million.
26 Abacus Property Group | FY21 Results PresentationSegment balance sheet
PROPERTY PROPERTY
INVESTMENT DEVELOPMENT OTHER FY21 FY20
($m) ($m) ($m) ($m) ($m)
Commercial investment properties 1,919.7 1,919.7 1,612.2
Self Storage investment properties 1,430.2 1,430.2 1,040.7
PP&E, equity accounted and other investments,
366.6 62.3 428.9 345.0
financial and other assets
Loans 67.9 67.9 136.4
Inventory 48.1 48.1 48.0
Cash and cash equivalents 58.0 58.0 127.3
Goodwill and intangibles 73.9 32.4 106.3 32.4
Total assets 3,790.4 116.0 152.7 4,059.1 3,342.0
Interest bearing liabilities 988.5 1,009.8
Other liabilities 168.7 125.5
Total liabilities 1,157.2 1,135.3
Net assets 2,901.9 2,206.7
27 Abacus Property Group | FY21 Results PresentationNet tangible asset reconciliation
FY21 FY20
Net assets 2,901.9 2,206.7
Less
Total external non-controlling interest - (5.0)
Total stapled securityholders’ interest in equity 2,901.9 2,201.7
Less
Intangible assets and goodwill (106.3) (32.4)
Deferred tax assets/liabilities (net) 15.3 1.9
Total net tangible assets1 2,810.9 2,171.2
Securities on issue 818.6 653.5
Net tangible assets per security 3.43 3.32
1. Excludes external non-controlling interests of nil (FY20: $5.0 million).
28 Abacus Property Group | FY21 Results PresentationDebt facilities
CAPITAL MANAGEMENT METRICS FY21 FY20
Total bank debt facilities1 $1,860m $1,113m
Total bank debt drawn $960m $974m
Term to maturity 4.8 yrs 3.9 yrs
% hedged 47% 48%
% hedged of total debt facilities1 24% 42%
Weighted average hedge maturity 2.1 yrs 2.3 yrs
Average cost of debt – drawn 2.0% 3.0%
Average cost of debt – fully drawn 1.6% 2.6%
Group gearing2,3 28.3% 26.5%
Look through gearing3,4 29.0% 27.8%
Gearing calculated for covenant measures / covenant3 33.8% / 50% 31.9% / 50%
Interest coverage ratio / covenant 8.8x / 2.0x 7.6x / 2.0x
1. Includes $500m of increased banking facility limits post balance date.
2. Abacus target maximum gearing of up to 35%.
3. Includes post balance date transactions (as outlined on slide 5).
4. Includes joint venture and fund assets and debt consolidated proportionately with Abacus’ equity interest.
29 Abacus Property Group | FY21 Results PresentationProforma1 Debt maturity profile as at 30 June 2021
($’m)
400
Available bank facility
Committed bank facility
Drawn bank debt
300 128.4
92.9
200
62.8 62.8
54.4
160.7
238.2
227.0
100 166.5
140.5 150.0 150.0
130.0
31.0
34.6 30.1
0
HY22 FY22 HY23 FY23 HY24 FY24 HY25 FY25 HY26 FY26 HY27 FY27 HY28
1. Includes $500m of increased banking facility limits post balance date.
30 Abacus Property Group | FY21 Results PresentationFixed hedging maturity profile as at 30 June 2021
Fixed Debt, Interest Rate Swaps & Collars
($'m)
Weighted Average Fixed Rate
500 5.0%
400 4.0%
300 3.0%
200 2.0%
100 1.0%
0 0.0%
Year 1 Year 2 Year 3 Year 4 Year 5 Year 6
31 Abacus Property Group | FY21 Results PresentationInvestment portfolio metrics
PORTFOLIO METRICS SELF RETAIL & INVESTMENT PORTFOLIO SECTOR DIVERSIFICATION
OFFICE TOTAL
FY21 STORAGE OTHER
Retail & Other
Value1 ($m) 1,646 1,756 388 3,790 10%
No. of assets 23 932 6 122 Office
44%
NLA (sqm)3,4 127,410 457,500 48,005 632,915
Self Storage
46%
WACR1 (%) 5.50 5.74 5.62 5.65
Occupancy3 (% by area) 95.5 90.95 92.7 Office Self Storage Retail & Other
Average rent psm3 (A$) 627 2905 591 INVESTMENT PORTFOLIO GEOGRAPHIC DIVERSIFICATION
WA
WALE3 (yrs by income) 3.9 SA 3% NSW
NZ 3% 35%
7%
LFL rental growth (%) 4.3
ACT
7%
QLD
1. Includes equity accounted investments. 22%
2. Includes 7 development assets. VIC
3. Excludes development assets and post balance date divestments. 23%
4. Abacus ownership basis.
5. Average over financial year (by area) of all established assets.
NSW VIC QLD ACT NZ SA WA
32 Abacus Property Group | FY21 Results PresentationPortfolio revaluations
VALUATION WEIGHTED AVERAGE CAP RATE
ABACUS INVESTMENT PORTFOLIO BY SECTOR
30 JUNE 2021 ($’000) 30 JUNE 2021
Office $1,646,361 5.50%
Self Storage $1,755,729 5.74%
Retail & Other $388,333 5.62%
Total investment portfolio $3,790,423 5.65%
Note: Total managed Office asset value equates to $2.71 billion, total managed Retail asset value equates to $512 million.
33 Abacus Property Group | FY21 Results PresentationSelf Storage metrics
PERFORMANCE METRICS AUS NZ FY21 FY20 PERFORMANCE METRICS FY21 FY20
Total assets 78 15 931 79 Storage revenue 98.83 79.4
NLA (sqm) 378,845 78,655 457,500 383,010 Other revenue 12.5 9.2
Occupancy (%) 90.8 91.5 90.92 88.32 Total revenue 111.3 88.6
Rental rate (psm) A$290 A$291 A$2902 A$2812 Storage operating expenses (42.0)4 (34.2)
RevPAM A$263 A$266 A$2642 A$2482 Operating EBITDA 69.3 54.4
WACR 5.73 5.76 5.74 6.58 Operating margin 62% 61%
1. Includes 7 development assets.
Value ($m) 1,497 259 1,756 1,208 2. Average over financial year (by area) of all established assets.
3. FY21 rent collection remains high at nearly 100%.
4. Includes $31.6m operating expenses and $10.4m of administrative and other expenses.
% NLA Breakdown by State % Value Breakdown by State
WA SA WA
VIC 7%
SA 12% 1% VIC
21%
2% ACT 21%
13%
ACT
11%
NZ
18%
QLD NSW
15% 22% NSW
26%
NZ QLD
17% 14%
34 Abacus Property Group | FY21 Results PresentationSelf Storage development pipeline Over 70,000 sqm of identified net lettable area to be developed over the short to medium-term Anticipated return1 on invested capital of 8.0%+ NEW STORE PROJECT (SQM) FY22 FY23 FY24+ Rowville (VIC) 5,500 Woonona (NSW) 4,500 Epping (VIC) 7,000 Prestons (NSW) 6,500 Deagon (QLD) 5,000 Gregory Hills (NSW) 6,500 Granville (NSW) 7,000 Brendale (QLD) 6,500 Mittagong (NSW) 5,500 Sydney Olympic Park (NSW) 9,000 Total 17,000 25,000 21,000 SELF STORAGE DEVELOPMENT PROJECT PIPELINE NLA (SQM) New stores 63,000 Existing store expansions (under construction) 10,365 Total 73,365 1. Post stabilisation. 35 Abacus Property Group | FY21 Results Presentation
Non-core legacy investments
Abacus continues to successfully execute on its stated strategy to realise legacy exposures
Non-core loan assets reduced by 50% during FY21 with non-core residential now representing 3% of total assets1
– repayment of $82 million of residential land and mortgages during the period
PRIMARY
PROJECT TYPE EQUITY LOAN2 TOTAL
SECURITY
RCL Portfolio NSW JV/ Loan $48.1m $36.6m $84.7m 1st Mortgagee
Doonside NSW Loan - $10.6m $10.6m 1st Mortgagee
Investment Funding Portfolio Loan - $20.7m $20.7m 1st Mortgagee
Total $48.1m $67.9m $116.0m
1. Excludes investments in cash and other assets.
2. Interest rate is 10%.
36 Abacus Property Group | FY21 Results PresentationGlossary
TERM DEFINITION TERM DEFINITION
AIFRS Australian International Financial Reporting LFL Like for like
Standards
AREIT Australian Real Estate Investment Trust NABERS National Australian Built Environment
Rating system
CBD Central business district NLA Net lettable area
CPI Consumer price index NTA Net tangible assets
CPS Cents per stapled security PP&E Property, plant and equipment
DPS Distribution per stapled security PS Per stapled security
EBIT Earnings before interest and tax PSM Per square metre
EBITDA Earnings before interest, tax, depreciation REIT Real Estate Investment Trust
and amortisation
ESG Environmental, Social, and Corporate RevPAM Revenue per available square metre
Governance
FFO Funds from operations SQM Square metre
FY Financial year WACR Weighted average capitalisation rate
GHG Greenhouse Gas WALE Weighted average lease expiry
JV Joint Venture WAV Weighted average value
37 Abacus Property Group | FY21 Results PresentationImportant information The information provided in this document is general, and may not be suitable for the specific purposes of any user of this document. It is not financial advice or a recommendation to acquire Abacus Property Group securities (ASX: ABP). Abacus Property Group believes that the information in this document is correct (although not complete or comprehensive) and does not make any specific representations regarding its suitability for any purpose. Users of this document should obtain independent professional advice before relying on this document as the basis for making any investment decision and should also refer to Abacus Property Group’s financial statements lodged with the ASX for the period to which this document relates. This document contains non-AIFRS financial information that Abacus Property Group uses to assess performance and distribution levels. That information is not audited. 38 Abacus Property Group | FY21 Results Presentation
You can also read