FY22 Half Year Results Presentation - 24 February 2022 At the Coventry Group we create a sustainable future by empowering our people to deliver ...
←
→
Page content transcription
If your browser does not render page correctly, please read the page content below
FY22 Half Year Results Presentation

24 February 2022

At the Coventry Group we create a sustainable future by
empowering our people to deliver great customer
experiences

                                                          ASX: CYG
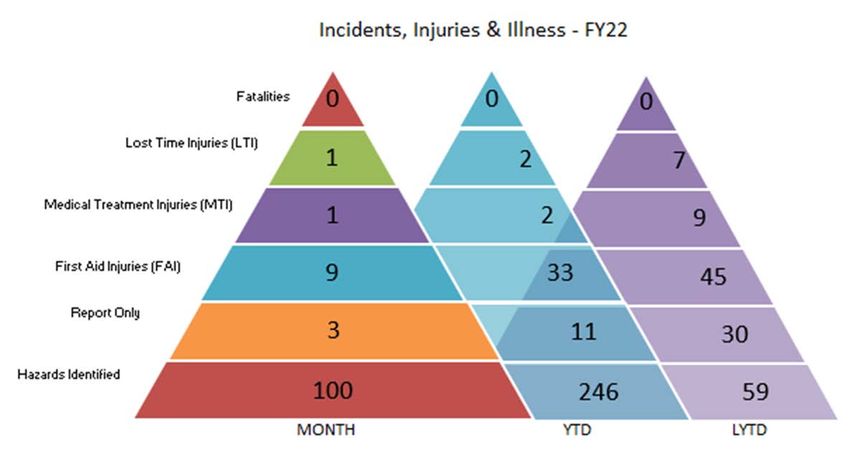
Health, Safety and Wellbeing

Reduced LTI’s in H1 FY22
                           The health, safety and wellbeing of our people is our number one
                           priority
     We value the          • 2 Lost Time Injuries (LTI) for a total of 7 lost days for H1 FY22 (5 LTI’s for 38 lost days in
   health, safety and        H1 FY21)
    wellbeing of our       • Detailed root cause analysis (RCA) investigations completed and shared across
    people first and         the business for all LTI’s, Medical Treatment Injuries and Serious Near Misses to
       foremost.             ensure we minimise risks and improve our safety systems
                           • Group Health, Safety and Environmental Manager role established in FY22
    Our aspiration is      • Dedicated Safety Managers on the leadership team in each business unit
     zero incidents
                           • Safety audits completed as part of our acquisition due diligence process
                           • Improved steel and manual handling systems implemented in the Nubco network

                           Continuous improvement plans for our health, safety and wellbeing
                           systems in FY22
                           • We will continue to prioritise the health, safety and wellbeing of our people during
                             the COVID-19 pandemic
                           • Introduced new business wide safety app (Donesafe) to streamline safety audits and
                             actions
                           • Improving return to work and rehabilitation procedures

                                                  2

                                                                                                                 ASX: CYG
Business Overview

We supply a range of fastening systems, industrial products and hydraulics,
lubrication, fire suppression and refuelling systems, cabinet hardware systems and
other products.

  Trade Distribution (TD)                                      Fluid Systems (FS)

                                                     FS
  Comprises Konnect and Artia                                  Comprises Cooper Fluid Systems,
  Australia (KAA), Konnect and                                 Torque Industries, H.I.S Hose and
  Artia New Zealand (KANZ), and                                Fluid Power Services. Designs,
  Nubco. Supplies a range of                                   manufactures and sells hydraulics,
  fastening systems, cabinet
  hardware systems, industrial and
  construction products through a
                                     TD                        lubrication, fire suppression and
                                                               refuelling systems and products
                                                               through 15 branches in Australia.
  network of 49 branches in                                    Customers are in the mining,
  Australia and 16 branches in                                 manufacturing, defence, recycling
  New Zealand. Customers are in                                and agriculture sectors.
  the manufacturing,
  construction, infrastructure,
  agriculture and mining sectors.

                                           3

                                                                                            ASX: CYG
Corporate Snapshot
Market capitalisation of $148.1m

  Key Market Metrics

        SHARE PRICE        SHARES ON      MARKET             NET DEBT
        24 February 2022     ISSUE     CAPITALISATION        31 Dec 2021

           $   1.62         91.4M        $   148.1M         $-   26.9M

   We acknowledge the support of our substantial Shareholders

        28.5%               15.4%         10.8%                       5.7%   5.0%

                                               4

                                                                                    ASX: CYG
H1 FY22 Snapshot
Trading performance improved despite the on-going COVID-19 backdrop
H1 FY22 Trading Group sales growth for H1 FY22 of +13.9% when compared with the prior corresponding period
performance (pcp). Group sales at $157.0m ($137.8m H1 FY21).
Despite an estimated loss of $750k of EBITDA due to the enforced lockdown in New Zealand, Group
EBITDA of $7.3m ($7.0m H1 FY21). Proforma EBITDA up 15% compared with the prior corresponding
period.
Statutory net profit for the half year of $2.4m ($1.1m H1 FY21).
Share price $1.62 compared to $1.45 as at 30 June 2021.
Net assets The Group has a solid balance sheet with Net Assets of $111.1m as at 31 December 2021. Inventory
value has increased due to significant price inflation along with increases to inventory levels to
minimise the impact of global supply chain issues and stock shortages.
Net debt Net debt as at 31 December 2021 of -$26.9m (Net debt as at 30 June 2021 of -$16.3m). Net Debt
was impacted by increased inventory levels during the half of $11.3m and capital expenditure of
$2.3m.
COVID-19 Managed lockdowns and restrictions throughout our operations and markets across the period.
Note 1: EBIT and EBITDA exclude the impact of AASB 16 – Leases
5
ASX: CYGH1 FY22 Highlights
Continuing our journey of sustainable profitable growth
People Sales growth EBITDA growth
Reduced LTI’s
Excellent engagement rates
Group +0.3m
Group +13.9% (Proforma +15%)
TD +12.5%
TD +$1.9m
FS +15.0%
FS -$0.4m
Notable events COVID-19 impact
Acquisition growth
Appointment of Chief People NZ government enforced lockdown
Officer Construction shutdowns NSW and Acquisitions performing to
Vic expectations
Konnect and Artia Australia (KAA)
profit up $1.4m on H1 FY21 Supply chain disruptions and stock
NZ lockdown resulted in shortages
estimated $750k lost EBITDA
6
ASX: CYGH1 FY22 Financial Results
Sales growth of 13.9%
Sales growth of +13.9% compared to the ($m) H1 FY22 H1 FY21 % change inc.
pcp acquisitions
Sales of $157.0m (H1 FY21: $137.8m) Revenue from sale of goods 157.0 137.8 +13.9%
Sales growth of +15.0% in Fluid Systems (FS) EBIT 5.8 5.7 +1.5%
and +12.5% in Trade Distribution (TD)
EBITDA 7.3 7.0 +4.5%
Despite an estimated loss of $750k of
Net profit/(loss) after tax 2.4 1.1 +218.2%
EBITDA due to the enforced lockdown in
New Zealand, Group EBITDA of $7.3m Net debt 26.9 16.6 +62.0%
($7.0m H1 FY21). Proforma EBITDA up 15%
Net tangible assets 111.1 109.8 +1.2%
compared with the pcp
Despite the estimated loss of $750k of EBIT
due to the enforced lockdown in New
Zealand, Group EBIT of $5.8m ($5.7m H1
FY21)
Statutory profit after tax for the half of
$2.4m ($1.1m H1 FY21)
Note 1: EBIT and EBITDA exclude the impact of AASB 16 – Leases
7
ASX: CYGH1 FY22 Financial Results
Sales growth achieved in both segments
Fluid Systems Fluid Systems
($m) H1 FY22 H1 FY21 % change inc. FS sales for H1 FY22 up +15.0%
acquisitions and EBITDA down -6.6% on the
pcp
Revenue from sale of goods 64.0 55.7 +15.0% H1 FY21 sales included $5.0m of
EBIT 5.8 6.4 -8.3% the large previously reported
$7.9m order
EBITDA 6.3 6.7 -6.6%
Trade distribution
TD sales for H1 FY22 up +12.5%
Trade Distribution and EBITDA up +33.8% on the
pcp
($m) H1 FY22 H1 FY21 % change inc.
Konnect and Artia Australia
acquisitions
(KAA) and Nubco improved
Revenue from sale of goods 92.8 82.5 +12.5% contribution in H1 FY22
Konnect and Artia New Zealand
EBIT 7.2 5.4 +34.4%
(KANZ) down on the pcp but lost
EBITDA 7.6 5.7 +33.8% an estimated $750k EBITDA due
to the Government enforced
lockdown
8
ASX: CYGBalance Sheet and Cash Flow
Net assets increased to $111.1m
($m) Jun-20 Jun-21 Dec-21
Cash & cash equivalents 7.5 8.2 9.6
Net debt position at 31 December 2021 of -$26.9m Trade and other receivables 33.5 43.5 39.8
Inventories 53.6 63.9 75.2
(net debt position as at 30 June 2021 of -$16.3m) Other financial assets 2.1 4.0 2.9
Other current assets 3.5 3.7 5.2
Net debt was impacted by: Total current assets 100.2 123.3 132.7
Trade and other eceivables 1.8 1.8 1.7
Increased inventory levels during the half of $11.3m as a Deferred tax assets 19.0 23.8 22.8
Property, Plant & Equipment 6.8 9.1 10.5
result of price inflation and to ensure high customer Right of use assets 39.8 41.4 40.7
service levels while there are supply chain issues resulting Intangible assets 47.9 49.2 48.8
from the COVID-19 pandemic Non-current assets 115.3 125.3 124.5
Total assets 215.5 248.6 257.2
Capital expenditure of $2.3m
Trade and other payables 40.8 49.1 43.7
Employee benefits 5.8 6.8 7.7
The Group has a strong working capital position Interest bearing loans and borrowings 10.9 24.5 36.5
Provisions - - 0.8
with Net Assets of 111.1m and Current Assets Lease liability 9.7 9.3 10.0
exceeding Current Liabilities by 34.0m as at 30 June Non-current liabilities 67.2 89.7 98.7
2021 Employee benefits 0.3 0.4 0.4
Other payables 0.2 0.3 0.3
Provisions 3.1 3.7 2.1
Tax losses of $79.6m available for use in Australia Lease liability 42.6 44.7 44.6
Non current liabilities 46.2 49.1 47.4
Franking credits available at balance date of $9.9m Total Liabilities 113.4 138.8 146.1
Net Assets 102.1 109.8 111.1
Issued capital 149.6 149.8 151.6
Retained earnings & reserves - 47.5 - 40.0 - 40.5
Total equity 102.1 109.8 111.1
9
ASX: CYGFluid Systems
Fluid Systems H1 result impacted by the non-repeat of the large FY21 order
Markets COVID-19
• Mining and resources • No Government JobKeeper support received
• Iron Ore – performing well and expected to stay solid • Supply chain disruption overseas and locally is being managed
• Coal – performing well • Suppliers are reporting difficulties obtaining raw materials – we
• Defence – good opportunity for FS have expanded our forward order program to increase stock
• Transport – growing sector holdings
• Agriculture – growing sector • The majority of suppliers are increasing prices – we are passing
on where possible
• Recycling – growing sector
• Infrastructure – growing sector
Key wins/recent developments Opportunities
• Expansion of Redcliffe WA operations to second location • Delivery of additional services and geographic branch
completed expansion
• Integration of the H.I.S. Hose acquisition and Fluid Power • Expand hydraulic cylinder market share – investment already
Systems acquisition is largely complete made into required equipment
• Labour and skills shortages is resulting in wage inflation • Expand hydraulics, fluid dispensing and refuelling systems
capabilities and customers
• Increase exposure to other sectors such as agriculture, oil &
gas, defence, transport, recycling and manufacturing
• Acquisitions
10
ASX: CYGTrade Distribution
Trade Distribution continues to be a big opportunity for growth
Markets COVID-19
• Industrial – performing well • No Government JobKeeper support received in Australia
• Commercial construction – performing well • Government support received in New Zealand as a result of
• Infrastructure – market is expanding and will continue to do so the Government enforced lockdown in August/September
with significant Federal and State Government spend • Supply chain disruption overseas and locally is being managed
commitments creating new opportunities – we are increasing stock holdings where we can
• Oil and gas – performing well • The majority of suppliers are increasing prices (steel and
• Cabinet making – performing well fasteners have had the largest increases) – we are passing on
• Roofing and cladding – performing well yet impacted by where possible
roofing screw shortages in New Zealand
• Agriculture and aquaculture – performing well and expected
to grow
Key wins/recent developments Opportunities
• KAA profit continuing to increase • Store expansion and makeovers in Australia and New Zealand
• New branches opening in Rockhampton and Invercargill • Product range expansion
• New branch being opened in Palmerston North • Increasing size and capability of business development and
• Lismore, Laverton and Bunbury store makeovers completed. sales representative field team
• Artarmon, Geelong, Sunshine Coast and Auckland store • Steel reinforcing and concrete formwork market growth
relocations to larger properties • Infrastructure market and large national customers
• Konnect and Artia on-line stores now live in Australia and New • Digital customer engagement – e-commerce
Zealand • Acquisitions
11
ASX: CYGOutlook
The Group is cautiously optimistic for the FY22 financial year
The markets in which FS and TD operate are to date performing well despite on-going COVID-19 pandemic
related disruption.
There are significant growth opportunities across all segments of the business – market share gains, new
branches, product range extension and acquisitions.
Medium-term target to achieve 7.5% group EBITDA margins.
Whilst pleased to report continuing positive performance, we are not providing FY22 guidance due to
continuing COVID-19 uncertainty.
12
ASX: CYGDisclaimer
Reliance on third party information Forward looking statements
The information and views expressed in this presentation were prepared by This presentation may include forward-looking statements. Although the
Coventry Group Ltd (the Company) and may contain information that has Company believes the expectations expressed in such forward-looking
been derived from publicly available sources that have not been statements are based on reasonable assumptions, these statements are not
independently verified. No representation or warranty is made as to the guarantees or predictions of future performance, and involve both known and
accuracy, completeness or reliability of the information. No responsibility or unknown risks, uncertainties and other factors, many of which are beyond the
liability is accepted by the Company, its officers, employees, agents or Company’s control. As a result, actual results or developments may differ
contractors for any errors, misstatements in or omissions from this presentation. materially from those expressed in the statements contained in this
presentation. Investors are cautioned that statements contained in the
Presentation is a summary only presentation are not guarantees or projections of future performance and
This presentation is information in a summary form only and does not purport to actual results or developments may differ materially from those projected in
be complete. It should be read in conjunction with the Company’s 2022 half forward-looking statements.
year financial report. Any information or opinions expressed in this Presentation
are subject to change without notice and the Company is not under any No liability
obligation to update or keep current the information contained within this To the maximum extent permitted by law, neither the Company nor its related
presentation. bodies corporate, directors, employees or agents, nor any other person,
Not investment advice accepts any liability, including without limitation any liability arising from fault or
This presentation is not intended and should not be considered to be the giving negligence, for any direct, indirect or consequential loss arising from the use of
of investment advice by the Company or any of its shareholders, directors, this presentation or its contents or otherwise arising in connection with it.
officers, agents, employees or advisers. The information provided in this
presentation has been prepared without taking into account the recipient’s For more information, please contact:
investment objectives, financial circumstances or particular needs. Each party
to whom this presentation is made available must make its own independent Robert Bulluss
assessment of the Company after making such investigations and taking such CEO and Managing Director
advice as may be deemed necessary. Coventry Group Ltd (03) 9205 8219
No offer of securities
Nothing in this presentation should be construed as either an offer to sell or a
solicitation of an offer to buy or sell Company securities in any jurisdiction.
Authorised for release by the Board of Directors of Coventry
Group Limited.
13
ASX: CYGASX: CYG
You can also read