Genetic structure and diversity of
←
→
Page content transcription
If your browser does not render page correctly, please read the page content below
Vol. 40: 133–147, 2019               ENDANGERED SPECIES RESEARCH
                                                                                                 Published October 30
 https://doi.org/10.3354/esr00986              Endang Species Res

                                                                                                   OPEN
                                                                                                   ACCESS

             Genetic structure and diversity of the
         blueface darter Etheostoma cyanoprosopum,
            a microendemic freshwater fish in the
                      southeastern USA
                      Brook L. Fluker1,*, Kenny D. Jones1, 3, Bernard R. Kuhajda2
                  1
                  Department of Biological Sciences, Arkansas State University, Jonesboro, AR 72467, USA
                        2
                         Tennessee Aquarium Conservation Institute, Chattanooga, TN 37405, USA
     3
      Present address: Department of Biological and Environmental Sciences, University of West Alabama, Livingston,
                                                     AL 35470, USA

         ABSTRACT: Darters represent one of the most diverse groups of freshwater fishes in North Amer-
         ica, but approximately 33% of the 215 recognized species are considered imperiled on the IUCN
         Red List. Discovery and description of new darter species continue at a relatively rapid pace, with
         many exhibiting microendemic geographic distributions and little baseline data for conservation
         decisions. The blueface darter Etheostoma cyanoprosopum is a newly described species that occu-
         pies < 20 km of stream reaches in the Bear Creek system of the Tennessee River drainage and the
         Hubbard Creek system of the Black Warrior River drainage in the Mobile Basin (Alabama, USA).
         In addition to restricted distribution, the species is threatened by habitat degradation and several
         natural and man-made barriers that putatively fragment connectivity among populations. This
         study used microsatellite DNA and mitochondrial DNA (mtDNA) data with comparisons to the
         relatively broadly distributed sister species (bandfin darter E. zonistium) to evaluate multiple
         objectives regarding genetic connectivity and diversity among blueface darter populations. Ana-
         lysis of mtDNA data indicated a lack of historical structuring across the Tennessee−Black Warrior
         River drainage divide and within the Bear Creek system. However, microsatellite-based Bayesian
         cluster analyses and F-statistics suggested contemporary isolation across the drainage divide and
         evidence for reservoir-induced fragmentation within the Bear Creek system. Compared to the
         sister bandfin darter, blueface darter populations exhibited reduced levels of genetic diversity,
         rendering them more susceptible to local extirpation and reduced fitness. Continued monitoring
         and quantitative ecological studies are recommended to understand population-specific measures
         of occurrence and abundance.

         KEY WORDS: Conservation genetics · Microsatellites · mtDNA

                  1. INTRODUCTION                              one of the most studied groups of fishes in North
                                                               America, ongoing taxonomic studies and recent
  With approximately 215 species, darters (Percidae:           advances in molecular techniques have led to the
Etheostomatinae) are one of the most specious                  discovery and description of 26 new species since
groups of freshwater fishes in eastern North America           2007 (approx. 2 new species described per year), and
(Page 1983, Lundberg et al. 2000, Mayden et al.                another 40 are awaiting formal description (esti-
2006, Near et al. 2011). Although darters have been            mated from Near et al. 2011). Despite high species
                                                               © The authors 2019. Open Access under Creative Commons by
*Corresponding author: bfluker@astate.edu                      Attribution Licence. Use, distribution and reproduction are un-
                                                               restricted. Authors and original publication must be credited.
                                                               Publisher: Inter-Research · www.int-res.com
134 Endang Species Res 40: 133–147, 2019 diversity, approximately 33% of darters are catego- mately 75 river km and the transition to lowland rized on the IUCN Red List (IUCN 2018) as follows: Coastal Plain habitats (Kuhajda 2004, Kozal et al. Extinct (1 species), Critically Endangered (5), Endan- 2017a). Divergence between the blueface darter and gered (17), Vulnerable (32), and Near Threatened close relatives occurred 2.9 (1.6−4.9) million years (17). While many darters have broad geographic dis- ago (mean and upper and lower bounds of the esti- tributions and corresponding flexibility in habitat mate) (Kozal et al. 2017a), and upland habitats of the use, the large majority have small geographic distri- Cumberland Plateau have remained relatively stable butions, specific habitat requirements, and unique since mid-Mesozoic times (Starnes & Etnier 1986). life-history strategies (Page 1983, Page et al. 1985, Given the isolation of blueface darter populations in Turner et al. 1996). Of particular interest for conser- the uppermost reaches of the streams it occupies, and vation are darters that exhibit microendemism, with its relatively recent history there, it is unlikely that distributions that span small geographic footprints, the species had a historically larger geographic single river drainages, or even just a few streams or distribution. springs (e.g. Mayden et al. 2005, Hollingsworth & In addition to its microendemic distribution, there Near 2009, Fluker et al. 2010, 2014a). With a few is concern about natural and man-made barriers that exceptions, most of the darters listed under the putatively fragment connectivity for the blueface Endangered Species Act or on the IUCN Red List darter across its range. First, the species has a pecu- have highly endemic or microendemic geographic liar distribution in adjacent headwater tributaries of 2 distributions (Jelks et al. 2008). Given the rapid rate distinct drainage basins (Fig. 1): the Tennessee River of new darter species descriptions, most of which (Bear Creek system) and the Black Warrior River of have microendemic distributions, there is a need to the Mobile Basin (Hubbard Creek system). It is determine basic information for these species, such unclear whether populations across this drainage as population genetic structure and diversity, life-his- divide share connectivity, but it has been hypo- tory characteristics, and habitat use, that may help thesized that the blueface darter gained access to categorize conservation status and guide conserva- Hubbard Creek via headwater piracy from Upper tion planning. Bear Creek (Dycus & Howell 1974, Boschung & May- The blueface darter Etheostoma cyanoprosopum den 2004). Both mitochondrial DNA (mtDNA) varia- Near & Kozal, 2017, is a newly described species with tion and microsatellite DNA-based cluster analysis of an extremely limited geographic range, restricted to Kozal et al. (2017a) suggested no clear pattern of < 20 km of 2 stream systems in northwestern Ala- genetic structuring between blueface darter popu- bama, USA (Boschung & Mayden 2004, Kuhajda lations across the Tennessee−Black Warrior River 2004, Kozal et al. 2017a; Fig. 1). Although the species drainage divide; however, explicit tests for genetic was recently described, it has been informally recog- structure among drainages were beyond the scope of nized as distinct since 1995 (Kuhajda & Mayden the study, and sample sizes of the Bear Creek popu- 1995, Boschung & Mayden 2004, Kozal et al. 2017a), lation were small (n = 5) for microsatellite-based and numerous status surveys have been conducted analyses. Understanding whether blueface darter since (Kuhajda 2004). Because of the informal recog- populations are isolated across the Tennessee−Black nition as distinct for > 20 yr, this rare species has been Warrior River drainage divide has clear conservation designated as threatened by the American Fisheries and management implications in terms of defining Society since 2000 based on the following criteria: population boundaries and developing sound man- criterion 1—‘present or threatened destruction, mod- agement strategies for this rare species. Second, pop- ification, or reduction of a taxon’s habitat or range’ ulation connectivity among tributaries of the Upper and criterion 5—‘a narrowly restricted range’ (War- Bear Creek system is potentially restricted by Upper ren et al. 2000, Jelks et al. 2008). In addition, the spe- Bear Creek Reservoir (Fig. 1). Status surveys in 1999 cies has been assigned a NatureServe global rank of and 2002 failed to locate blueface darters at histori- G1 (critically imperiled; NatureServe 2018). Distribu- cally known localities downstream of Upper Bear tional patterns and estimated timing of divergence Creek Reservoir (Kuhajda & Mayden 2002). Thus, all from sister populations of bandfin darter E. zonistium localities in the Bear Creek system with contempo- suggest that the blueface darter has a naturally small rary blueface darter occurrences are restricted to geographical distribution. For example, the species is the upper reaches of Little Bear, Turkey, and Bear only known from upland habitats on the western creeks, which drain independently into Upper Bear margin of the Cumberland Plateau, where it is iso- Creek Reservoir (Fig. 1). The potential for reservoir- lated from bandfin darter populations by approxi- induced fragmentation of blueface darter popula-
Fluker et al.: Blueface darter genetics                                       135

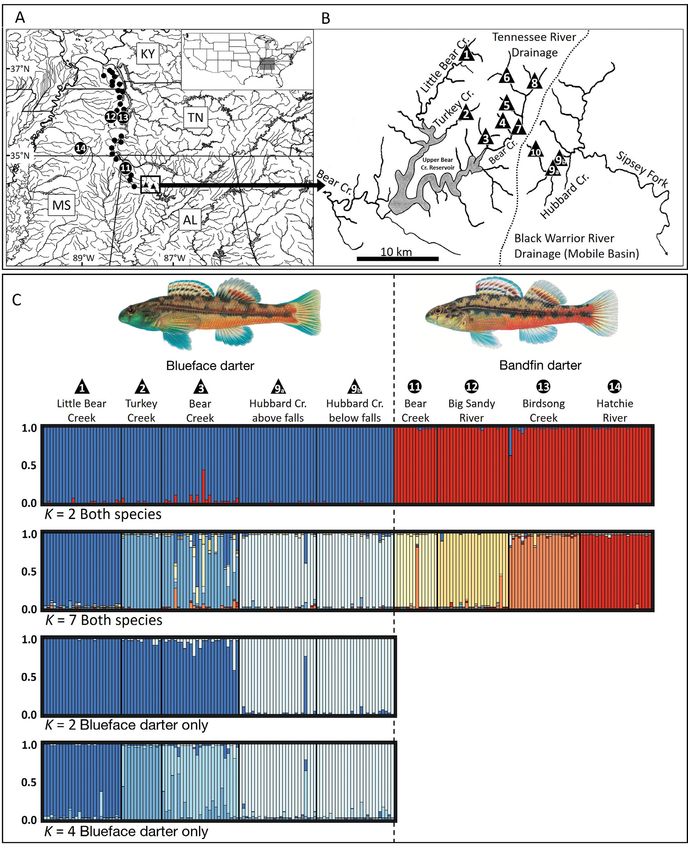
Fig. 1. (A) Geographical distribution of blueface darter Etheostoma cyanoprosopum (triangles) and bandfin darter E. zonistium
(circles). Numbered symbols represent sample sites corresponding to Table 1. (B) Complete distribution of blueface darter,
including boundary between the Tennessee−Black Warrior River drainage divide. (C) STRUCTURE bar plots for differing lev-
els of hierarchical analysis. Each bar represents an individual, and colors represent proportion of assignment to STRUCTURE
 inferred clusters (K ), with shades of blue for STRUCTURE groups primarily associated with blueface darter individuals, and
                                               red/orange/yellow for bandfin darters
136 Endang Species Res 40: 133–147, 2019 tions in tributaries of the Bear Creek system has 2. MATERIALS AND METHODS important conservation implications because recent studies have shown that this type of fragmentation 2.1. Sample collection and DNA extraction may negatively impact small stream fishes more than previously thought (Skalski et al. 2008, Franssen Blueface darters were collected by seine from 10 2012, Hudman & Gido 2013, Fluker et al. 2014b). localities in the Little Bear, Turkey, and Bear Creek Finally, a waterfall of moderate elevation (Kinlock systems of the Tennessee River drainage and the Falls, approx. 4.5 m) represents a putative barrier to Hubbard Creek system of the Black Warrior River connectivity for the blueface darter within the Hub- drainage (Table 1, Fig. 1). Bandfin darters were col- bard Creek system. It is unknown whether there is lected by seine from 4 localities across the species’ contemporary connectivity for the species above and distribution (Table 1, Fig. 1), each of which were below the waterfall or if there is a potential waterfall shown to be genetically distinct by Kozal et al. effect that may result in 1-way gene flow from (2017a). Tissue samples were taken via pelvic or cau- upstream to downstream. In combination with the dal fin clips and preserved in 95% ethanol. Following potential isolating mechanisms listed above, in- tissue sampling, fishes were either released live at creased sedimentation from poor land use practices the point of capture or preserved in 10% formalin (e.g. clear-cut logging, gravel and sand mining) are and deposited as vouchers into the Arkansas State suspected contributors to declines in both occurrence University Museum of Zoology or the University of and abundance of the blueface darter across its Alabama Ichthyological Collection. Whole genomic range (Kuhajda 2004). DNA was extracted from tissues using the DNeasy® This study analyzed microsatellite DNA loci and Blood and Tissue Kit (Qiagen) according to manufac- mtDNA sequence data from the blueface darter turer protocols. and its sister species, the bandfin darter E. zonis- tium, to evaluate the following multiple objectives involving patterns of genetic variation for the blue- 2.2. Microsatellite DNA genotyping and face darter. (1) Patterns of genetic structure and DNA sequencing diversity were compared among blueface darter populations and populations of the sister bandfin In total, 113 blueface and 83 bandfin darter sam- darter to evaluate distinctiveness and to estimate ples were genotyped for 8 microsatellite DNA loci potential loss of diversity since diverging from a with primers originally designed for the Cherokee common ancestor. Because microsatellite DNA loci darter Etheostoma scotti (Esc18, Esc26b, Esc68, used in this study differed from loci developed by Esc132b; Gabel et al. 2008), rainbow darter E. Kozal et al. (2017a), tests of distinctiveness between caeruleum (Eca46EPA, Eca48EPA, Eca49EPA; Tonnis the 2 species were first conducted to ensure loci 2006), and candy darter E. osburni (EosD107; Switzer used herein could confidently discriminate the spe- et al. 2008). Amplification of loci was achieved using cies. In addition, larger sample sizes and broader PCR with the GoTaq® Flexi DNA Polymerase Kit geographic coverage of blueface darters in this (Promega) at a total reaction volume of 13 µl. Each study allow more confident estimates of genetic reaction contained 10 to 100 ng template DNA, 1X diversity and potential for genetic admixture be- colorless buffer, 2.4 mM MgCl2, 0.24 mM dNTP mix- tween species. (2) Patterns of genetic structure and ture, 0.4 µM of each primer, and 0.5 U Taq poly- diversity were assessed for blueface darter popula- merase, and the reaction was brought to volume with tions across the Tennessee−Black Warrior River autoclaved ultrapure water. Thermal cycling condi- drainage divide, with the null hypothesis of no sig- tions included an initial denaturation step of 95°C for nificant differences. (3) Genetic structure and diver- 60 s followed by 35 cycles of 95°C for 30 s, 56°C for sity were evaluated among populations in the Bear 30 s, and 72°C for 90 s, and a final extension step of Creek system to test for the possibility of reservoir- 72°C for 15 min. Final reactions were conducted with induced fragmentation. (4) Levels of genetic struc- forward primers labeled with either 5’ 6-FAM or 5’ ture and diversity were compared above and below HEX fluorophores, and amplified products were Kinlock Falls in the Hubbard Creek system to test electrophoresed with GeneScan™ ROX 500™ size for a potential waterfall isolation effect. Collectively, standard on an ABI 3730 Genetic Analyzer (Univer- these results will provide managing agencies with sity of Maine DNA Sequencing Facility). Microsatel- information to assist with future conservation efforts lite DNA fragment size was determined using for this rare species. GeneScan® analysis software (Applied Biosystems)
Fluker et al.: Blueface darter genetics                                       137

Table 1. Location and number of blueface darter Etheostoma cyanoprosopum and bandfin darter E. zonistium samples
obtained for analysis of mitochondrial DNA (mtDNA) and for microsatellite (msat) DNA loci. Map ID represents collection sites
                                                        in Fig. 1

 Species/                 ID                 Stream system                   Latitude     Longitude      mtDNA        msat
 drainage                                                                      (° N)        (° W)

 Blueface darter
 Tennessee River           1              Little Bear Creek                  34.41825      87.60293          1         25
                           2                Turkey Creek                     34.36372      87.60761                    13
                           3                 Bear Creek                      34.32992      87.57977                    25
                           4                 Bear Creek                      34.35167      87.56167          2
                           5                 Bear Creek                      34.36222      87.54833          2
                           6                 Bear Creek                      34.39286      87.55408          2
                           7                 Bear Creek                      34.33972      87.54722          2
                           8                 Bear Creek                      34.38361      87.52417          2
 Black Warrior River      9a      Hubbard Creek above Kinlock Falls          34.30768      87.50340          4         25
                          9b      Hubbard Creek below Kinlock Falls          34.30875      87.50225          1         25
                          10               Hubbard Creek                     34.32361      87.51694          2
 Bandfin darter
 Tennessee River          11                  Bear Creek                     34.83091      88.05857                    14
                          12               Big Sandy River                   35.80539      88.33439                    23
                          13               Birdsong Creek                    35.91634      88.11398                    23
 Hatchie River            14            West Fork Spring Creek               35.08152      89.11192                    23

and verified manually by 2 independent researchers                 2.3. Genetic diversity and population structure
using Peak Scanner™ (Applied Biosystems) and
Flexibin v.2.0 (Amos et al. 2007). Microsatellite DNA              Conformity of microsatellite DNA loci to Hardy-
data generated in this study and associated specimen             Weinberg equilibrium (HWE) and linkage disequilib-
data are available from the Dryad Digital Repository             rium (LD) were assessed using GENEPOP v.4.2 (Ray-
(accession numbers available at https://doi.org/                 mond & Rousset 1995) with Bonferroni corrections
10.5061/dryad.92j4913).                                          (Rice 1989). Genetic diversity was estimated in Arle-
   A subset of 18 blueface darters from each of the              quin v.3.5 (Excoffier & Lischer 2010) as mean number
distinct drainage basins (Tennessee River = 11, Black            of alleles per locus (A), observed heterozygosity (Ho),
Warrior River = 7; Table 1) was amplified for the                and expected heterozygosity (He). The program HP-
mtDNA cytochrome b (cyt b) gene using the forward                RARE (Kalinowski 2005) was used to estimate num-
and reverse primers and adapted PCR cycling condi-               ber of private allelic richness and allelic richness (AR)
tions of Song et al. (1998). Adapted conditions                  per population. To account for sample size variability,
included using the GoTaq® Flexi DNA Polymerase                   AR provides an unbiased estimate of number of alle-
Kit with the following thermal profile: an initial               les per locus independent of sample size by scaling
denaturation step of 94°C for 5 min followed by 35               all populations to the smallest sample size (Kali-
cycles of 94°C for 60 sec, 56°C for 60 s, and 72°C for           nowski 2005). Kruskal-Wallis and Mann-Whitney U-
90 s and a final extension step of 72°C for 5 min.               tests were used to assess significance of differences
Amplified products were purified using the                       in genetic diversity (A, AR, and He).
QIAquick® PCR Purification Kit (Qiagen) and                        Population genetic structure was assessed for
sequenced on an Applied Biosystems 3730 DNA                      microsatellite DNA loci at differing hierarchical
Analyzer (Keck DNA Sequencing Lab, Yale Univer-                  levels using Bayesian cluster analysis in the pro-
sity). Additional blueface darter cyt b sequences                gram STRUCTURE v.2.3.4 (Pritchard et al. 2000).
(Tennessee River = 5, Black Warrior River = 11) were             Using adaptable models, STRUCTURE probabilisti-
obtained from Kozal et al. (2017b) and were manu-                cally assigns individuals to clusters (K ) with mini-
ally aligned with DNA sequences generated in this                mized deviations from HWE and linkage equilib-
study using BioEdit v.7.2.5 (Hall 1999). All DNA                 rium. All structure analyses were conducted with
sequences generated in this study were submitted to              the correlated allele frequencies model (Falush et
GenBank under accession numbers MN365950 to                      al. 2003), assumed admixture, no a priori assign-
MN365952.                                                        ments of individuals to groups, and 10 replicates of
138 Endang Species Res 40: 133–147, 2019
200 000 iterations (20 000 burn-in). The first level of As suggested by Beerli (2009), a variety of initial
assessment in STRUCTURE included all 196 indi- exploratory runs were conducted under both
viduals of genotyped blueface and bandfin darters Bayesian and maximum likelihood search strategies
to evaluate patterns of global structuring and po- with varying length and number of short and long
tential admixture between species. A second inde- chains, in addition to differing heating schemes.
pendent structure analysis was conducted only Following initial exploratory runs, the following
with the 113 blueface darter samples to assess parameter set provided the most reliable Ne esti-
potential fine-scale genetic structure among popu- mates: maximum likelihood search strategy, random
lations. This hierarchical approach is thought to subset of 15 individuals per population, Brownian
provide more robust depictions of genetic structure motion model, starting theta (Θ) values estimated
for differing scales of analysis, especially for large from FST, and adaptive heating scheme with 4
or complex datasets or cases in which population chains (starting temperatures of 1.0, 1.5, 3.0, and
substructure is obscured in global analyses (e.g. 100 000). Three independent runs were conducted
Vähä et al. 2007). Following runs, appropriate K for each species using the above parameter set
values were determined by examination of the with 10 short chains (50 000 sampled genealogies
mean estimated ln probability of data [lnP(K )] and recorded every 100 steps) and 2 long combined
the ad hoc statistic ΔK (Evanno et al. 2005) in the chains (500 000 sampled genealogies recorded
program Structure Harvester (Earl & vonHoldt every 100 steps). Theta estimates (and 95% CI)
2012). from the 3 independent runs were averaged and
Genetic structure and divergence were further converted to long-term Ne using the equation Θ =
evaluated for differing hierarchical levels with ana- 4Neμ with the mutation rate (μ) of 5 × 10⁻⁴. Micro-
lysis of molecular variance (AMOVA) of microsatel- satellite DNA mutation rates have not been esti-
lite and mtDNA data in Arlequin. First, microsatellite mated for darters, so the above mutation rate for
data were used to estimate differentiation between common carp Cyprinus carpio (Yue et al. 2007) was
all blueface and bandfin darter samples. Second, used, which is similar to rates from zebrafish Danio
both microsatellite and mtDNA data were used to rerio (Shimoda et al. 1999) and other vertebrates
estimate the extent of differentiation between blue- (Ellegren 2000). Difference in long-term Ne be-
face darter populations across the Tennessee−Black tween species was assessed with a Mann-Whitney
Warrior River drainage divide. Isolation by distance U-test.
among blueface darter sampling locations was The program BOTTLENECK v. 1.2.02 (Piry et al.
assessed with Mantel tests in Arlequin, using micro- 1999) was used to test for recent declines (i.e. within
satellite DNA-based FST values plotted against the the past few dozen generations) in population size
shortest distance along the stream network between for both blueface and bandfin darter populations.
locations. Significance of F-statistics, including pair- Tests were conducted with 5000 replications using
wise population comparisons, and Mantel tests were the 2-phase model with a proportion of 0.95 single-
assessed with 10 000 permutations. step mutations and 0.12 variance of multi-step
mutations (Piry et al. 1999, Cristescu et al. 2010).
The significance of He excess compared to Heq (the
2.4. Effective population size and heterozygosity expected based on number of alleles
demographic history and sample size) was evaluated with Wilcoxon sign-
rank tests. The M-ratio method (Garza & Williamson
Contemporary effective population size (Ne) of 2001, Williamson-Natesan 2005) was used to evalu-
blueface and bandfin darter populations was esti- ate the possibility of prolonged, severe, or older
mated from microsatellite DNA data with the pro- reductions in Ne for blueface and bandfin darter
gram NEESTIMATOR v.2.1 (Do et al. 2014). Esti- populations. The programs M_P_Val.exe and Criti-
mates of Ne were conducted with the bias-corrected cal_M.exe (Garza & Williamson 2001) were used to
version of the LD method (Waples & Do 2010) with estimate the ratio of the number of alleles to the
Pcrit = 0.05 (the minimum frequency for included range in allele size (M ) and population-specific crit-
alleles) and jackknife-based CIs as recommended ical M values (Mc). Population-specific M-ratios
by Gilbert & Whitlock (2015). Long-term effective were estimated with the following parameter set,
population sizes (Ne) were estimated for both spe- which is considered conservative by Garza &
cies independently using microsatellite DNA data Williamson (2001): 2-phase model with 90% single-
with the program migrate-n v.3.7.2 (Beerli 2018). step mutations, mean size of non-1-step mutations =Fluker et al.: Blueface darter genetics 139
3.5, and pre-bottleneck Θ values of 10. M_P_Val.exe and the Hubbard Creek system (n = 14). The re-
was run with 10 000 simulations to test the probabil- maining 6 haplotypes were harbored by single indi-
ity that a smaller M-ratio would be expected under viduals (2 in the Bear Creek system and 4 in the
equilibrium conditions. Hubbard Creek system).
3. RESULTS 3.2. Genetic diversity
3.1. Characteristics of microsatellite DNA loci The number of alleles per locus ranged from 6 to
and mtDNA sequences 38 for the blueface darter (1−24 at the population
level) and 17 to 56 for the bandfin darter (3−24 at
For microsatellite DNA loci, 8 of the 72 locus− the population level). At the population level,
population comparisons significantly deviated from average measures of genetic diversity (A, AR, He)
HWE; 5 of these were significant following correc- were generally lower for the blueface darter com-
tion. However, deviations were not prevalent in 1 pared to the bandfin darter (Table 2), and these
locus or population. Only 1 of the 28 comparisons differences were significant for median values (A:
among microsatellite DNA locus pairs showed sig- z = −2.03, p = 0.04; AR: z = −2.19, p = 0.03; He: z =
nificant deviation for LD (Eca48EPA and EosD107); −2.11, p = 0.03). Genetic diversity was not signifi-
however, this was not significant following correction. cantly different between blueface darter popula-
Because there were no clear patterns of deviation tions across the Tennessee−Black Warrior River
from HWE and LD for specific loci, all 8 loci were drainage divide nor above and below Kinlock Falls
retained for final analyses. in the Hubbard Creek system (p > 0.05 for A, AR,
When aligned with the 16 cyt b sequences ob- He ; Table 2). However, when comparing differ-
tained from Kozal et al. (2017b), the complete ences in genetic diversity among blueface darter
mtDNA dataset consisted of 34 individual blueface populations in the Bear Creek system (i.e. Little
darter cyt b sequences (Bear Creek system = 16, Bear, Turkey, and Bear creeks; Table 2), median
Hubbard Creek system = 18). The cyt b dataset was values were significantly different (A: H = 9.70, p <
trimmed from 1140 to 1113 bp due to missing data 0.01; AR: H = 7.84, p < 0.02; He: H = 6.41, p <
in the 5’ region of the gene. A total of 7 unique 0.05). Post hoc tests revealed that these differences
mtDNA haplotypes were identified among the 34 were largely driven by significant population pair-
individuals. One haplotype was shared by 28 indi- wise comparisons between Turkey (lower median
viduals ubiquitously throughout the range of the values) and Bear creeks (p < 0.05 for A, AR, He ;
species, including the Bear Creek system (n = 14) Table 2).
Table 2. Sample sizes and genetic diversity estimates (averaged over 8 microsatellite DNA loci) for blueface darter Etheostoma
cyanoprosopum and bandfin darter E. zonistium included in this study. Population identifier (ID) is mapped and listed in Fig. 1
and Table 1. N: number of individuals; NA: total number of alleles; A: mean number of alleles per locus; AR: allelic richness;
PA: private allelic richness; Ho: heterozygosity observed; He: heterozygosity expected
Species/location ID N NA A AR PA Ho He
Blueface darter
Little Bear Creek 1 25 72 9.00 7.37 0.32 0.684 0.749
Turkey Creek 2 13 51 6.38 6.38 0.27 0.714 0.780
Bear Creek 3 25 100 12.50 10.08 0.91 0.750 0.820
Hubbard Creek above falls 9a 25 67 8.38 7.07 0.30 0.704 0.706
Hubbard Creek below falls 9b 25 67 8.38 7.31 0.24 0.665 0.698
Population mean 71.4 8.93 7.64 0.41 0.703 0.751
Bandfin darter
Bear Creek 11 14 53 6.63 6.62 1.20 0.761 0.762
Big Sandy River 12 23 131 16.38 12.74 3.27 0.875 0.878
Birdsong Creek 13 23 99 12.38 10.23 1.51 0.864 0.847
Hatchie River 14 23 89 11.13 9.06 4.63 0.713 0.797
Population mean 93.0 11.63 9.66 2.65 0.803 0.821140 Endang Species Res 40: 133–147, 2019
Table 3. AMOVA of microsatellite DNA loci and mtDNA for differing levels of comparisons showed moderate to
hierarchical groupings of blueface darter Etheostoma cyanoprosopum and strong structuring among their re-
bandfin darter E. zonistium. The source of variation column defines the hier-
spective populations (FST ranged from
archical test for each estimated fixation index (F ). Fct explains variation
between the two groups (species). Fsc explains variation among populations 0.139 to 0.254, p < 0.01 for all; Table 3).
within each group (species). Fis explains variation among individuals within In the K = 7 configuration, all 4
populations. Fit explains variation of individuals relative to the total of all indi- bandfin darter populations were re-
viduals. *Significant results (p < 0.01). (–) No hierarchical results, as we were solved as relatively discrete groups
only able to test for a difference between the 2 drainages with mtDNA.
with minimal admixture. Similarly,
blueface darter populations from Little
Species/ Source of variation Fixation
Bear, Turkey, and Hubbard creeks
data type index
were resolved in relatively discrete
Both groups with minimal admixture; how-
microsatellites Between species FCT = 0.083* ever, approximately 40% of individu-
Among populations within species FSC = 0.113*
als from the Bear Creek population
Among individuals within populations FIS = 0.020
Within individuals FIT = 0.203* showed mixed assignment with other
Blueface darter groups, and the remaining individuals
microsatellites Between Tennessee−Black Warrior FCT = 0.062 assigned strongly in the same cluster
drainages with Turkey Creek (Fig. 1). Clusters
Among populations within drainages FSC = 0.053* recovered in the K = 7 scenario were
Among individuals within populations FIS = 0.057*
Within individuals FIT = 0.163*
supported by significant FST values
mtDNA Between Tennessee−Black Warrior FST = 0.014 (Tables 3 & 4) with the exception of
drainages the Bear Creek population of blueface
Within drainages − darter, which showed weak but signif-
icant divergence compared to Turkey
Creek (FST = 0.059, p < 0.01) despite
3.3. Population structure and divergence being largely assigned to the same cluster in STRUC-
TURE plots (Fig. 1).
Bayesian STRUCTURE runs with all blueface and Independent STRUCTURE runs with only blueface
bandfin darter samples together suggested K = 7 as darter samples suggested K = 4 as the most likely
the most likely number of clusters based on evaluation number of clusters based on evaluation of lnP(K ), but
of both lnP(K ) and ΔK (Fig. 1; Figs. S1 & S2 in the K = 2 was suggested by the ΔK method (Fig. 1;
Supplement at www.int-res.com/articles/suppl/n040 Figs. S3 & S4). In both scenarios, individuals above
p133_supp.pdf). The ΔK method also revealed an ad- and below Kinlock Falls in the Hubbard Creek sys-
ditional peak at K = 2, which corresponded to the tem were resolved in the same cluster (Fig. 1), and
global level of clustering between species (Fig. 1). Di- this was corroborated by a non-significant FST value
vergence between the 2 species was significant (FCT = (Table 4). Blueface darter populations across the
0.083, p < 0.01; Table 3), and pairwise population Tennessee−Black Warrior River divide were resolved
Table 4. Estimated pairwise fixation indices (FST), based on 8 microsatellite DNA loci, among populations of blueface darter
Etheostoma cyanoprosopum and bandfin darter E. zonistium (separated by dashed line). All values significant (p < 0.00001)
unless noted (ns: not significant). Population numbers are mapped and listed in Fig. 1 and Table 1
Population 1 2 3 9a 9b 11 12 13 14
1. Little Bear Creek −
2. Turkey Creek 0.115 −
3. Bear Creek 0.060 0.059 −
9a. Hubbard Creek above falls 0.161 0.131 0.092 −
9b. Hubbard Creek below falls 0.133 0.132 0.062 0.004ns −
11. Bear Creek 0.139 0.152 0.108 0.203 0.173 −
12. Big Sandy River 0.177 0.171 0.155 0.230 0.211 0.095 −
13. Birdsong Creek 0.150 0.171 0.141 0.219 0.204 0.102 0.113 −
14. Hatchie River 0.205 0.202 0.177 0.254 0.228 0.140 0.180 0.160 −Fluker et al.: Blueface darter genetics 141
as discrete clusters in the K = 2 scenario; however, long-term Ne were significantly lower for blueface
this difference was not significant in the hierarchical darter (z = −3.83, p < 0.01).
AMOVA (FCT = 0.062, p = 0.10; Table 3) despite sig- The BOTTLENECK test results indicated a mode-
nificant low to moderate levels of divergence shift distortion of allele proportions for the Turkey
between all of the pairwise population comparisons Creek population of blueface darter. However, eval-
between drainages (FST ranged from 0.062 to 0.161, uation of Wilcoxon-sign rank tests revealed no signif-
p < 0.01 for all; Table 4). The mtDNA-based AMOVA icant excess of He (i.e. no evidence for recent bottle-
comparing between drainages revealed no signifi- neck) for the 9 populations examined (p > 0.05 for
cant divergence (Table 3). The K = 4 scenario was all). Alternatively, population-specific M-ratios were
most consistent with patterns of significant diver- significantly lower than critical M values for 4 of 5
gence based on pairwise population comparisons of blueface darter populations and 3 of 4 bandfin darter
FST (Table 2). For example, individuals from the 3 populations (Table 5).
populations in the Bear Creek system generally
assign with high probability to their respective clus-
ter, and individuals from the Hubbard Creek system 4. DISCUSSION
assign to their own cluster (Fig. 1). Independent
Mantel tests indicated no pattern of isolation by dis- 4.1. Comparisons of genetic structure and diversity
tance among all blueface darter populations (r2 = between blueface and bandfin darters
0.46, p = 0.08) nor among Bear Creek populations of
the blueface darter (r2 = −0.73, p = 0.83). The application of genetic data to conservation
planning for imperiled species has expanded vastly
over the past few decades, but resolving taxonomic
3.4. Effective population size and uncertainty and understanding population genetic
demographic history structure, isolation, and levels of genetic diversity
and Ne remain as primary goals in the field of conser-
Four of the 9 contemporary Ne estimates resulted in vation genetics (Frankham 1995, 2010, DeSalle &
values of infinity (Table 5). NEESTIMATOR was able Amato 2004, Hunter et al. 2018). Resolving taxonomic
to calculate harmonic mean values of Ne for 3 blue- uncertainty for imperiled species intuitively involves
face darter populations (range 14−630) and 2 bandfin comparisons of genetic, morphological, and other bi-
darter populations (range 67−113). In all but one ological characteristics with closely related species.
population estimate, the upper bound of the 95% CI However, measures of genetic diversity and Ne are
was infinity (Table 5). Three independent runs in often considered for imperiled species without com-
Migrate-n resulted in highly consis-
tent estimates of long-term Ne for
Table 5. Microsatellite-based estimates of theta (Θ) derived from the program
populations of blueface darter (95%
Migrate-n and corresponding estimates of long-term effective population size
CIs from all runs overlapped). When (Ne). Contemporary estimates of Ne were determined using the linkage dis-
averaged over the 3 runs, estimates of equilibrium (LD) method in NEESTIMATOR. Ne estimates are followed by
Ne ranged from 290 to 896 (mean = 95% CI in parentheses. Critical M values (Mc) are followed by M-ratios for
485) for blueface darter populations each population. *Significant values (p < 0.05)
(Table 5, Fig. S5). Despite exploratory
efforts to improve long-term Ne esti- Species/location Ne Migrate-n Ne LD Mc M-
ratio
mates for bandfin darter populations,
variation was greater among the 3 Blueface darter
independent Migrate-n runs when Little Bear Creek 438 (392−491) 630 (26−∞) 0.653 0.523*
compared to blueface darter esti- Turkey Creek 307 (274−345) 14 (4−526) 0.604 0.546*
Bear Creek 886 (803−1004) ∞ (52−∞) 0.653 0.658
mates. However, 95% CIs overlapped
Hubbard Creek
for 2 of 3 estimates in all but one pop- above falls 290 (263−320) 466 (40−∞) 0.647 0.576*
ulation (Big Sandy River). When aver- below falls 495 (456−551) ∞ (37−∞) 0.647 0.606*
aged over the 3 runs, estimates of Ne Bandfin darter
ranged from 712 to 4130 (mean = Bear Creek 712 (631−807) ∞ (12−∞) 0.613 0.361*
1879) for bandfin darter populations Big Sandy River 4130 (3676−4634) 113 (30−∞) 0.651 0.615*
Birdsong Creek 1347 (1209−1506) 67 (19−∞) 0.651 0.617*
(Table 5, Fig. S5). When compared Hatchie River 1329 (1194−1488) ∞ (35−∞) 0.651 0.740
between species, median estimates of142 Endang Species Res 40: 133–147, 2019 parisons to close relatives. Ideally, levels of genetic large estimates due to sampling error (Do et al. 2014, diversity for imperiled species are best characterized Gilbert & Whitlock 2015; Table 2). However, Waples by comparisons to sister species or close relatives & Do (2010) suggest that estimates of the lower using the same DNA loci (e.g. Frankham 1997, Spiel- bound of the CI can provide information about plau- man et al. 2004, Fluker et al. 2010). Thus, the first ob- sible limits of Ne that may be useful in conservation jective of this study was to assess patterns of genetic applications. While statistical comparisons of con- structure and diversity among blueface and bandfin temporary Ne between species were not possible, rel- darter populations to evaluate distinctiveness and to ative comparisons of populations with point esti- estimate potential loss of diversity since diverging mates and of the lower bound of the CI suggest that from a common ancestor. contemporary Ne may be somewhat comparable Results from STRUCTURE and AMOVA analyses between the species. The low point estimate and in this study corroborate the genetic distinctiveness lower bound of the Turkey Creek population of blue- of the blueface darter as demonstrated by Kozal et al. face darter is suggestive of lower Ne compared to (2017a). Further, the results of this study and that by other populations. Despite this possible difference, Kozal et al. (2017a) provide strong evidence that BOTTLENECK analyses failed to detect recent blueface and bandfin darters do not share contem- declines in Ne for populations of either species. porary gene flow, nor do they exhibit patterns of Comparisons of long-term Ne between species and hybridization or genetic introgression, a phenome- evaluation of deeper bottlenecks using M-ratio sta- non relatively common among darters (Keck & Near tistics were more robust than contemporary esti- 2009, Near et al. 2011). mates. Overall, long-term Ne of the blueface darter Estimates of genetic diversity (A, AR, He) were all was significantly lower and approximately one-third significantly lower for blueface darter populations of bandfin darter estimates (Table 5). Estimates of Ne compared to populations of the sister bandfin darter. for the Big Sandy River population of bandfin darter This finding fits with predictions of Frankham (1996) were unusually high, possibly resulting from higher that genetic variation will be greater in species with variation in Migrate-n runs (Fig. S5). However, when larger geographic distributions (i.e. bandfin darter), this population was removed from statistical tests for but the reduction in diversity renders blueface darter differences in long-term Ne, the difference between populations more susceptible to stochastic events, species remained significantly lower for blueface changing environmental conditions, and reduced fit- darter populations. Interestingly, M-ratios indicated ness (Reed & Frankham 2003, Spielman et al. 2004). significant reductions in Ne for all but one population Based on 25 microsatellite DNA loci not used in this of each species (Table 5). These results can be inter- study and differing sample sizes, Kozal et al. (2017a) preted as evidence for bottlenecks that were pro- reported mean estimates of genetic diversity for longed, severe, or old enough that populations may blueface (A = 3.06; He = 0.36; n = 20) and bandfin (A = have had time to recover (Garza & Williamson 2001, 5.09; He = 0.66; n = 98) darter populations substan- Williamson-Natesan 2005). For the blueface darter, tially lower compared to our estimates (Table 2). Dif- the Bear Creek population has the largest long-term ferences in estimates of genetic diversity between Ne, with no evidence of historic or recent bottlenecks, this study and Kozal et al. (2017a) may be explained which likely reflects relative stability and a greater in part by differences in sample sizes, microsatellite amount of suitable habitat remaining within the Bear loci used, or a combination of both, but the number of Creek system (Fig. 1). However, all other populations loci and sample sizes used in this study were ade- exhibit signatures of bottlenecks that are likely asso- quate for confident estimates of population genetic ciated with isolation between drainages (i.e. Hub- structure and diversity (see Ruzzante 1998, Hale et bard Creek) and reservoir-induced fragmentation al. 2012, Arthofer et al. 2018). Despite these differ- (i.e. Little Bear and Turkey creeks). Although band- ences, reanalysis of microsatellite DNA data fin darter populations had higher relative Ne, all 3 obtained from Kozal et al. (2017b) showed signifi- populations in the Tennessee River drainage showed cantly lower genetic diversity (A: z = 4.80, p < 0.01; evidence for genetic bottlenecks based on M-ratio He: z = 4.56, p < 0.01) for blueface darter populations analyses (Table 5). Given the propensity for fine- compared to bandfin darter populations. scale population isolation observed for several Estimates of contemporary Ne among populations closely related darters in the subgenus Ulocentra of both species using the LD method were somewhat (Powers & Warren 2009, Harrington & Near 2012), it uninformative based on large CIs and several point is likely that reductions in Ne for Tennessee River estimates of infinity, which are assumed as infinitely populations of bandfin darter are associated with
Fluker et al.: Blueface darter genetics                                    143

patterns of genetic differentiation (Fig. 1, Table 4)          life-history or dispersal characteristics may limit their
and, thus, isolating mechanisms within the Ten-                ability for interdrainage migration (Berendzen et al.
nessee River drainage (Kozal et al. 2017a).                    2008, Fluker et al. 2014a). The peculiar occurrence of
   In conservation genetic studies, the quantification of      the blueface darter in headwater tributaries of the
genetic diversity and Ne provide comparable meas-              Bear Creek system of the Tennessee River drainage
ures to determine the status of populations, identify          and the Hubbard Creek system of the Black Warrior
processes that affect populations, and better under-           River drainage (Fig. 1) raises questions about pro-
stand susceptibility of populations to changing envi-          cesses leading to this distributional pattern and
ronmental conditions (Lande 1988, DeSalle & Amato              potential connectivity. The hypothesis that the blue-
2004, Frankham 2005). Direct comparisons of genetic            face darter gained access to the Black Warrior River
diversity and Ne for imperiled species with sister or          drainage from the Tennessee River drainage via
closely related species allow for more specific predic-        headwater piracy (Dycus & Howell 1974, Boschung &
tions about the patterns and processes that have               Mayden 2004) is supported by distributional patterns
affected imperiled species and their populations. For          of close relatives and other fish species. For example,
example, Fluker et al. (2010) found that genetic diver-        all close relatives of the blueface darter (i.e. bandfin
sity of the endangered watercress darter Etheostoma            darter, firebelly darter E. pyrrhogaster, and Chicka-
nuchale was significantly lower compared to its com-           saw darter E. cervus) are distributed in coastal plain
mon, widespread sister species (Gulf darter E. swaini),        habitats of the Tennessee, Hatchie, Obion, and
likely the result of a small number of founders at             Forked Deer River drainages, with no historical
speciation. Although genetic diversity and Ne were             occurrences in the Mobile Basin (Powers & Mayden
reduced for watercress darter populations, rendering           2003, Kozal et al. 2017a). At least 2 other fishes
them more susceptible to stochastic events, demo-              (pretty shiner Lythrurus bellus and rough shiner
graphic analyses suggested that Ne had a long-term             Notropis baileyi) have their distributions in the
pattern of stability reflecting the environmental stabil-      Mobile Basin and in the Bear Creek system of the
ity of habitats (Fluker et al. 2010). The present study        Tennessee River drainage, which are also hypothe-
revealed a similar pattern of reduced genetic diversity        sized to be the results of stream capture events
and Ne for the narrowly distributed blueface darter            where headwater tributaries of the 2 drainages inter-
compared to the widespread sister bandfin darter. The          digitate (Wall 1968, Boschung & Mayden 2004).
distributional pattern of the blueface darter, i.e. small         The lack of significant genetic divergence between
distributional range on the margin of the widespread           blueface darter populations across the Tennessee−
sister bandfin darter, in conjunction with the upland          Black Warrior River drainage divide based on hierar-
isolation of the blueface darter on the Cumberland             chical AMOVA of both mtDNA and microsatellites
Plateau (versus lowland Gulf Coastal Plain for the             (Table 3) indicates that the species has a relatively
bandfin darter) is indicative of peripheral isolation or       recent history in the Black Warrior River drainage.
peripatric speciation (Wiley 1981, Wiley & Mayden              However, STRUCTURE analyses recovered the Hub-
1985, Coyne & Orr 2004). Patterns of genetic structure,        bard Creek population as a distinct cluster compared
diversity, and Ne between the species fit with predic-         to Bear Creek populations in all scenarios except the
tions of peripatric speciation and suggest that initial        K = 2 between-species comparison (Fig. 1). Further,
divergence between the 2 species involved a founder            all pairwise FST comparisons among Hubbard Creek
event in upland habitats of the Cumberland Plateau.            and Bear Creek populations revealed significant low
M-ratio statistics suggest that populations of both spe-       to moderate differentiation (Table 4). Collectively,
cies have experienced reductions in Ne since specia-           these results suggest a lack of ongoing gene flow
tion, likely due to natural drainage level isolation, in       across the Tennessee−Black Warrior River drainage
addition to reservoir-induced fragmentation for blue-          divide, and enough time has passed since their isola-
face darter populations in the Bear Creek system.              tion for accumulation of slight differences in allele
                                                               frequencies.

4.2. Genetic variation across the Tennessee−Black
         Warrior River drainage divide                                    4.3. Genetic variation within the
                                                                                 Bear Creek system
  Freshwater fishes often have unique patterns of
population genetic structuring because they are con-             Upper Bear Creek Reservoir was completed in
fined within the drainage basins they inhabit, and             1978, resulting in the inundation of approximately
144 Endang Species Res 40: 133–147, 2019 half of the free-flowing stream reaches in the Bear among sampling localities, suggesting that inhos- Creek system historically occupied by the blueface pitable habitat of the reservoir likely represents a darter. Based on extensive status surveys (Kuhajda & barrier to gene flow among the remaining popula- Mayden 2002), Kuhajda (2004) considered the blue- tions in Little Bear, Turkey, and Bear creeks. Interest- face darter extirpated from historic sites inundated ingly, all measures of genetic diversity were signifi- by, and downstream of, the reservoir. Preferred habi- cantly lower in the Turkey Creek population when tat of the blueface darter is found above and below compared to Bear Creek, which may be related to the riffles over bedrock and cobble in small low-gradient limited remaining preferred habitat in Turkey Creek streams (Kuhajda 2004), suggesting that lentic habi- (Fig. 1). Collectively, results from mtDNA suggest tats of Upper Bear Creek Reservoir may represent that blueface darter populations in the Bear Creek inhospitable habitat for the species. Thus, genetic system were historically connected, but contempo- structure and diversity were evaluated among rary patterns of genetic structuring revealed by populations in the Bear Creek system to test for the microsatellites are consistent with reservoir-induced possibility of reservoir-induced fragmentation (e.g. fragmentation. Skalski et al. 2008, Franssen 2012, Hudman & Gido 2013, Fluker et al. 2014b). While it can be difficult to disentangle historical versus contemporary patterns 4.4. Genetic variation above and below of genetic structuring when assessing for reservoir- Kinlock Falls in the Hubbard Creek system induced fragmentation of stream fishes, data from molecular markers with differing evolutionary rates Given the small amount of stream length occupied can provide testable predictions (see Fluker et al. by the blueface darter in the Hubbard Creek system 2014b). For example, concordant patterns of signifi- (approx. 5.4 km; Kuhajda 2004), even small within- cant genetic structuring for both mtDNA and micro- stream barriers such as Kinlock Falls may reduce satellites among populations separated by the re- intrapopulation connectivity and result in patterns of servoir would be indicative of historical structuring 1-way gene flow from upstream to downstream likely in place prior to reservoir construction. Alter- (Meeuwig et al. 2010). Lack of significant FST values natively, significant patterns of genetic structuring between individuals above and below Kinlock Falls, based on microsatellites, but not mtDNA, would indi- in conjunction with high assignment probability of all cate contemporary genetic structuring possibly in- individuals to a single genetic cluster in STRUCTURE duced by reservoir fragmentation. analyses, suggests either that genetic exchange is not With the exception of 2 singleton mtDNA haplo- impeded by the waterfall or that isolation is recent types, a single common and abundant haplotype was enough that allele frequency differences are not de- shared broadly across all Bear Creek system popula- tectable. Status surveys in the Hubbard Creek system tions, indicating a lack of historical isolation among indicated that the majority of blueface darter occur- Little Bear, Turkey, and Bear Creek populations. This rences are above Kinlock Falls (Kuhajda & Mayden scenario is consistent with a single panmictic popula- 2002). Given this distributional pattern, it is possible tion historically, and contemporary isolation among that blueface darters downstream of Kinlock Falls creek systems is recent enough that mtDNA haplo- represent a sink population receiving 1-way gene type frequencies remain unchanged by the lineage flow from the source population above the falls. Con- sorting process (Funk & Omland 2003, Omland et al. servation plans for the Hubbard Creek population 2006). However, microsatellite-based STRUCTURE should include more detailed studies to monitor po- and AMOVA analyses revealed significant low to tential connectivity of blueface darters above and moderate structuring among populations. For exam- below Kinlock Falls to evaluate the possibility of a ple, the K = 7 STRUCTURE scenario (both species source (upstream) and sink (downstream) scenario. included) largely resolved individuals from Turkey Creek and Bear Creek populations in the same clus- ter but provided support for the distinctiveness of the 4.5. Conclusions Little Bear Creek population (Fig. 1). The K = 4 sce- nario (blueface darter only) indicated a pattern of Among the >1000 North American freshwater substructuring among all Bear Creek populations fishes, approximately 10% of species diversity is esti- consistent with significant pairwise FST comparisons mated to remain undescribed (Jelks et al. 2008, April (Fig. 1, Table 4). Genetic structuring among Bear et al. 2011). Further, data deficiencies for many de- Creek populations was not explained by distance scribed and undescribed imperiled North American
Fluker et al.: Blueface darter genetics                                         145

freshwater fishes delay determinations of conserva-               by the Arkansas State University Department of Biological
tion status by entities such as the IUCN, US Fish and             Sciences, the University of Alabama Department of Biologi-
                                                                  cal Sciences, and the Tennessee Aquarium Conservation
Wildlife Service, and state agencies (e.g. Jelks et al.           Institute. Collection permits were issued by the Alabama
2008). Results from this study provide 3 main conclu-             Department of Conservation and Natural Resources and the
sions that will help prioritize conservation planning             Tennessee Wildlife Resources Agency. Sampling for this
for the rare blueface darter. First, results from this            project was approved by the Arkansas State University Insti-
                                                                  tutional Animal Care and Use Committee (IACUC Protocol
study corroborate the distinctiveness of the blueface
                                                                  number 747441-1).
darter as demonstrated by Kozal et al. (2017a). Lower
levels of genetic diversity and long-term Ne for the                                  LITERATURE CITED
blueface darter, compared to the sister bandfin
                                                                  Amos W, Hoffman JI, Frodsham A, Zhang L, Best S, Hill AV
darter, are indicative of differences in geographic
                                                                      (2007) Automated binning of microsatellite alleles:
range size and are possible signatures of a founder                   problems and solutions. Mol Ecol Notes 7:10−14
event at speciation. Although no recent genetic bot-              April J, Mayden RL, Hanner RH, Bernatchez L (2011)
tlenecks were detected for the blueface darter, signa-                Genetic calibration of species diversity among North
tures of historic reductions in Ne, small geographic                  America’s freshwater fishes. Proc Natl Acad Sci USA 108:
                                                                      10602−10607
range size, and reduced genetic diversity render the              Arthofer W, Heussler C, Krapf P, Schlick-Steiner BC, Steiner
species more susceptible to local extirpation com-                    FM (2018) Identifying the minimum number of micro-
pared to the more widespread bandfin darter. Sec-                     satellite loci needed to assess population genetic struc-
ond, analysis of mtDNA data suggested that the Hub-                   ture: a case study in fly culturing. Fly (Austin) 12:13−22
                                                                  Beerli P (2009) How to use MIGRATE or why are Markov
bard Creek population was the result of a recent
                                                                      chain Monte Carlo programs difficult to use? In:
interdrainage transfer from the Bear Creek system.                    Bertorelle G, Bruford MW, Hauffe HC, Annapaola R,
While hierarchical AMOVA did not recover signifi-                     Vernesi C (eds) Population genetics for animal conserva-
cant genetic differentiation between blueface darter                  tion. Cambridge University Press, Cambridge, p 42−79
populations across the Tennessee−Black Warrior                    Beerli P (2018) Migrate-n v.3.7.2: estimation of population
                                                                      sizes and gene flow using the coalescent. https://
River drainage divide, Bayesian STRUCTURE analy-                      peterbeerli.com/migrate-html5/index.html (accessed 27
ses and pairwise population comparisons of FST sug-                   May 2019)
gest contemporary isolation between the drainages.                Berendzen PB, Simons AM, Wood RM, Dowling TE, Secor
Thus, it is recommended that Bear Creek populations                   CL (2008) Recovering cryptic diversity and ancient
                                                                      drainage patterns in eastern North America: historical
of blueface darter (i.e. Little Bear, Turkey, and Bear                biogeography of the Notropis rubellus species group
creeks) be treated independently from the Hubbard                     (Teleostei: Cypriniformes). Mol Phylogenet Evol 46:
Creek population in management and conservation                       721−737
planning. Third, results from this study revealed pos-            Boschung HT, Mayden RL (2004) Fishes of Alabama. Smith-
                                                                      sonian Books, Washington, DC
sible reservoir-induced fragmentation for the Bear
                                                                  Coyne JA, Orr HA (2004) Speciation. Sinauer, Sunderland,
Creek populations of blueface darter, a scenario in                   MA
which historical connectivity among tributaries of the            Cristescu R, Sherwin WB, Handasyde K, Cahill V, Cooper
Bear Creek system is now severed by the inhos-                        DW (2010) Detecting bottlenecks using BOTTLENECK
pitable habitat of Upper Bear Creek Reservoir. Cou-                   1.2.02 in wild populations: the importance of the micro-
                                                                      satellite structure. Conserv Genet 11:1043−1049
pled with the infrequent occurrence of blueface                   DeSalle R, Amato G (2004) The expansion of conservation
darter captures in Turkey Creek (Kuhajda & Mayden                     genetics. Nat Rev Genet 5:702−712
2002, P. O’Neil pers. comm.), low genetic diversity of            Do C, Waples RS, Peel D, Macbeth GM, Tillett BJ, Ovenden
this population is of particular concern. Continued                   JR (2014) NeEstimator v2: re-implementation of software
                                                                      for the estimation of contemporary effective population
monitoring and quantitative surveys would help
                                                                      size (Ne) from genetic data. Mol Ecol Resour 14:209−214
to better characterize occurrence, abundance, and                 Dycus DL, Howell WM (1974) Fishes of the Bankhead
changes in census size for blueface darter popu-                      National Forest of Alabama. Alabama Department of
lations in the isolated tributaries of the Bear Creek                 Conservation and Natural Resources, Montgomery, AL
                                                                  Earl DA, vonHoldt BM (2012) STRUCTURE HARVESTER: a
system.
                                                                      website and program for visualizing STRUCTURE output
                                                                      and implementing the Evanno method. Conserv Genet
Acknowledgements. We thank M. G. Bennett, A. T. Hook, J.              Resour 4:359−361
H. Howell, T. K. Lee, S. M. Mitchell, D. A. Neely, and M.         Ellegren H (2000) Microsatellite mutations in the germline:
Sandel for assistance with field sampling and J. Khudam-              implications for evolutionary inference. Trends Genet 16:
rongsawat for assistance with DNA sequencing. Fish illus-             551−558
trations were used with permission from J. R. Tomelleri. This     Evanno G, Regnaut S, Goudet J (2005) Detecting the
work was funded by an Arkansas State University Faculty               number of clusters of individuals using the software
Research Award (FRAC), with additional support provided               STRUCTURE: a simulation study. Mol Ecol 14:2611−2620
You can also read


