Not out of the woods yet: genetic insights related to the recovery of the pine marten (Martes martes) in Ireland
←
→
Page content transcription
If your browser does not render page correctly, please read the page content below

Biological Journal of the Linnean Society, 2020, XX, 1–15. With 5 figures.

Not out of the woods yet: genetic insights related to the
recovery of the pine marten (Martes martes) in Ireland

                                                                                                                                  Downloaded from https://academic.oup.com/biolinnean/advance-article/doi/10.1093/biolinnean/blaa214/6144720 by guest on 22 February 2021
CATHERINE O’REILLY1, PETER TURNER1, DECLAN T. O’MAHONY2,
JOSHUA P. TWINING3, DAVID G. TOSH4, CHRISTOPHER SMAL5, KATE MCANEY6,
CIARA POWELL1, JOHN POWER1 and DENISE B. O’MEARA1,*,
1
  Molecular Ecology Research Group, Eco-innovation Research Centre, School of Science and Computing,
Waterford Institute of Technology, Cork Road, Waterford, Ireland
2
  Agri-Food and Biosciences Institute, Belfast BT9 5PX, Northern Ireland, UK
3
  School of Biological Sciences, Queen’s University of Belfast, 17 Chlorine Gardens, Belfast BT9 5AJ,
Northern Ireland, UK
4
  National Museums Northern Ireland, 153 Bangor Road, Holywood BT18 0EU, Northern Ireland, UK
5
  Ecological Solutions, 64 The Grove, Rathdown Upper, Greystones, County Wicklow, Ireland
6
  Vincent Wildlife Trust, Donaghpatrick, Headford, County Galway, Ireland

Received 24 June 2020; revised 28 November 2020; accepted for publication 4 December 2020

In this study, the history of the pine marten (Martes martes) in Ireland is reviewed, revealing that the population has
undergone several retractions and expansions over the last few hundred years. Here, we consider the genetic legacy of
this flux in fortunes and its likely impacts upon the conservation and future recovery of the species. Using nuclear DNA
markers (microsatellites), we found that the genetic diversity present in Ireland today is like that of other Irish carnivores,
but there is evidence of a genetic bottleneck and low effective population size that might result in further reductions
of diversity in the future. There is a lack of genetic structure, showing that the population has not been fragmented
genetically, despite the low percentage of woodland in Ireland. We also reviewed the mitochondrial DNA diversity present
in the Irish population and showed that there is only one contemporary and one extinct haplotype present; a reduced
diversity relative to other Irish carnivores. The Irish haplotypes, both extant and extinct, are shared or are genetically
similar to haplotypes commonly present in southern Europe today. We discuss the possibility of reinforcing the Irish
population with animals from these sources to help supplement and maintain genetic diversity for future generations.

ADDITIONAL KEYWORDS: conservation – genetics – historical demography – mammals – phylogeography –
population reinforcement – rewilding.

                    INTRODUCTION                                    their habitats, efforts to foster co-existence between
                                                                    carnivores and people, and overall improved public
Large, charismatic carnivores, including the wolf
                                                                    opinion (Chapron et al., 2014). Large carnivores
(Canis lupus), brown bear (Ursus arctos) and Eurasian
                                                                    remain absent from Ireland (the island). It has been
lynx (Lynx lynx), are today recovering across human-
                                                                    between almost 3000 and 9000 years since bears and
dominated landscapes that formed part of their former
                                                                    lynx, respectively, roamed Ireland, whereas the wolf
range. One-third of Europe’s mainland landmass
                                                                    disappeared comparatively recently, a mere 300 years
now contains at least one of these large carnivores,
                                                                    ago (Edwards, 2014; Montgomery et al., 2014).
and all species are said to have either stable or
                                                                      With increasing enthusiasm for rewilding,
increasing population trends (Chapron et al., 2014).
                                                                    particularly for trophic restoration and the
This on-going re-establishment has been attributed
                                                                    reintroduction of predators, an island such as Ireland,
to legislation granting protection to the species and
                                                                    on the north-west periphery of Europe, is not going
                                                                    to experience a natural recovery of these species
                                                                    as has happened elsewhere in mainland Europe
*Corresponding author. E-mail: domeara@wit.ie                       (Boitani & Linnell, 2015; Linnell & Jackson, 2019).

© 2021 The Linnean Society of London, Biological Journal of the Linnean Society, 2021, XX, 1–15                              1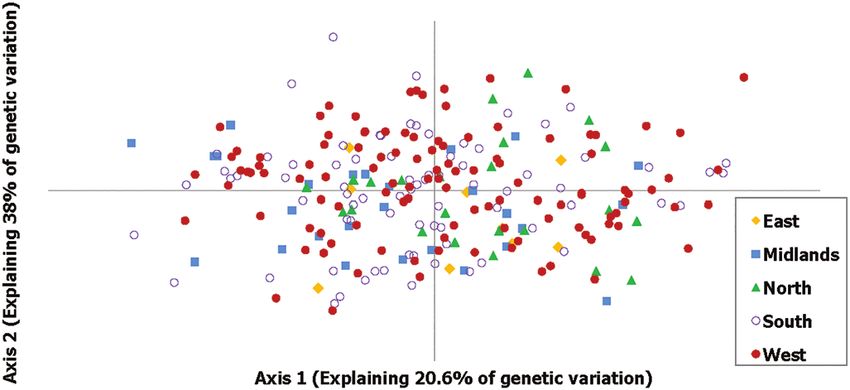
2   C. O’REILLY ET AL.

Consequently, if Ireland is to host such species in the      evidence that similar introductions of the pine marten
future, reintroductions will be required. However,           took place during this period, and it is likely that the
given the problems associated with relatively recent         pine marten was subjected to persecution on Irish
reintroductions in Ireland of once extinct birds of          estates by gamekeepers and hunters, as commonly
prey, the golden eagle (Aquila chrysaetos) and the           occurred in England and Wales (Strachan et al., 1996;
white-tailed eagle (Haliaeetus albicilla) (O’Toole           Birks, 2017; Sainsbury et al., 2019). There is evidence

                                                                                                                              Downloaded from https://academic.oup.com/biolinnean/advance-article/doi/10.1093/biolinnean/blaa214/6144720 by guest on 22 February 2021
et al., 2002; O’Rourke, 2014; O’Donoghue, 2019), and         that the pine marten still occurred in parts of Ireland
the objections associated with reintroductions of a          during this time, including counties in the west, south-
variety of species in Britain (the island) (Sandom &         east and north-east (Patterson, 1894; Ruttledge, 1920).
Wynne-Jones, 2019), much work would be required              The sightings were most frequent in the south-east and
to undertake such efforts in Ireland. Indeed, in the         parts of the west (Ruttledge, 1920; Gethin, 1936).
case of mammal conservation, efforts might currently            In the 1970s, owing to concerns regarding the status
be best concentrated on understanding the fate and           of the pine marten in Ireland, a national survey was
conservation requirements of extant resident species,        conducted. O’Sullivan (1983) found that pine marten
including small- and medium-sized carnivores, such           distribution was largely restricted to the mid-western
as the Irish stoat (Mustela erminea hibernica), otter        part of Ireland. Subsequent legal protection at Irish
(Lutra lutra), badger (Meles meles), red fox (Vulpes         [Wildlife Acts 1976 to 2012 and Wildlife (Northern
vulpes) and pine marten (Martes martes) (Lysaght &           Ireland) Order, 1985] and European level (European
Marnell, 2016).                                              Habitats Directive, Annex V) and the banning of
   The past demography of the pine marten in Ireland         strychnine for use as a poison in the 1980s are all
is thought to be linked intrinsically to the history of      thought to have facilitated the recovery of the species.
woodland cover. Considered a woodland specialist, the        Recent island-wide surveys have shown that the species
earliest evidence of pine marten in Ireland dates to         is now recovering and is found across parts of Ireland
2800 BP (Montgomery et al., 2014). This corresponds          where it had been absent for many years (O’Mahony
to the late Bronze Age, a period when woodland cover         et al., 2005, 2012, 2017a, b; Lawton et al., 2020).
was considered to have been high but beginning to               Previous genetic studies by Davison et al. (2001) and
decline (Mitchell & Ryan, 1997; Byrnes, 2007), and           Jordan et al. (2012) revealed only one contemporary
it is likely that the pine marten population thrived         mitochondrial DNA haplotype present in the Irish
in such habitats. Ireland’s woodland declined in the         pine marten population, hap p, whereas hap a was
16th and 17th centuries to 2% landcover and, despite         found to be the dominant haplotype in Britain. Hap i
moderate increases in the 18 th century, it declined         was historically present throughout both Ireland and
further to 1.5% at the beginning of the 20th century         Britain but is now absent from Ireland. Hap i is very
(OCarroll, 2004; Byrnes, 2007). Today, Ireland’s forest      rare in Britain but was found on an island off the
cover stands at 11% total land cover, but only 1.2%          west coast of Scotland in 2010 (Jordan et al., 2012).
is native woodland, with the majority consisting of          In a wider phylogeographical study of pine marten by
non-native commercial conifer (Bullock & Hawe,               Ruiz-Gonzalez et al. (2013), hap p was incorporated
2013; Department of Agriculture, Food & the Marine           as part of a larger DNA haplotype called Mm20. This
(DAFM), 2019). Total forest cover in Ireland is 20%          haplotype was found to cluster with other haplotypes
below the European average, but the highest it has           from southern and Mediterranean Europe, whereas
been in Ireland for > 350 years (DAFM, 2019).                the contemporary and dominant haplotype present in
   Over a 122-year period, from 1697 to 1819, > 230 000      Scotland (Mm28, which incorporated hap a) grouped
skins of deer (Cervus elaphus and Dama dama),                with haplotypes present in central and northern
fox, rabbit (Oryctolagus cuniculus), mountain hare           Europe, suggesting that the population within
(Lepus timidus) and otter were exported from Ireland         Britain had divergent origins. Efforts to examine the
(Fairley, 1983). Commenting on the notable absence of        contemporary nuclear genetic diversity of the species
both the red squirrel (Sciurus vulgaris) and the pine        have been limited to localized studies. Comparison
marten from these exports, Fairley (1983) suggested          of allele frequency of pine martens from south-east
that the low numbers were attributable to the ‘decay’        Ireland with French pine marten was lower per locus,
of woodlands, and that the few furs that might have          as were levels of expected and observed heterozygosity
been available had a market demand within Ireland.           (HE and HO) [HE = 0.35, HO = 0.34 (Ireland); HE = 0.59,
It is likely that the pine marten population had             HO = 0.54 (France); Mullins et al., 2010]. In a similar
crashed or that numbers were very low, a situation           small study from the midlands of Ireland, allele
well documented and paralleled in the red squirrel,          frequency, expected and observed heterozygosity
a species that requires similar woodland habitat, but        (HE = 0.39, HO = 0.46) were also low when compared
was successfully reintroduced in the 19 th century           with European populations but slightly higher than
(Barrington, 1880; O’Meara et al., 2018). There is no        south-east Ireland (Sheehy et al., 2014).

                            © 2021 The Linnean Society of London, Biological Journal of the Linnean Society, 2021, XX, 1–15
GENETICS OF PINE MARTENS IN IRELAND                   3

   The recovery of the pine marten population in
Ireland and the accumulating evidence supporting
its potential role in the suppression of an invasive
species, the grey squirrel (Sciurus carolinensis), has
been hailed as a conservation success story (Sheehy
et al., 2014, 2018; Sheehy & Lawton, 2014; McNicol

                                                                                                                              Downloaded from https://academic.oup.com/biolinnean/advance-article/doi/10.1093/biolinnean/blaa214/6144720 by guest on 22 February 2021
et al., 2020; Lawton et al., 2020; Twining et al., 2020a,
b). However, the breeding population of pine martens
remains low, estimated to be between 2330 and 3852
individuals (O’Mahony et al., 2017a, b), and despite
more ecological research having taken place into the
species distribution, aided by the development of non-
invasive genetic tools (O’Reilly et al., 2007; Mullins
et al., 2010; O’Meara et al., 2014; Sheehy et al., 2014;
O’Mahony et al., 2012, 2017a, b), little is known about
the contemporary genetic diversity of the species in
Ireland. Furthermore, it is not known whether past
population retractions and expansions have negatively
impacted genetic diversity and how this might
influence the ongoing recovery and maintenance of the
population in the future.
   The aim of this study was to assess the genetic
diversity of the pine marten across Ireland, with a view
to understanding how historical population retractions
and expansions have shaped the contemporary
diversity of the species, and to discuss the challenges
faced by the pine marten as it continues to recover
and expand. Based on the phylogeographical history of
the species, we make suggestions regarding potential
genetic sources to support the future conservation and            Figure 1. Distribution of Irish pine marten samples
reinforcement of the species in Ireland.                          analysed in this study (N = 249).

                                                                  Zymo-Spin II columns. Purified DNA preparations
                                                                  were stored at −20 °C. Samples were identified to
            MATERIAL AND METHODS                                  both species and sex using the real-time PCR methods
                  Sample collection                               outlined by O’Reilly et al. (2008) and Mullins et al.
                                                                  (2010). Samples were genotyped in triplicate using
A total of 249 individual pine martens were collected             the following 12 microsatellite markers: Mel1, Ma2,
from across Ireland, including Mullins et al. (2010),             Gg7, Mar21, Mvis1341 (as detailed by O’Mahony et al.,
the National Pine Marten Survey from O’Mahony                     2017a), Mar53, Mar43, Mel105, Ma08, Mar64, Mer041
et al. (2017a, b), part of a PhD project in the north of          and Mvis075 (Table 1). Genotyping was carried out as
Ireland (Twining, 2020) and from long-term collection             described by Croose et al. (2016).
of animals killed via road traffic accidents. Samples
were collected from ~2008 to 2018. The distribution
of the samples collected is mapped in Figure 1. The                              Microsatellite analysis
mitochondrial DNA (mtDNA) haplotypes from                         The dataset was assessed for the presence of errors,
Davison et al. (2001) and Ruiz-Gonzalez et al. (2013)             including scoring error arributable to stuttering, allele
were also reanalysed with a view to understanding the             dropout and the presence of null alleles, using the
phylogeographical origins of the Irish pine marten.               program MICRO-CHECKER v.2.2.3 (van Oosterhout
                                                                  et al. (2004), and unique individuals were verified
                                                                  via GENALEX v.6.5b (Peakall & Smouse, 2006). The
                      Dna analysis                                number of alleles (A) and observed and expected
Genomic DNA (gDNA) was extracted from hair                        heterozygosities were calculated via GENALEX v.6.5b
and tissue samples using the ZR Genomic DNA-                      (Peakall & Smouse, 2006). Allelic richness (AR) and
Tissue MicroPrep (Zymo Research, Irvine, CA, USA)                 the inbreeding coefficient (FIS) were calculated using
according to the Solid Tissue and Hair protocol with              FSTAT v.2.9.3 (Goudet, 1995). The significance levels

© 2021 The Linnean Society of London, Biological Journal of the Linnean Society, 2021, XX, 1–15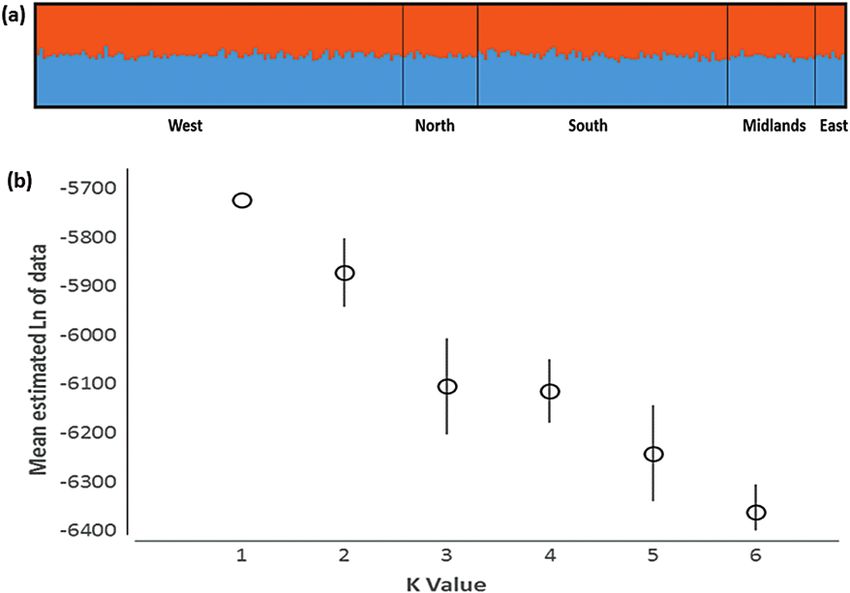
4    C. O’REILLY ET AL.

Table 1. Details of six additional microsatellite loci used in this study

Locus        Primer sequence 5′–3′                                               Source        Reference                       Size range (bp)

Ma08         Forward: FAM-GTTTTCTAATGTTTCGTGTG                                   Eurofins      Davis & Strobeck (1998)         102–108
             Reverse: CAGTGGTTGACTACAAGAAA                                       Eurofins      Davis & Strobeck (1998)
Mel105       Forward: FAM-GATATTCCCCTCCCACCACT                                   Eurofins      Carpenter et al. (2003)         194–196

                                                                                                                                                     Downloaded from https://academic.oup.com/biolinnean/advance-article/doi/10.1093/biolinnean/blaa214/6144720 by guest on 22 February 2021
             Reverse: GTTTCTTAAGACAAAGTTCCCCTGTATTG                              Eurofins      This study
Mvis075      Forward: FAM-GAAATTTGGGGAATGCACTC                                   Eurofins      Fleming et al. (1999)           151–153
             Reverse: GTTTCTTGGCAGGATAGGATGTGAGCT                                Eurofins      Fleming et al. (1999)
Mer041       Forward: ATTO550-TGTGTGATCTCTGGGAATTCTC                             Eurofins      Fleming et al. (1999)           160–166
             Reverse: GTTTCTTGCTCCCCAGATAAAAGC                                   Eurofins      Fleming et al. (1999)
Mar43        Forward: FAM-GTCACCCCAGGAGAGGGTG                                    Eurofins      Natali (2010); this study       114–132
             Reverse: GGTGCCAACTCAGCAGAAGG                                       Eurofins      This study
Mar64        Forward: YAK-GGCCCCAAAGTCTTACAGTTC                                  Eurofins      Natali (2010)                   170–188
             Reverse: CGTTTTGAATCATGCTGTGG                                       Eurofins      Natali (2010)

To facilitate multiplex reactions, the forward primer for Mar43 and the reverse primers for Mar43 and Mel105 were redesigned. The fluorescent dyes
(in bold italic text) used to label the forward primers were FAM, ATTO550 and Yakima Yellow (YAK). The reverse primers for Mel105, Mvis075 and
Mer041 were modified with a 5′ sequence of GTTTCTT (in bold italic text) to promote non-templated nucleotide addition (Brownstein et al., 1996).

for F IS were calculated by randomizing the alleles                        statistic developed by Garza & Williamson, (2001)
within the population using 10 000 permutations                            was also used to investigate a potential reduction in
and compared with the observed data to assess                              population size. During a reduction in population size,
the presence of deviations from Hardy–Weinberg                             the number of alleles (k) is expected to decline faster than
equilibrium. Tests for linkage disequilibrium were                         the range in allele size (r) because most of the alleles lost
performed between pairs of loci using GENEPOP v.4.7                        will fall within the range rather than at the edge, and
(Raymond & Rousset, 1995; Rousset, 2008).                                  as a result the M-ratio (k/r) is expected to be lower in
   The program BOTTLENECK v.1.2.02 (Piry et al.,                           a population that has been reduced. The M-ratio value
1999) was used to assess whether signatures of a                           in populations that have not experienced a reduction in
genetic bottleneck were present in the Irish pine marten                   population size is expected to be ≥ 0.8, and a value < 0.7
population. Genetic bottlenecks are evidenced by the                       indicates a reduction in population size. The effective
presence of heterozygosity excess relative to the number                   population size and associated 95% confidence intervals
of alleles. This occurs in a system impacted by a genetic                  were estimated using the program NeEstimator v.2 (Do
bottleneck because the number of alleles declines in                       et al., 2014), using the linkage disequilibrium method
the population before there is an impact on the level                      developed by Waples & Do, (2008) and applying a PCrit
of heterozygosity, pulling the two statistics out of their                 value of 0.02 to screen out rare alleles from the estimate.
natural state of equilibrium (Luikart & Corneut, 1998).                       The number of putative genetic clusters (K) present
This test was carried out using the two-phase model                        in the dataset was modelled using the program
(TPM), which is recommended for use with microsatellite                    STRUCTURE v.2.3.1 (Pritchard et al., 2000; Falush et al.,
data. The TPM was used with the following settings: 80%                    2003). The Bayesian clustering algorithm implemented in
single-step mutations, a variance among multiple steps                     the program was used to analyse the data with default
of 12, and 5000 iterations. The probability of significant                 settings and a burn-in period of 100 000, followed by
heterozygosity excess was subsequently determined                          400 000 replicates with no prior population information.
using Wilcoxon’s signed rank test. The mode-shift                          Values of K ranged from one to six, with each K value
indicator test was also used to detect the presence of a                   replicated five times to assess the most likely number of
recent genetic bottleneck. A non-bottlenecked population                   inferred populations. The most likely K was assessed by
at near mutation–drift equilibrium is expected to have                     calculating the mean likelihood, L(K), and implementing
a high portion of alleles occurring at low frequency. The                  the ΔK method (Evanno et al., 2005) using STRUCTURE
test groups the microsatellite alleles into ten frequency                  HARVESTER (Earl & vonHoldt, 2012). The Web server
classes to test whether the distribution follows a normal                  CLUMPAK was used to summarize and visualize the
L-shaped distribution where the least frequently                           STRUCTURE results (Kopelman et al., 2015). To examine
occurring alleles are the most numerous. A mode-shift                      the presence of genetic structure further, a principal
outside of this normal L-shaped distribution is transient                  coordinates analysis in GENALEX v.6.5b (Peakall &
and detectable if the bottleneck has occurred in the last                  Smouse, 2006) was used as a multivariate approach to
few dozen generations (Luikart et al., 1998). The M-ratio                  supplement the STRUCTURE analysis.

                                    © 2021 The Linnean Society of London, Biological Journal of the Linnean Society, 2021, XX, 1–15
GENETICS OF PINE MARTENS IN IRELAND 5
Mitochondrial DNA analysis
Abbreviations are as follows: A, number of alleles per locus; AR, allelic richness; FIS, inbreeding coefficient, with values in italics indicating significant deviation from Hardy–Weinberg equilibrium at
Average
0.547
0.549
0.358
0.001
4.33
4.32
248.3
The pine marten control region (CR) mtDNA
haplotypes (N = 18) previously published by Davison
et al. (2001) were downloaded from GenBank (accession
0.691
0.750
0.538
numbers AF336949–AF336964 and AF336968–
Mar43
7.00
0.08
AF336969) and compared by multiple alignments
243
7
Downloaded from https://academic.oup.com/biolinnean/advance-article/doi/10.1093/biolinnean/blaa214/6144720 by guest on 22 February 2021
using the CLUSTALW method implemented in MEGA
v.7 (Tamura et al., 2011). Using 322 bp of the CR, a
0.414
0.404
0.258
−0.022
median-joining network was constructed using the
3.00
Ma08
median algorithm of Bandelt et al. (1999) in POPART
249
P = 0.05; HE, expected heterozygosity; HEQ, expected heterozygosity at equilibrium (P = 0.02); HO, observed heterozygosity; N, number of samples amplified per locus;
3
v.1.7.1 (Leigh & Byrant, 2015), and haplotypes were
colour coded by country of origin. Data included
0.619
0.639
0.419
0.033
4.97
Mar6
haplotypes previously identified by Davison et al.
247
5
(2001) and Jordan et al. (2012) in Ireland (one), Britain
(Scotland) (two), Finland (two), Sweden (three), Latvia
(three), Slovenia (two), Spain (one), The Netherlands
Mvis075
0.502
0.468
0.256
(three), Germany (three), France (two), Italy (three)
2.98
−0.07
and the Czech Republic (two). Haplotypes originating
249
3
from captive-bred animals or from Martes zibellina
(sampled in Finland) were not included in this analysis.
MER041
The mtDNA analysis was repeated with the 69
0.594
0.568
0.412
−0.044
4.98
~1600 bp mtDNA pine marten sequences published
249
5
by Ruiz-Gonzalez et al. (2013) (accession numbers
HM025990–HM026058). The sequence region included
part of the cytochrome b gene, tRNAPro, tRNAThr,
0.406
0.403
0.478
−0.003
Mel105
5.98
CR, and part of the 12S rRNA. This dataset included
Table 2. Descriptive statistics for pine martens in Ireland across 12 microsatellite loci
249
6
haplotypes that occurred in Ireland (one), Britain
(Scotland) (one), Italy (11), Spain (nine), Portugal (one),
Croatia (one), France (six), Luxembourg (five), Austria
0.606
0.638
0.342
0.052
Mar53
4.00
(two), The Netherlands (three), Germany (nine), Czech
249
4
Republic (one), Poland (seven), Hungary (four), Romania
(one), Latvia (one), Estonia (three), Finland (three),
0.522
0.500
0.335
Sweden (six), Norway (one) and Russia (17). Owing to the −0.042
Mar21
3.95
high number of countries sampled, the sequences were
249
4
grouped by geographical region to aid visualization of the
position of the Irish (IRE) and British (BRI) pine marten
0.562
0.583
0.332
0.038
4.00
haplotypes. The Mediterranean group (MED) consisted
Gg7
249
4
of haplotypes from Italy, Croatia, Spain and Portugal; the
central and eastern European group (CEE) consisted of
haplotypes from France, Luxembourg, Austria, Germany,
Mvi1341
0.558
0.531
0.257
−0.049
The Netherlands, Czech Republic, Poland, Hungary and
3.00
Romania; and the north-east Europe and Russian group
249
3
(NEE) consisted of haplotypes from Latvia, Estonia,
Finland, Sweden, Norway and Russia.
0.655
0.660
0.423
4.95
0.01
Ma2
249
5
RESULTS
0.430
0.441
0.241
0.027
3.00
Mel1
The descriptive statistics for the 249 individual
249
3
pine martens genotyped in this study are provided
in Table 2. The majority of animals were genotyped
Parameter
successfully at all microsatellites, with success
rates ranging from 97.6 to 99.2% at Mar43 and
Mar6, respectively, to 100% at the remaining ten
HEQ
HO
FIS
HE
NA
AR
loci. There was no significant evidence of scoring
N
© 2021 The Linnean Society of London, Biological Journal of the Linnean Society, 2021, XX, 1–156 C. O’REILLY ET AL.
error attributable to stuttering, allele dropout or population. Furthermore, K = 1 is the most likely
the presence of null alleles in the dataset. There number of clusters present across the dataset, and
was some evidence of a homozygote excess at Gg7 K = 2 also demonstrated that there was no evidence
and Mar3 (P < 0.03). The number of alleles per locus of genetic structure across the dataset. The ΔK
ranged from three to seven and averaged 4.3 across method suggested K = 3, but this is because the
all loci. The average allelic richness value across all method of Evanno et al. (2005) cannot detect a K = 1
Downloaded from https://academic.oup.com/biolinnean/advance-article/doi/10.1093/biolinnean/blaa214/6144720 by guest on 22 February 2021
loci was also 4.3. Levels of observed heterozygosity situation. However, the plot of the mean likelihood,
ranged from 0.414 at Ma08 to 0.691 at Mar43 and L(K), of inferred K value, established from combining
averaged 0.547 across all loci. Levels of expected each replicate per K value and associated standard
heterozygosity ranged from 0.403 at Mel105 to deviation from STRUCTURE HARVESTER, also
0.750 at Mar43 and averaged 0.549. The average showed K = 1 (Fig. 2B). There was also no evidence
inbreeding coefficient value across all loci was of genetic clustering in the principal coordinates
0.001. One locus, Mar43, deviated significantly from analysis (Fig. 3), which accounted for 55.1% of the
Hardy–Weinberg equilibrium at the 5% significance genetic variation within the data. The lack of genetic
level, but no significant deviations were present structure within the data supported the STRUCTURE
after a Bonferroni correction (P = 0.004). High and data presented in Figure 2A.
significant F IS values can indicate that inbreeding Re-examination of 321 bp of the control region of the
has occurred in the population and are also associated mtDNA sequences showed that the Irish haplotype, p,
with the presence of genetic admixture, but in this is most closely related to haplotype h found in Slovenia
study, the average F IS value was almost zero, and and haplotype i found in Britain, Latvia and Spain
many of the loci presented in this study with negative (Fig. 4). Haplotype i was formerly present in Ireland.
values. Linkage disequilibrium was detected in eight The common British haplotype, hap a, is most closely
of the 66 possible pairwise comparisons at the 5% related to haplotypes d, c and b found in Germany,
significance level but were not found to be significant France, Sweden, Finland and the Czech Republic
after a Bonferroni correction (P = 0.0007). (Fig. 4).
The test used to detect the presence of a recent Repetition of the mtDNA network analysis using
genetic bottleneck showed that there was an excess the 1561 bp sequences showed the sole Irish haplotype
heterozygosity relative to the number of alleles clustered within the MED group, whereas the only
attributable to differences between the levels of British haplotype in that dataset clustered with the
expected heterozygosity (HE) relative to heterozygosity CEE group (Fig. 5). A large portion of the NEE group
estimated under mutation–drift equilibrium (H EQ) segregated separately from these two clusters and
(Table 2). In this case, differences between the two sets appeared divergent; these were mostly animals from
of data were significant, indicating that the population Russia. There was, however, some admixture present
might recently have undergone a genetic bottleneck. throughout. The haplotypes that clustered with the Irish
The probability value for a one-tailed Wilcoxon’s haplotypes included Mm5, Mm6, Mm7 (Spain), Mm17
signed rank test for an excess of heterozygosity (Italy) and Mm19 (Croatia). This branch stemmed from
was P = 0.02. Eleven out of the 12 loci had a higher a common haplotype within the European/Iberian group,
than expected level of heterozygosity relative to the which included Mm9 and Mm16. These two haplotypes
expected value under equilibrium, causing the excess overlapped to form a single haplotype in our analysis.
heterozygosity. However, the mode-shift test resulted Both these haplotypes are found in Spain, Portugal, Italy
in a normal L-shaped distribution and did not confirm and Germany (Ruiz-Gonzalez et al., 2013)).
the presence of a recent bottleneck (Supporting
Information, Fig. S1). The average M-ratio value
across all loci was 0.47 (range 0.27–0.86), less than
DISCUSSION
generally accepted threshold of 0.7 for a population
that has not undergone a reduction in population size. In this study, we aimed to assess the genetic diversity
In this case, ten of the 12 loci used in this study had an of the contemporary Irish pine marten population
M-ratio < 0.7, suggestive of a reduction in population using microsatellites to gain insights into how past
size (Supporting Information, Table S1). The effective declines have impacted the population today. We also
population size (NE) estimated in this study was 233.7 aimed to review the phylogeographical history of the
(95% confdence interval 153–413.7), below the guiding species using previously published mtDNA to consider
principle of 500 required for long-term viability of a the genetic history of the pine marten and how this
population. information might be used to inform the future
The STRUCTURE results showed no population conservation management and sustain the on-going
substructure present in the Irish pine marten recovery of the species in Ireland.
© 2021 The Linnean Society of London, Biological Journal of the Linnean Society, 2021, XX, 1–15GENETICS OF PINE MARTENS IN IRELAND 7
Downloaded from https://academic.oup.com/biolinnean/advance-article/doi/10.1093/biolinnean/blaa214/6144720 by guest on 22 February 2021
Figure 2. A, membership of individual Irish pine martens to K = 2 as inferred by STRUCTURE analysis. The animals
were divided geographically by region into west, north, south, midlands and east of Ireland. B, plot of mean likelihood L(K)
and standard deviation per K value from STRUCTURE HARVESTER on a dataset containing 249 individual pine martens
genotyped at 12 microsatellite loci.
Figure 3. Principal coordinates analysis of individual pine martens. Animals were coded by geographical region. The
animals were divided geographically by region into west, north, south, midlands and east of Ireland (N = 249).
In terms of nuclear genetic diversity, the number respectively. The average levels of HE (0.55) and HO
of alleles in the Irish pine marten population is low, (0.58) in the present study were also higher than those
averaging 4.3 per locus, but slightly higher than what reported earlier. This is likely to be attributable to the
was encountered by Mullins et al. (2010) and Sheehy localized nature of those studies and the much larger
et al. (2014), averaging 2.3 and 2.9 alleles per locus, sample size used in the present study. The results
© 2021 The Linnean Society of London, Biological Journal of the Linnean Society, 2021, XX, 1–158 C. O’REILLY ET AL.
Downloaded from https://academic.oup.com/biolinnean/advance-article/doi/10.1093/biolinnean/blaa214/6144720 by guest on 22 February 2021
Figure 4. Median-joining network diagram generated using 321 bp of mitochondrial DNA haplotypes (control region)
of pine marten samples from across Europe (Davison et al., 2001) (N = 18). Only one haplotype, haplotype p, is found in
Ireland today. Haplotype i was also present in Ireland historically but is now absent (Jordan et al., 2012). Abbreviations are
as follows: CZE, Czech Republic; FIN, Finland; FRA, France; GER, Germany; IRE, Ireland; ITA, Italy; LAT, Latvia; NET,
The Netherlands; SLO, Slovenia; SPA, Spain; SWE, Sweden; BRI, Britain. The circle size reflects the number of haplotypes.
reported here are similar to those recorded in the pine (White et al., 2013). Levels of observed and expected
marten population from the Basque Country, where heterozygosity were also similar across these studies.
the average number of alleles was 4.1 and average There was no evidence of inbreeding in the Irish pine
H E and H O values were 0.58 and 0.53, respectively marten population, but there was some evidence of a
(Ruiz-González et al., 2014). Similar results were genetic bottleneck. In a non-bottlenecked population,
obtained in France, where an average allelic richness ≤ 50% of the loci might be expected to exhibit evidence
of 3.6 and an average H E and H O of 0.58 and 0.57, of heterozygosity excess or deficiency (Luikart &
respectively, were found (Mergey et al., 2012). Slightly Corneut, 1998), but in this case 92% of the loci under
higher levels of diversity were reported in Denmark, the TPM supported the presence of a heterozygote
where contemporary allelic richness averaged 4.2 excess. The M-ratio test showed that the population
and expected levels of heterozygosity averaged 0.7 had evidence of a recent population retraction, a
(Pertoldi et al., 2008). However, all studies used signature that has been found to remain for > 100
different combinations of microsatellites; therefore, generations in other populations (Garza & Williamson,
the values are not directly comparable but are useful 2001). This suggests that the detection of a bottleneck
to provide context. signature is likely to reflects the history of the species
Levels of genetic diversity in the Irish pine marten in Ireland, where it has undergone multiple population
population were similar to those of other Irish retractions and expansions. Considering that expected
carnivores. Badgers averaged 4.2 alleles per locus levels of heterozygosity tend to decline after allele
(O’Meara et al., 2012), and red foxes had an average numbers have been reduced following a genetic
of 8.9 alleles across loci and an average allelic richness bottleneck (Piry et al., 1999), it would be a reasonable
of 3.9 (Statham et al., 2018). No national efforts expectation that a similar result could manifest itself
have examined nuclear diversity of otter populations in the Irish population in future generations.
in Ireland, but one localized study in the south of The Irish pine marten population has a low effective
Ireland showed an average of three alleles per locus population size of 233.7. Effective population sizes
© 2021 The Linnean Society of London, Biological Journal of the Linnean Society, 2021, XX, 1–15GENETICS OF PINE MARTENS IN IRELAND 9
Downloaded from https://academic.oup.com/biolinnean/advance-article/doi/10.1093/biolinnean/blaa214/6144720 by guest on 22 February 2021
Figure 5. Median-joining network diagram generated using 1561 bp of mitochondrial DNA haplotypes (sequence includes
part of the cytochrome b gene, tRNAPro, tRNAThr, control region and 12S rRNA; Ruiz-Gonzalez et al. 2013) (N = 69).
Numbers 1–69 reflect haplotypes Mm1–Mm69 from Ruiz-Gonzalez et al. (2013). Abbreviations are as follows: CEE, central
and eastern European group; IRE, Ireland; MED, Mediterranean group; NEE, north-eastern Europe and Russia; BRI,
Britain. The circle size reflects the number of haplotypes.
for two contemporary pine marten populations in population (Michaux et al., 2005). A European funded
Denmark were estimated to be 802 and 505 (Pertoldi LIFE project project is attempting to breed Estonian
et al., 2008). The 50/100 rule is based on evidence and Spanish mink with a view to increasing the genetic
that where a population of N E ≤ 50, an inbreeding viability of the Spanish population (LIFE13NAT/
depression cannot be prevented in the short term, and ES/1171). Few studies have successfully demonstrated
NE > 500 is required for long-term genetic viability the genetic success of such efforts, but Ranke et al.
(Jamieson & Allendorf, 2012). Other authors have (2020) investigated the genetic implications of an
argued that NE > 1000 is required for long-term fitness experimental island reinforcement of house sparrows
(Frankham et al., 2014). In situations where the NE is (Passer domesticus) and demonstrated that diversity
< 500, the population remains at long-term risk for could be increased, but required careful selection of
extinction, because genetic drift could cause a further individuals from donor sites and the improvement of
loss of genetic variation, resulting in morphological habitat to reduce the negative impacts of genetic drift
developmental issues and reductions in fitness, and the need for further introductions.
potentially leading to extinction (Hoelzel et al., 2002; The pine marten population in the west, north-west
Frankham et al., 2014). The loss of genetic variation can and south-east of Ireland had been considered historical
also prevent a population from adapting to a change strongholds for the species (Ruttledge, 1920; O’Sullivan,
in environmental conditions, resulting in further 1983), and some evidence of genetic structure might
contraction of the population that can also potentially have been expected as a result of animals expanding
result in extinction (Harmon & Braude, 2010; Weeks from these areas, but the population appears uniform
et al., 2015; Kelly, 2019). In the case of some larger and (Fig. 2A). A study of pine martens in France, including
critically endangered carnivores, such concerns have discreet populations from around the country, found
warranted the consideration of a genetic rescue, e.g. no evidence of a genetic bottleneck or inbreeding,
the Mexican wolf (Canis lupus baileyi) and the Florida and levels of genetic diversity were comparable to
panther (Puma concolor coryi) (Hedrick & Fredrickson, those of the Irish population (Mergey et al., 2012).
2010). Similar attempts are underway in Spain to However, Mergey et al. (2012) did find evidence of
genetically enforce the European mink population genetic clustering and isolation by distance, although
(Mustela lutreola) via a captive breeding programme, the structure detected might have been a consequence
after the detection of low genetic variability within the of not sampling outside of the studied populations. In
© 2021 The Linnean Society of London, Biological Journal of the Linnean Society, 2021, XX, 1–1510 C. O’REILLY ET AL.
the present study, samples from across Ireland were (O’Meara et al., 2012; Allen et al., 2020). The otter,
used, which might have avoided these issues. It is also another mustelid, has a rich mtDNA diversity in
a possibility that the absence of the sympatric stone Ireland, with nine haplotypes found in the Irish
marten (Martes foina) from Ireland has resulted in population, five of which were considered novel to the
the pine marten occupying a wider ecological niche island (Finnegan & Néill, 2010). The stoat (Mustela
than typically seen elsewhere in Europe, where both erminea) too has a rich mtDNA diversity and heritage
Downloaded from https://academic.oup.com/biolinnean/advance-article/doi/10.1093/biolinnean/blaa214/6144720 by guest on 22 February 2021
species coexist, which might have facilitated gene flow in Ireland, with 11 uniquely Irish mtDNA haplotypes
resulting in the lack of genetic structure as seen in the found on the island (Martínková et al., 2007). In
present study. Interspecific competition for resources the case of the one pine marten mtDNA haplotype
between both marten species was one of the complex present in Ireland, hap p (Davison et al., 2001), this
factors that was found to influence the occurrence forms part of the longer Mm20 sequence recorded
of genetic structure within northern Spain (Ruiz- by Ruiz-Gonzalez et al. (2013). Hap i, which is now
Gonzalez et al., 2015). extinct in Ireland and very rare in Britain, is still
A study of recovering fishers (Martes pennanti) found in southern and mainland Europe (Davison
in the north-eastern USA found evidence of genetic et al., 2001; Jordan et al., 2012). The longer haplotype,
structure in a population that had expanded after Mm20, retains a genetic similarity to haplotypes
heavy persecution (Hapeman et al., 2011). The genetic found in north-west Spain (Asturias and Galicia),
structuring in that case was attributed to past north-east Croatia (Zagreb) and north-west Italy
reintroductions, possible migration from outside the (Turin and Cuneo). These haplotypes appear to have
study area, and the presence of hydrological features, diverged from a common haplotype (Mm16/Mm9),
particularly large lakes, which might have inhibited which overlapped in our network diagram owing to
gene flow (Hapeman et al., 2011). Natural range genetic similarity and are common today in north-
expansion of brown bears from Russia into Finland west Spain, north Portugal, north Italy and Sardinia.
was also shown to have occurred by the presence of Interestingly, Mm9 also occurs in Germany and the
genetic structure attributable to the migration of Czech Republic. It is possible that other haplotypes
genetically distinct animals into the country (Kopatz that might formerly have been present in Ireland
et al., 2014; Hagen et al., 2015). The lack of significant have gone extinct during periods of population decline.
landscape features, such as lakes, and the inability However, further investigation of museum collections,
of natural range expansion from other countries into building on the work of Jordan et al. (2012), would be
Ireland might also help to explain the lack of structure required to investigate this further.
in the present study. The large ranging behaviour of It is not known how or when pine martens got to
pine martens, as seen in recent reintroductions to Ireland, but the Irish population retains a genetic
Wales (McNicol et al., 2020), shows that gene flow heritage similar to that found in Iberia and southern
might have been maintained across an island the Europe. Such a background within an Irish species
size of Ireland. The expansion of the species range in is not unusual, and other Irish species retain this
the face of low forest cover indicates that the species ‘Lusitanian’ heritage, sometimes as part of a wider
can use suboptimal habitat, and the adaptability and genetic diversity. Some of the mtDNA haplotypes
resilience of Irish pine martens to establish populations within the Irish badger population have links to
in habitat of low suitability during periods of range Iberia and Scandinavia (O’Meara et al., 2012; Allen
expansion should not be overlooked (O’Mahony, 2017) et al., 2020), whereas pygmy shrews (Sorex minutus)
and supports the importance of marginal habitats, also share mtDNA haplotypes with pygmy shrews
such as scrub and tree lines, to the pine marten in from the north of Spain (Vega et al., 2020). Statham
Ireland (Twining et al., 2020c). Owing to a current lack et al. (2018) found a unique Irish mtDNA haplotype in
of optimal pine marten habitat in Ireland, maintaining red foxes that grouped with red foxes from Spain.
areas of scrub and increasing the level of native Statham et al. (2018) demonstrated that foxes in
woodland cover should be encouraged and incentivized Ireland and northern Europe today retain a genetic
(Hickey et al., 2020; Twining et al., 2020c). heritage with Iberia.
In contrast to our findings here, Allen et al. (2020) Beyond the class Mammalia, similar patterns
found evidence of genetic structure present in the Irish were also found in other taxonomic groups. Three
badger population. However, this was also reflected by haplotypes of land snails found in Ireland (Cepaea
differences in mtDNA haplotypes of divergent origins, nemoralis) were found in the Pyrenean population
which probably represented different colonization (Grindon & Davison, 2013). Reich et al. (2015)
events or introductions. It should be noted that the examined the genetic diversity of the Kerry slug
Irish badger population has seven different mtDNA (Geomalacus maculosus), a species found only in
haplotypes, compared with one for the pine marten south-west Ireland, north-west Spain and north
© 2021 The Linnean Society of London, Biological Journal of the Linnean Society, 2021, XX, 1–15GENETICS OF PINE MARTENS IN IRELAND 11
Portugal, and found that the population in Ireland Conservation of genetic diversity is crucial for the
was most genetically similar to those in Asturias adaptive capacity of populations facing environmental
and Cantabria in north Spain. Several plant species change, but genetic reinforcement is rarely proposed
exhibit a Hiberno-Lusitanian distribution, in that for populations not deemed currently to be in danger,
they exist only in parts of Spain and Ireland. This such as the pine marten in Ireland. However, a genetic
includes the strawberry tree (Arbutus unedo), a reinforcement of the Irish pine marten population
Downloaded from https://academic.oup.com/biolinnean/advance-article/doi/10.1093/biolinnean/blaa214/6144720 by guest on 22 February 2021
heath species, Daboecia cantabrica, and a heather based on the evidence presented here could increase its
species, Erica mackayana (Praeger, 1932; Sheehy- long-term viability. It is pertinent to consider the fate of
Skeffington & Van Doorslaer, 2015). Erica mackayana extant wildlife populations, such as the pine marten, to
occurs only along the west of Ireland and the north- understand fully how best they can be managed, restored
west Cantabrian coast of Spain (Sheehy-Skeffington and sustained for future generations before contemplating
& Van Doorslaer, 2015). Erica mackayana does not informed introductions of other extinct mammals as part
seed in Ireland, which is one of the factors that of rewilding efforts.
led Sheehy-Skeffington & Van Doorslaer (2015) to
conclude that it was introduced accidentally during
periods of trade between north Spain and Ireland.
ACKNOWLEDGEMENTS
Regardless of how the pine marten came to Ireland
and how well it appears to be recovering from We would like to thank the three reviewers, Dr
population declines, it might be time to consider a Johnny Birks and two anonymous reviewers, who took
genetic reinforcement. The detection of a genetic considerable time and effort to review the manuscript.
bottleneck, low effective population size and the Their valuable contributions greatly improved
low number of mtDNA haplotypes (only one extant) the manuscript. We are grateful to all those who
present in the population today suggests that the contributed samples to this study.
continued presence of the species in Ireland might be
at risk in the future. It is not known how a genetic
bottleneck and associations in the expected reduction
of genetic diversity, in addition to the low effective REFERENCES
population size, are likely to impact the population, but Allen A, Guerrero J, Byrne A, Lavery J, Presho E, Courcier E,
the values are below the accepted thresholds for long- O’Keeffe J, Fogarty U, Delahay R, Wilson G, Newman C,
term population viability, and further losses in genetic Buesching C, Silk M, O’Meara D, Skuce R, Biek R,
diversity could affect fitness and the ability to adapt McDonald RA. 2020. Genetic evidence further elucidates the
to environmental change. Considering how genetically history and extent of badger introductions from Great Britain
variable the pine marten is elsewhere in Europe, it is into Ireland. Royal Society Open Science 7: 200288.
time to consider how the genetic diversity within the Bandelt HJ, Forster P, Röhl A. 1999. Median-joining
Irish population can be restored and, at the very least, networks for inferring intraspecific phylogenies. Molecular
maintained, while considering the unique heritage of Biology and Evolution 16: 37–48.
the population. Given the phylogeographical history Barrington RM. 1880. On the introduction of the squirrel into
of the species in Ireland, diversity could be restored Ireland. Scientific Proceedings of the Royal Dublin Society 2:
or gained via the translocation of genetically similar 615–631.
animals (IUCN, 2013). Populations that occur in Birks JDS. 2017. Pine martens. Stansted: Whittet Books.
north-west Spain (Galicia and Asturias) would be the Boitani L, Linnell JDC. 2015. Bringing large mammals back:
ideal source, if such efforts were to be considered as large carnivores in Europe. In: Pereira HM, Navarro LM,
eds. Rewilding European landscapes. New York, Dordrecht,
part of a feasibility study that could compare levels
London: Springer Open, Cham, Heidelberg, 67–84.
of genetic diversity in both populations to assess the
Brownstein MJ, Carpten JD, Smith JR. 1996. Modulation
potential contribution a genetic reinforcement might
of non-templated nucleotide addition by Taq DNA
have on the Irish population (Ranke et al., 2020). Given
polymerase: primer modifications that facilitate genotyping.
that this phylogroup was also present historically Biotechniques 20: 1004–1006, 1008.
throughout Britain, the genetic reinforcement of the Bullock C, Hawe J. 2013. The natural capital value of
Irish population might also be of future benefit to the native woodland in Ireland. Woodlands of Ireland. Available
conservation of the species there. It is possible that at: http://www.woodlandsofireland.com/sites/default/
the contraction of the species range in Britain has files/Natural%20Capital%20Value%20of%20Native%20
resulted in similar reductions in genetic diversity Woodland%20in%20Ireland%28Long%20version%20-%20
and bottlenecks to those observed in Ireland, and this Mar2014%29.pdf
warrants further investigation based on the results Byrnes, E. 2007. A history of woodland management in
seen here. Ireland: an overview. Forest Service native woodland
© 2021 The Linnean Society of London, Biological Journal of the Linnean Society, 2021, XX, 1–1512 C. O’REILLY ET AL.
scheme information note no. 2. Little D, ed. Available Evanno G, Regnaut S, Goudet J. 2005. Detecting the number
at: https://www.woodlandsofireland.com/sites/default/ of clusters of individuals using the software STRUCTURE: a
files/No.%202%20-%20Woodland%20Management%20 simulation study. Molecular Ecology 14: 2611–2620.
History.pdf Fairley JS. 1983. Exports of wild mammal skins from Ireland in
Carpenter PJ, Dawson DA, Greig C, Parham A, the eighteenth century. Irish Naturalists’ Journal 21: 75–79.
Cheeseman CL, Burke T. 2003. Isolation of 39 polymorphic Falush D, Stephens M, Pritchard JK. 2003. Inference of
microsatellite loci and the development of a fluorescently population structure using multilocus genotype data: linked
Downloaded from https://academic.oup.com/biolinnean/advance-article/doi/10.1093/biolinnean/blaa214/6144720 by guest on 22 February 2021
labelled marker set for the Eurasian badger (Meles meles) loci and correlated allele frequencies. Genetics 164: 1567–1587.
(Carnivora: Mustelidae). Molecular Ecology Notes 3: 610–615. Finnegan LA, Ó Néill L. 2009. Mitochondrial DNA diversity
Chapron G, Kaczensky P, Linnell JD, von Arx M, Huber D, of the Irish otter, Lutra lutra, population. Conservation
Andrén H, López-Bao JV, Adamec M, Álvares F, Genetics 11: 1573–1577.
Anders O, Balčiauskas L, Balys V, Bedő P, Bego F, Fleming MA, Ostrander EA, Cook JA. 1999. Microsatellite
Blanco JC, Breitenmoser U, Brøseth H, Bufka L, markers for American mink (Mustela vison) and ermine
Bunikyte R, Ciucci P, Dutsov A, Engleder T, Fuxjäger C, (Mustela erminea). Molecular Ecology 8: 1352–1354.
Groff C, Holmala K, Hoxha B, Iliopoulos Y, Ionescu O, Frankham R, Bradshaw CJA, Brook BW. 2014. Genetics
Jeremić J, Jerina K, Kluth G, Knauer F, Kojola I, Kos I, in conservation management: revised recommendations for
Krofel M, Kubala J, Kunovac S, Kusak J, Kutal M, the 50/500 rules, Red List criteria and population viability
Liberg O, Majić A, Männil P, Manz R, Marboutin E, analyses. Biological Conservation 170: 56–63.
Marucco F, Melovski D, Mersini K, Mertzanis Y, Garza JC, Williamson EG. 2001. Detection of reduction in
Mysłajek RW, Nowak S, Odden J, Ozolins J, Palomero G, population size using data from microsatellite loci. Molecular
Paunović M, Persson J, Potočnik H, Quenette PY, Ecology 10: 305–318.
Rauer G, Reinhardt I, Rigg R, Ryser A, Salvatori V, Gethin RG. 1936. Pine marten visitor. The Irish Naturalist
Skrbinšek T, Stojanov A, Swenson JE, Szemethy L, 6: 145–146.
Trajçe A, Tsingarska-Sedefcheva E, Váňa M, Veeroja R, Goudet J. 1995. FSTAT (version 1.2): a computer program to
Wabakken P, Wölfl M, Wölfl S, Zimmermann F, calculate F-statistics. Journal of Heredity 86: 485–486.
Zlatanova D, Boitani L. 2014. Recovery of large carnivores Grindon AJ, Davison A. 2013. Irish Cepaea nemoralis land
in Europe’s modern human-dominated landscapes. Science snails have a cryptic Franco-Iberian origin that is most
346: 1517–1519. easily explained by the movements of Mesolithic humans.
Croose E, Birks JD, O’Reilly C, Turner P, Martin J, PLoS One 8: e65792.
MacLeod ET. 2016. Sample diversity adds value to non- Hagen SB, Kopatz A, Aspi J, Kojola I, Eiken HG. 2015.
invasive genetic assessment of a pine marten (Martes Evidence of rapid change in genetic structure and diversity
martes) population in Galloway Forest, southwest Scotland. during range expansion in a recovering large terrestrial
Mammal Research 61: 131–139. carnivore. Proceedings of the Royal Society B: Biological
Davis CS, Strobeck C. 1998. Isolation, variability, and cross- Sciences 282: 20150092.
species amplification of polymorphic microsatellite loci in the Hapeman P, Latch EK, Fike JA, Rhodes OE,
family Mustelidae. Molecular Ecology 7: 1776–1778. Kilpatrick CW. 2011. Landscape genetics of fishers (Martes
Davison A, Birks JD, Brookes RC, Messenger JE, pennanti) in the Northeast: dispersal barriers and historical
Griffiths HI. 2001. Mitochondrial phylogeography and influences. The Journal of Heredity 102: 251–259.
population history of pine martens Martes martes compared Harmon LJ, Braude S. 2010. Conservation of small
with polecats Mustela putorius. Molecular Ecology 10: populations: effective population size, inbreeding, and the
2479–2488. 50/500 rule. In: Braude S, Low SB, eds. An introduction to
Department of Agriculture, Food & the Marine methods and models in ecology and conservation biology.
(DAFM). 2019. Forest statistics Ireland 2019. Available at: Princeton: Princeton University Press, 125–138.
https://www.agriculture.gov.ie/media/migration/forestry/ Hedrick PW, Fredrickson R. 2010. Genetic rescue guidelines
forestservicegeneralinformation/ForestStatisticsIrel with examples from Mexican wolves and Florida panthers.
and2019161219.pdf Conservation Genetics 11: 615–626.
Do C, Waples RS, Peel D, Macbeth GM, Tillett BJ, Hickey S, Sheehan D, Nagle T. 2020. Bride project: farm
Ovenden JR. 2014. NeEstimator v2: re-implementation habitat management guidelines. Available at: https://www.
of software for the estimation of contemporary effective thebrideproject.ie/wp-content/uploads/2020/04/BRIDE-
population size (Ne) from genetic data. Molecular Ecology Project-Farm-Habitat-Management-Guidlines.pdf
Resources 14: 209–214. Hoelzel AR, Fleisher RC, Campagna C, Le Boef BJ,
Earl DA, Vonholdt BM. 2012. STRUCTURE HARVESTER: Alvord G. 2002. Impact of a population bottleneck on
a website and program for visualizing STRUCTURE output symmetry and genetic diversity in the northern elephant
and implementing the Evanno method. Conservation seal. Journal of Evolutionary Biology 15: 567–575.
Genetics Resources 4: 359–361. IUCN. 2013. Guidelines for reintroductions and other
Edwards CJ. 2014. Comment on ‘Origin of British and Irish conservation translocations, Version 1.0. Gland: IUCN
mammals: disparate post-glacial colonisation and species Species Survival Commission.
introductions’ by W.I. Montgomery, J. Provan, A.M. McCabe Jamieson IG, Allendorf FW. 2012. How does the 50/500 rule
and D.W. Yalden. Quaternary Science Reviews 105: 244–247. apply to MVPs? Trends in Ecology & Evolution 27: 578–584.
© 2021 The Linnean Society of London, Biological Journal of the Linnean Society, 2021, XX, 1–15GENETICS OF PINE MARTENS IN IRELAND 13
Jordan NR, Messenger J, Turner P, Croose E, Birks J, Conservation genetics and population history of the
O’Reilly C. 2012. Molecular comparison of historical and threatened European mink Mustela lutreola, with an
contemporary pine marten (Martes martes) populations in emphasis on the west European population. Molecular
the British Isles: evidence of differing origins and fates, and Ecology 14: 2373–2388.
implications for conservation management. Conservation Mitchell GF. Ryan M. 1997. Reading the Irish landscape.
Genetics 13: 1195–1212. Dublin: Town House.
Kelly M. 2019. Adaptation to climate change through genetic Montgomery WI, Provan J, McCabe AM, Yalden DW. 2014.
Downloaded from https://academic.oup.com/biolinnean/advance-article/doi/10.1093/biolinnean/blaa214/6144720 by guest on 22 February 2021
accommodation and assimilation of plastic phenotypes. Origin of British and Irish mammals: disparate post-glacial
Philosophical Transactions of the Royal Society B: Biological colonisation and species introductions. Quaternary Science
Sciences 374: 20180176. Reviews 98: 144–165.
Kopatz A, Eiken HG, Aspi J, Kojola I, Tobiassen C, Mullins J, Statham MJ, Roche T, Turner PD, O’Reilly C.
Tirronen KF, Danilov PI, Hagen SB. 2014. Admixture 2010. Remotely plucked hair genotyping: a reliable and non-
and gene flow from Russia in the recovering Northern invasive method for censusing pine marten (Martes martes,
European brown bear (Ursus arctos). PLoS One 9: e97558. L. 1758) populations. European Journal of Wildlife Research
Kopelman NM, Mayzel J, Jakobsson M, Rosenberg NA, 56: 443–453.
Mayrose I. 2015. C lumpak : a program for identifying Natali C, Banchi E, Ciofi C, Manzo E, Cozzolino R,
clustering modes and packaging population structure Bartolommei P. 2010. Characterization of 13 polymorphic
inferences across K. Molecular Ecology Resources 15: microsatellite loci in the European pine marten Martes
1179–1191. martes. Conservation Genetics Resources 2: 397–399.
Lawton C, Hanniffy R, Molloy V, Guilfoyle C, Stinson M, OCarroll N. 2004. Forestry in Ireland - a concise history.
Reilly E. 2020. All-Ireland squirrel and pine marten survey Dublin: COFORD, National Council for Forest Research
2019. Irish wildlife manuals, no. 121. National Parks and and Development. Available at: http://www.coford.ie/media/
Wildlife Service, Department of Culture, Heritage and the coford/content/publications/Forestry%20in%20Ireland%20
Gaeltacht, Ireland. Available at: https://www.npws.ie/sites/ -%20A%20Concise%20History.pdf
default/files/publications/pdf/IWM121.pdf O’Donoghue, B. 2019. RAPTOR: recording and addressing
Leigh JW, Bryant D. 2015. popart: full-feature software for persecution and threats to our raptors. National Parks and
haplotype network construction. Methods in Ecology and Wildlife Service. Available at: https://www.npws.ie/sites/
Evolution 6: 1110–1116. default/files/publications/pdf/2019-raptor-report.pdf
Linnell J, Jackson CR. 2019. Bringing back large carnivores O’Mahony DT. 2017. A species distribution model for pine
to rewild landscapes. In: Pettorelli N, Durant S, Du Toit J, marten (Martes martes) in the least forested region of
eds. Rewilding (Ecological Reviews). Cambridge: Cambridge Europe. Mammal Research 62: 195–200.
University Press, 248–279. O’Mahony DT, O’Reilly C, Turner P. 2005. National pine
Luikart G, Allendorf FW, Cornuet JM, Sherwin WB. 1998. marten survey of Ireland 2005. A report to the Heritage Council
Distortion of allele frequency distributions provides a test and Forest Service of the Department of Agriculture and Food,
for recent population bottlenecks. The Journal of Heredity Ireland. Available at: http://www.coford.ie/media/coford/content/
89: 238–247. publications/projectreports/cofordconnects/PineMarten.pdf
Luikart G, Cornuet JM. 1998. Empirical evaluation of a test O’Mahony DT, O’Reilly C, Turner P. 2012. Pine marten
for identifying recently bottlenecked populations from allele (Martes martes) distribution and abundance in Ireland:
frequency data. Conservation Biology 12: 228–237. a cross-jurisdictional analysis using non-invasive genetic
Lysaght L. Marnell F. (eds.) 2016. Atlas of mammals in survey techniques. Mammalian Biology 77: 351–357.
Ireland 2010–2015. Waterford: National Biodiversity Data O’Mahony DT, Powell C, Power J, Hanniffy R, Marnell F,
Centre. Turner P, O’Reilly C. 2017a. Non-invasively determined
Martínková N, McDonald RA, Searle JB. 2007. Stoats multi-site variation in pine marten Martes martes density, a
(Mustela erminea) provide evidence of natural overland recovering carnivore in Europe. European Journal of Wildlife
colonization of Ireland. Proceedings of the Royal Society B: Research 63: 48.
Biological Sciences 274: 1387–1393. O’Mahony DT, Powell C, Power J, Hannify R, Turner P,
McNicol CM, Bavin D, Bearhop S, Ferryman M, Gill R, O’Reilly C. 2017b. National pine marten population assessment
Goodwin CED, MacPherson J, Silk MJ, McDonald RA. 2016. Irish wildlife manuals, no. 97. National Parks and Wildlife
2020. Translocated native pine martens Martes martes alter Service, Department of the Arts, Heritage, Regional, Rural and
short-term space use by invasive non-native grey squirrels Gaeltacht Affairs, Ireland. Available at: https://www.npws.ie/sites/
Sciurus carolinensis. Journal of Applied Ecology 57: 903–913. default/files/publications/pdf/IWM97.pdf
Mergey M, Larroque J, Ruette S, Vandel JM, Helder R, O’Meara DB, Edwards CJ, Sleeman DP, Cross TF,
Q u e n e y G , D e v i l l a r d S. 2 0 1 2 . L i n k i n g h a b i t a t Statham MJ, McDowell JR, Dillane E, Coughlan JP,
characteristics with genetic diversity of the European pine O’Leary D, O’Reilly C, Bradley DG, Carlsson J.
marten (Martes martes) in France. European Journal of 2012. Genetic structure of Eurasian badgers Meles meles
Wildlife Research 58: 909–922. (Carnivora: Mustelidae) and the colonization history of
Michaux JR, Hardy OJ, Justy F, Fournier P, Kranz A, Ireland. Biological Journal of the Linnean Society 106:
Cabria M, Davison A, Rosoux R, Libois R. 2005. 893–909.
© 2021 The Linnean Society of London, Biological Journal of the Linnean Society, 2021, XX, 1–15You can also read