Geographical analysis of the opinion and influence of users on Twitter during the coronavirus health crisis - RiuNet
←
→
Page content transcription
If your browser does not render page correctly, please read the page content below
Escola Tècnica Superior d’Enginyeria Informàtica
                Universitat Politècnica de València

Geographical analysis of the opinion and influence of
users on Twitter during the coronavirus health crisis
                       D EGREE FINAL WORK

                 Degree in Computer Engineering

                                    Author: Luis Carbonell Gironés
                                    Tutor: Enrique Orduña Malea
                                    Experimental tutor: Cristina I. Font

                                                        Course 2019-2020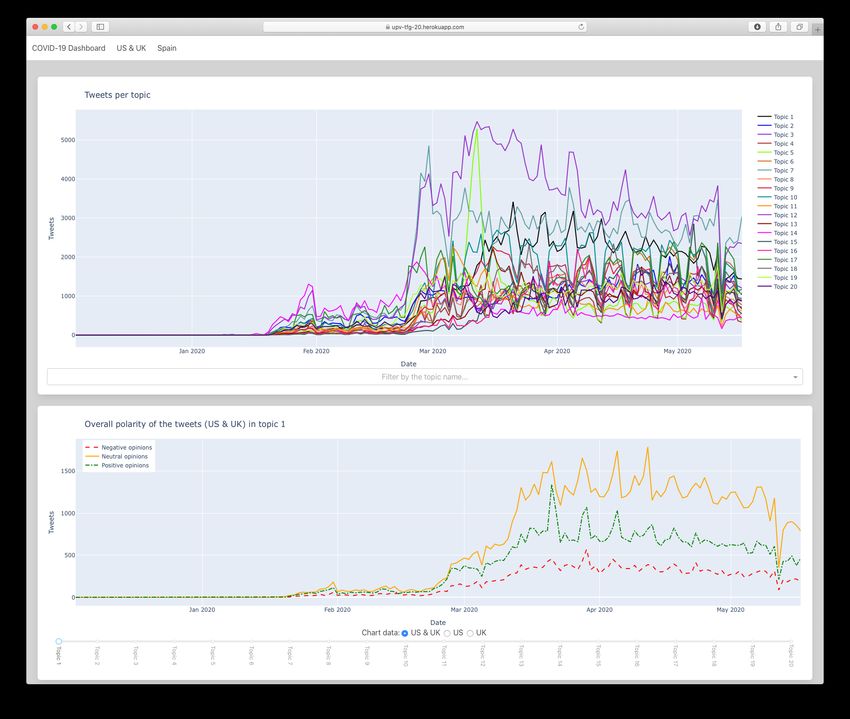
Resumen
    Desde marzo de 2020, el mundo se ha visto afectado por una pandemia causada por
el COVID-19. En este estudio, analizamos el impacto de la crisis de salud pública en la
opinión general y los intereses de la población. Para ello, los datos de Twitter se obtienen
y procesan para mostrar los temas principales durante el período de tiempo analizado.
La primera parte del estudio será un enfoque general para el análisis de los intereses y
sentimientos de los usuarios de Estados Unidos y el Reino Unido, desde el 1 de diciembre
de 2019 hasta el 15 de mayo de 2020. La segunda parte de este estudio será un análisis
más detallado de los intereses de los usuarios de Twitter en España durante el periodo
de confinamiento desde el 14 de marzo hasta el 21 de junio. El resultado muestra que los
tweets en el conjunto de datos en inglés son en su mayoría endogamic, ya que su preo-
cupación por las noticias internacionales es por su preocupación por el impacto que la
pandemia puede tener en sus países. En el conjunto de datos español, sin embargo, los
usuarios comentan noticias internacionales y noticias locales también. En ambos conjun-
tos de datos, hay una disminución en la actividad de tweeting a medida que evoluciona
la pandemia.
Palabras clave: coronavirus, covid-19, análisis de sentimientos, análisis de temas, twitter

                                                                          Resum
    Des del març del 2020, el món s’ha vist afectat per una pandèmia provocada per la
COVID-19. En aquest estudi analitzem l’impacte de la crisi de salut pública en l’opinió
general i els interessos de la població. Per fer-ho, les dades de Twitter s’obtenen i es
processen per mostrar els temes principals durant el termini analitzat. La primera part de
l’estudi serà una aproximació general a l’anàlisi dels interessos i sentiments dels usuaris
nord-americans i del Regne Unit, des de l’1 de desembre de 2019 fins al 15 de maig de
2020. La segona part d’aquest estudi serà una anàlisi més detallada dels interessos dels
usuaris de Twitter a Espanya durant el període de confinament del 14 de març al 21 de
juny. El resultat mostra que els tuits del conjunt de dades anglès són majoritàriament
endogàmics, ja que la seva preocupació per les notícies internacionals està fora de la seva
preocupació per l’impacte que la pandèmia pot tenir als seus països. En el conjunt de
dades espanyol, però, els usuaris també comenten notícies internacionals i notícies locals.
En ambdós conjunts de dades, hi ha una disminució de l’activitat tweeting a mesura que
evoluciona la pandèmia.
Paraules clau: coronavirus, covid-19, anàlisi de sentiments, anàlisi de temes, twitter

                                                                     Abstract
    From march 2020, the world has been affected by a pandemic caused by the COVID-
19. In this study, we analyse the public health crisis impact on the overall opinion and
interests of the population. To do so, data from Twitter is fetched and processed to show
the main topics during the analysed time frame. The first part of the study will be a gen-
eral approach to the analysis of the interests and sentiments of the US and UK users, from
the 1st of December 2019 until the 15th of May 2020. The second part of this study will be
a more detailed analysis of the interests of Twitter users in Spain during the confinement
period from the 14th of March until the 21st of June. The outcome shows that the tweets
in the English dataset are mostly endogamic, as their concern for international news is
out of their concern of the impact that the pandemic may have in their countries. In
the Spanish dataset, however, the users comment on international news and local news

                                            iii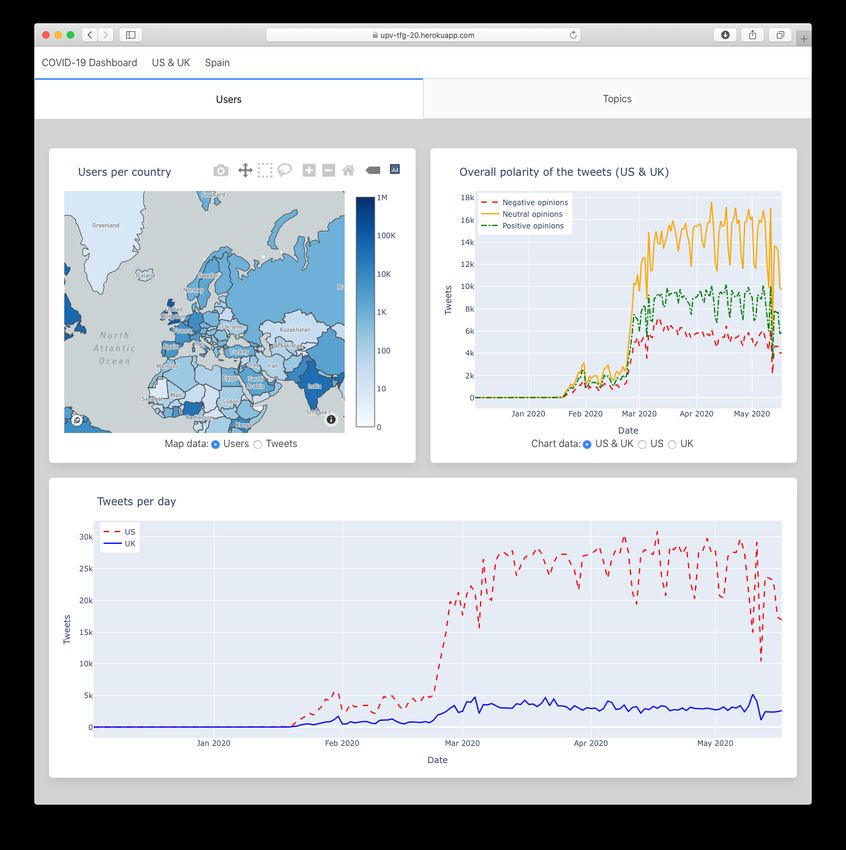
iv

as well. In both datasets, there is a decrease in the tweeting activity as the pandemic
evolves.
Key words: coronavirus, covid-19, sentiment analysis, topic analysis, twitter
Contents
Contents                                                                                                                                                           v
List of Figures                                                                                                                                                  vii
List of Tables                                                                                                                                                   viii

1 Introduction                                                                                                                                                     1
  1.1 Motivation . . . . . .         .   .   .   .   .   .   .   .   .   .   .   .   .   .   .   .   .   .   .   .   .   .   .   .   .   .   .   .   .   .   .     1
  1.2 Objectives . . . . . .         .   .   .   .   .   .   .   .   .   .   .   .   .   .   .   .   .   .   .   .   .   .   .   .   .   .   .   .   .   .   .     2
  1.3 Structure . . . . . . .        .   .   .   .   .   .   .   .   .   .   .   .   .   .   .   .   .   .   .   .   .   .   .   .   .   .   .   .   .   .   .     2
  1.4 Research background            .   .   .   .   .   .   .   .   .   .   .   .   .   .   .   .   .   .   .   .   .   .   .   .   .   .   .   .   .   .   .     2
2 Methodology                                                                                                                                                      5
  2.1 Data gathering . .     .   .   .   .   .   .   .   .   .   .   .   .   .   .   .   .   .   .   .   .   .   .   .   .   .   .   .   .   .   .   .   .   .     5
  2.2 Preprocessing . .      .   .   .   .   .   .   .   .   .   .   .   .   .   .   .   .   .   .   .   .   .   .   .   .   .   .   .   .   .   .   .   .   .     6
  2.3 Topic models . . .     .   .   .   .   .   .   .   .   .   .   .   .   .   .   .   .   .   .   .   .   .   .   .   .   .   .   .   .   .   .   .   .   .     7
  2.4 Data visualisation     .   .   .   .   .   .   .   .   .   .   .   .   .   .   .   .   .   .   .   .   .   .   .   .   .   .   .   .   .   .   .   .   .    10
3 Results                                                                                                                                                         15
  3.1 English dataset . . . . . . . . . . . . . . . . . . . . . . . . . . . . . . . . . .                                                                         15
  3.2 Spanish dataset . . . . . . . . . . . . . . . . . . . . . . . . . . . . . . . . . .                                                                         30
4 Discussion                                                                                                                                                      79
5 Conclusions                                                                                                                                                     81
Bibliography                                                                                                                                                      82

Appendix
A Supplementary information                                                                                                                                       85

                                                                 v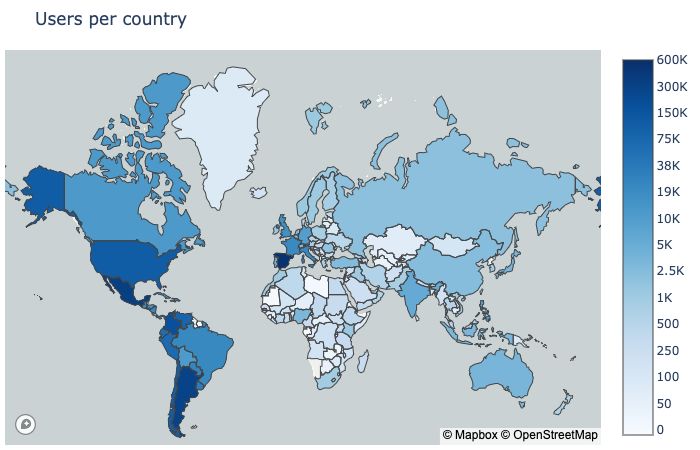
List of Figures
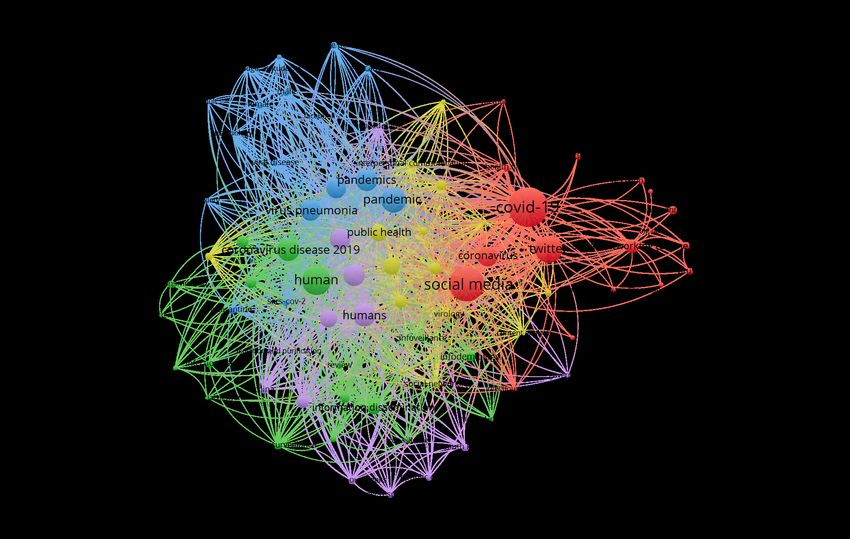
1.1 Network representation of related papers. Source: Scopus; powered by
VOSviewer. . . . . . . . . . . . . . . . . . . . . . . . . . . . . . . . . . . . . 3
2.1 Data processing flowchart . . . . . . . . . . . . . . . . . . . . . . . . . . . . 11
2.2 US & UK users’ data . . . . . . . . . . . . . . . . . . . . . . . . . . . . . . . 12
2.3 US & UK topics’ data . . . . . . . . . . . . . . . . . . . . . . . . . . . . . . . 12
2.4 Spain users’ data . . . . . . . . . . . . . . . . . . . . . . . . . . . . . . . . . 13
2.5 Spain topics’ data . . . . . . . . . . . . . . . . . . . . . . . . . . . . . . . . . 13
3.1 English dataset choropleth map . . . . . . . . . . . . . . . . . . . . . . . . . 15
3.2 Tweets per day in the English dataset . . . . . . . . . . . . . . . . . . . . . . 16
3.3 Timeline chart of the polarity of the tweets in the English dataset . . . . . 16
3.4 Top 20 words in topic 12 . . . . . . . . . . . . . . . . . . . . . . . . . . . . . 23
3.5 Top 20 words in topic 19 . . . . . . . . . . . . . . . . . . . . . . . . . . . . . 25
3.6 Top 20 words in topic 20 . . . . . . . . . . . . . . . . . . . . . . . . . . . . . 26
3.7 Timeline charts of the polarity of the tweets in each topic (US UK) . . . . 27
3.8 Spanish dataset choropleth map . . . . . . . . . . . . . . . . . . . . . . . . . 30
3.9 Spanish dataset users choropleth map . . . . . . . . . . . . . . . . . . . . . 30
3.10 Spanish dataset tweets choropleth map . . . . . . . . . . . . . . . . . . . . 31
3.11 Top 20 words in topic 1 . . . . . . . . . . . . . . . . . . . . . . . . . . . . . . 34
3.12 Top 20 words in topic 2 . . . . . . . . . . . . . . . . . . . . . . . . . . . . . . 35
3.13 Top 20 words in topic 3 . . . . . . . . . . . . . . . . . . . . . . . . . . . . . . 36
3.14 Top 20 words in topic 4 . . . . . . . . . . . . . . . . . . . . . . . . . . . . . . 37
3.15 Top 20 words in topic 5 . . . . . . . . . . . . . . . . . . . . . . . . . . . . . . 38
3.16 Top 20 words in topic 6 . . . . . . . . . . . . . . . . . . . . . . . . . . . . . . 39
3.17 Top 20 words in topic 7 . . . . . . . . . . . . . . . . . . . . . . . . . . . . . . 40
3.18 Top 20 words in topic 8 . . . . . . . . . . . . . . . . . . . . . . . . . . . . . . 41
3.19 Top 20 words in topic 9 . . . . . . . . . . . . . . . . . . . . . . . . . . . . . . 42
3.20 Top 20 words in topic 10 . . . . . . . . . . . . . . . . . . . . . . . . . . . . . 43
3.21 Top 20 words in topic 12 . . . . . . . . . . . . . . . . . . . . . . . . . . . . . 45
3.22 Top 20 words in topic 13 . . . . . . . . . . . . . . . . . . . . . . . . . . . . . 46
3.23 Top 20 words in topic 14 . . . . . . . . . . . . . . . . . . . . . . . . . . . . . 47
3.24 Top 20 words in topic 15 . . . . . . . . . . . . . . . . . . . . . . . . . . . . . 48
3.25 Top 20 words in topic 16 . . . . . . . . . . . . . . . . . . . . . . . . . . . . . 49
3.26 Top 20 words in topic 17 . . . . . . . . . . . . . . . . . . . . . . . . . . . . . 50
3.27 Top 20 words in topic 18 . . . . . . . . . . . . . . . . . . . . . . . . . . . . . 51
3.28 Top 20 words in topic 19 . . . . . . . . . . . . . . . . . . . . . . . . . . . . . 52
3.29 Top 20 words in topic 20 . . . . . . . . . . . . . . . . . . . . . . . . . . . . . 53
3.30 Top 20 words in topic 21 . . . . . . . . . . . . . . . . . . . . . . . . . . . . . 54
3.31 Top 20 words in topic 22 . . . . . . . . . . . . . . . . . . . . . . . . . . . . . 55
3.32 Top 20 words in topic 23 . . . . . . . . . . . . . . . . . . . . . . . . . . . . . 57
3.33 Top 20 words in topic 24 . . . . . . . . . . . . . . . . . . . . . . . . . . . . . 58
3.34 Top 20 words in topic 25 . . . . . . . . . . . . . . . . . . . . . . . . . . . . . 60
3.35 Top 20 words in topic 26 . . . . . . . . . . . . . . . . . . . . . . . . . . . . . 61
vii
3.36   Top 20 words in topic 27 . . . . . . . . . . . . . . . . . . . . . .   .   .   .   .   .   .   .   62
3.37   Top 20 words in topic 28 . . . . . . . . . . . . . . . . . . . . . .   .   .   .   .   .   .   .   63
3.38   Top 20 words in topic 29 . . . . . . . . . . . . . . . . . . . . . .   .   .   .   .   .   .   .   64
3.39   Top 20 words in topic 30 . . . . . . . . . . . . . . . . . . . . . .   .   .   .   .   .   .   .   66
3.40   Top 20 words in topic 31 . . . . . . . . . . . . . . . . . . . . . .   .   .   .   .   .   .   .   68
3.41   Top 20 words in topic 32 . . . . . . . . . . . . . . . . . . . . . .   .   .   .   .   .   .   .   69
3.42   Top 20 words in topic 33 . . . . . . . . . . . . . . . . . . . . . .   .   .   .   .   .   .   .   70
3.43   Top 20 words in topic 34 . . . . . . . . . . . . . . . . . . . . . .   .   .   .   .   .   .   .   72
3.44   Top 20 words in topic 35 . . . . . . . . . . . . . . . . . . . . . .   .   .   .   .   .   .   .   73
3.45   Timeline charts of the tweeting activity in each topic (Spain) I       .   .   .   .   .   .   .   74
3.46   Timeline charts of the tweeting activity in each topic (Spain) II      .   .   .   .   .   .   .   77

                                                          List of Tables

2.1    User geolocation distribution in the datasets . . . . . . . . . . . . . . . . .                     6
2.2    Bot rate of the datasets . . . . . . . . . . . . . . . . . . . . . . . . . . . . . .                6
2.3    Coherence scores, minimum word freq. and top words removed of each
       topic model . . . . . . . . . . . . . . . . . . . . . . . . . . . . . . . . . . . .                 8
2.4    Coherence scores of the topic models generated . . . . . . . . . . . . . . .                        8
2.5    Initial hyperparameters of the topic model in the English dataset . . . . .                         8
2.6    Optimised hyperparameters of the topic model in the English dataset . . .                           9
2.7    Coherence scores of the topic models from the Spanish dataset . . . . . . .                         9
2.8    Initial hyperparameters of the topic model in the Spanish dataset . . . . .                         9
2.9    Optimised hyperparameters of the topic model in the Spanish dataset . .                            10

3.1    List of topics obtained after applying LDA in the English dataset . . . . .                        17
3.2    List of topics obtained after applying LDA in the Spanish dataset . . . . .                        32

                                             viii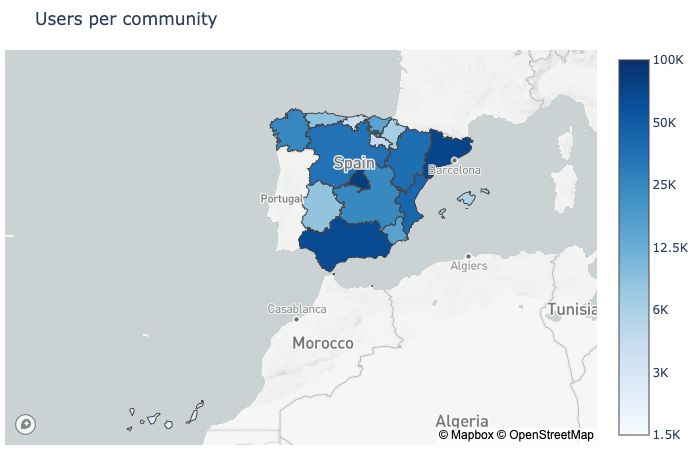
CHAPTER 1

                                                              Introduction

Nowadays, social networks are one of the largest content generators that exist1 . People
share and express their ideas about almost any existing topic, and information is shared
instantaneously about any event happening around the globe.
    Such a vast amount of information is shared by posting on social media: concerns,
reactions and interests. All this data can be useful to understand better the society and
the concerns of the population regarding specific topics as well as finding issues that arise
due to an event.
    The challenge consists of gathering all that content from the social media platforms
and processing it, so it is easier to understand. Such a large amount of data requires to
use natural language processing techniques to handle all the posts gathered, a system for
storing the data has to be chosen so that it allows to query the data quickly, methods that
extract the essential facts from the data gathered and finally a platform to show the ideas
and quantitative data obtained during the study.
    Disciplines like Cybermetrics or Computational Social Science have surged due to the
interest to analyse the large volumes of data that are generated daily, which are essential
especially to social sciences. For such purpose, it is necessary to apply multiple research
methods and analysis techniques. The results from analysing this data, can outcome
useful information when making decisions, or to learn and understand social, cultural,
linguistical and behavioural aspects of our society. These aspects are what makes the
results so useful in certain areas, as for example public healthcare policies.

1.1 Motivation

Throughout the bachelor’s degree, I have enjoyed learning methods on how to store,
manage and process data from a merely entrepreneurial or business mindset: designing
and building to get the desired outcome. Because my mindset has always been intrin-
sically curious, I did not enjoy most of the projects and tasks assigned, even though I
understood its goal and usefulness, because the outcome was always predictable and
did not make me learn anything new other than how to apply the theory seen in class.
    At my elected class of Social Web Behaviour & Network Analysis, I found out how
all my previous knowledge to that date for which I had not perceived its utility for an
issue of genuine interest to me, was somehow closely integrated with a goal that made a
social impact, be it for good or not so good intentions. There, I learned that techniques

    1 https://web-assets.domo.com/blog/wp-content/uploads/2017/07/17_domo_data-never-sleeps-5-

01.png

                                               1
2 Introduction
like those applied in previous subjects for clustering were used to analyse and eviscerate
the information that we produce every second of our lives. It was the before-mentioned
moment when I realised that the given approaches could be beneficial to other social
issues that could make a positive effect.
This project has given me the possibility of finding a topic that captured my interest,
as it was the development of a worldwide social event such as the COVID-19 pandemic.
The health pandemic brought expeditious changes to all of us, in Spain, we moved
from being sceptic of the situation and thinking nothing would happen, to being contin-
uously bombed with information about positive cases and hospitalisations. Due to the
uniqueness of this tool, Twitter seemed a platform where everyone shared their concerns,
interests and opinion regarding anything and everything about the pandemic, and thus
the perfect platform to conduct this study.
1.2 Objectives
Given the motivation of this study, the main objective is to identify the topics that con-
cerned the most to Twitter users during the public health crisis.
To achieve such goal, four sub-goals are taken into account:
- Determine if the topics of interest change depending on the location. - Analyse
the perception of each topic by the users. - Quantify the evolution of the topics in the
analysed time frame. - Design an information pipeline that allows to automatise the
procedure (collection, storage, analysis, visualisation) of the data from Twitter.
1.3 Structure
This document is structured in four parts:
Methodology: procedure to gather and process the data is detailed so that it can be
understood how the results are obtained.
Results: the data is presented according to the findings from the methodology section,
relevant news articles and tweets from the datasets are included to improve the overall
understanding.
Discussion: the limitations and possible improvements or modifications that would
be made in the future, as well as the findings on the accuracy of the procedure, followed.
Conclusion: answers to the proposed objectives, possible applications in other fields
and how this Bachelor’s Degree has helped to design and conduct this study.
1.4 Research background
During the COVID-19 pandemic, Twitter has been used in many studies to analyse public
opinion and interests as shown in figure 1.1.
Most of them focused on English content except for those that gathered data in mul-
tiple languages to study the difference between communities and how their concern of
the pandemic evolves [2] or those that investigate the information transmission and what
words were most common when transmitting information during the health crisis in spe-
cific communities [11].1.4 Research background 3
Figure 1.1: Network representation of related papers. Source: Scopus; powered by VOSviewer.
A Psychological study analysed the fear and anxiety caused by COVID-19 on Twit-
ter[13] concluding that despite many scientists and healthcare professionals working
around the clock to find a vaccine, which didn’t exist at the moment, "people are tremen-
dously living with psychological fear and anxiety throughout the world".
Jahanbin et al. worked on the prediction of the COVID-19 outbreak by using Twit-
ter and web news mining[6] concluding that the networks used reported statistical data
that could be used to predict morbidity rates in each region and help design educational
programs to train communities on healthcare risks.
The analysis of tweeting trends during the pandemic by Leelawat et al.[9] brought
to attention to how trending topics in English, Japanese and Chinese social media are
closely related to breaking news and COVID-19 cases.
At the beginning of the pandemic, countries like Italy entered a "buffer zone", a tem-
poral zone between normality and pandemic. During that time, a study from Vicari et al.
[15] report a thrive in collective irony that allowed people to temporarily overlooking the
feelings and uncertainty provoked by the health crisis.
There’s been analysis of the differences between genders when sharing information
and the topics of interest, laying apparent distinctions between males and females [14].
Research on how conspiracies and misinformation spread during the pandemic [8] or
the prevalence of low-credibility information on Twitter [16] help understand how non-
accurate information proliferates.
Political leaders are not exempt from the analysis. Some studies scrutinise the content
they post on Twitter to categorise the themes of viral tweets [12] that enables further
understanding of how politicians use the social network to communicate with citizens.
Conspiracies have become quite common nowadays, with the internet, the world is
connected for good, but that makes any information to be quickly spread. A joint paper4 Introduction
from British and Spanish universities [1] analysed the 5G conspiracy during the COVID-
19 pandemic, using Twitter as the source of data to analyse. The results revealed that
there were no authority figures, but an isolated group and a broadcast group, and that,
fake news websites played a significant role in the spread of such hoaxes and conspira-
cies.
It is worth noting, the uniqueness of this study regarding the geography analysed as
there are no known studies to the author that use a similar technique to analyse the inter-
ests of the Spanish population during the state of alarm due to the COVID-19 pandemic.CHAPTER 2
Methodology
2.1 Data gathering
2.1.1. Tweet download dates
When downloading the data, two datasets were designed: the English and the Spanish
dataset, the former containing tweets from the US & the UK and the latter containing
tweets from Spain only.
The English dataset tweets were downloaded from the 16th of May 2020 until the 19th
of May 2020 with a daily limit of 200,000 tweets a day, for the period comprised between
the 2nd of December 2019 and the 18th of May 2020.
The tweets in the Spanish dataset for the period comprised between the 14th of March
2020 and the 22nd of June 2020 were downloaded from the 9th of June 2020 until the 12th
of July 2020 with no daily limit. The dataset contains an approximate total of 25.68 million
unique tweet IDs.
In both datasets, the query sent to Twitter is an OR statement composed of the main
COVID-19 pandemic words: coronavirus, covid, covid-19, covid19. Words were used
instead of hashtags to capture all the possible mentions and not limiting the search to
only those tweets using the hashtags.
2.1.2. TWINT
The Python toolkit Twint1 was used to retrieve the tweets. For each tweet, all this data
was also stored: tweet id, conversation id, creation time, date, time, timezone, user id,
username, name, place, mentions, URLs, photos, number of replies, number of retweets,
number of likes, hashtags, cashtags, links, retweet (boolean), quoted URL, video (boolean),
near, geo, source, user rt id, user rt (boolean), the id of the original tweet if retweeted, data
from the tweet it replies to and retweet date.
2.1.3. Geolocation
The location of the users is gathered by downloading its profile data and analysing the lo-
cation field and biography looking for any geographic references. In the English dataset,
the Python module GeoText is used whereas, on the Spanish dataset, the Python module
Geocoder is used together with an instance of the Open Street Maps Nominatim server to
1 https://github.com/twintproject/twint
56 Methodology
achieve better accuracy in the location prediction. Using different tools was needed due
to the accuracy needed: country-level for the English dataset and city or province-level
for the Spanish dataset.The technique used in the English dataset may geocode locations
to the wrong country if the same city or state is in different countries, and is only able
to geocode locations in their English form, i.e. ’Catalunya’ or ’Andalucía’ would not be
identified. Python module Geocoder, despite offering better accuracy, also has the disad-
vantage of geocoding random locations like "Jupyter" to real places on the planet.
The percentage of geolocated users is shown in the table below:
Dataset Known location Unknown location Total
English 640,998 (28.7%) 1,300,917 (58.23%) 2,233,831
Spanish 2,363,950 (61.78%) 1,461,919 (38.2%) 3,825,869
Table 2.1: User geolocation distribution in the datasets
2.1.4. Filters applied
Once the tweets and users are geolocated, the English dataset is filtered, so only tweets
of users from the United States or the United Kingdom are used for further analysis.
Likewise, the Spanish dataset only contains tweets from users located in Spain.
2.1.5. Botometer
With the aim of understanding the users base of each processed dataset, the tool Botome-
ter rates the automation of the user accounts with a confidence level of 95% and a confi-
dence interval of 5%. Although this score depends on factors like user activity and may
include false positives in the bot rate, it gives an overall view of the number of automated
accounts in the dataset. The table below shows the results for both datasets:
2.1.6. Other datasets
Other datasets included in the study of the Spanish dataset regarding COVID-19 data
(hospitalisations, discharges, PCRs, tests and deaths) are from the Datadista Github repos-
itory2 .
Dataset Human Bot
English 97.00% 3.00%
Spanish 95.05% 4.95%
Table 2.2: Bot rate of the datasets
2.2 Preprocessing
Both datasets were preprocessed to ease the topic modelling process.
2 https://github.com/datadista/datasets/tree/master/COVID%20192.3 Topic models 7
2.2.1. English dataset
The tweets in the English dataset were first converted to lowercase, then the URLs, hash-
tags and mentions were removed, then the text was tokenised using the NLTK library,
right after the stopwords and non-words were removed and finally, the words whose
length is less than three words were removed, the remaining words were lemmatised.
2.2.2. Spanish dataset
The preprocessing in the Spanish dataset was slightly different, everything was the same,
except for the removal of the @ and # signs but not the hashtags or account mentions,
because it was considered that people use accounts and hashtags to mention places and
that were being analysed. On the other hand, the Spanish dataset had a slightly higher
requirement for the word length, as words had to be longer than three characters to be
kept, so that articles like "de", "del", "el", "la" or "una" were automatically removed, as
well as other words that do not add any meaning to the topics. This last change reduced
the words bank from 46,238,487 to 38,736,492. This change was done after an initial round
of LDA, where the models laid topics with words like: "per i do da as", "per i d amb els",
"do da as na non". To lemmatise the words in this dataset, Stanford CoreNLP[10] was
used.
2.3 Topic models
2.3.1. LDA and Tomotopy
In order to generate the topic models, the Latent Dirichlet Allocation algorithm was cho-
sen considering the results of the survey by Jipeng, Qian et al. [7] where the tweets
dataset had the highest accuracy using GPU-PDMM followed by LDA and PTM. Be-
cause of the lack of a Python library implementing the former algorithm, known to the
author, LDA was chosen instead due to its popularity and wide range of libraries. Rather
than using the popular libraries Gensim or Scikit to analyse the dataset, the Tomotopy
toolkit implementing the LDA algorithm [3][4] is used because of its fast results despite
the need for more iterations to get the results, this is because Gensim and Scikit use Vari-
ational Bayes and Tomkit uses Gibbs Sampling. The model used in the study is selected
by taking into account the coherence score of each generated model and the number of
topics, as per the conclusions from [5] taking into account the topics generated by each
model and the social aspect of each of them.
2.3.2. English dataset
The following topics were generated in the English dataset using Tomotopy 0.9.1 with
optimisation enabled and random seeds:
By observing table 2.3, it is apparent that using the minimum term frequency and top
words preprocessing the results improved at least by 1%, that is why the other models
were generated with those requirements, the Stanford NLP team also recommends on
their Topic Modeling Toolbox 3 to remove the top words and set a minimum frequency
for each word, which is why this technique is used in the study.
3 https://nlp.stanford.edu/software/tmt/tmt-0.4/8 Methodology
Model no. Topics Min. freq. Top words Coherence score
1 10 0 0 0.47208244
2 15 0 0 0.48519221
3 20 0 0 0.52436863
4 10 5 30 0.47258140
5 15 5 30 0.56298295
6 20 5 30 0.58429453
Table 2.3: Coherence scores, minimum word freq. and top words removed of each topic model
Model no. Topics Min. freq. Top words Coherence score
7 25 5 30 0.59425437
8 30 5 30 0.60461300
9 35 5 30 0.60640748
10 40 5 30 0.62173954
11 45 5 30 0.62347002
12 50 5 30 0.63055895
13 55 5 30 0.63241238
14 60 5 30 0.62654774
15 65 5 30 0.63921376
16 70 5 30 0.63778834
17 75 5 30 0.64428038
18 80 5 30 0.65103415
19 85 5 30 0.64532315
20 90 5 30 0.64262086
21 95 5 30 0.64015042
22 100 5 30 0.65026269
Table 2.4: Coherence scores of the topic models generated
Model number 18 with 80 topics, had a higher coherence score, almost 7% higher than
model number 6, but the topics overlapped, that and the relatively high coherence score
of model 6 is the reason why a lower coherence model was chosen.
The hyperparameters are tuned by Tomotopy during the optimisation process; the
seed is generated randomly unless explicitly specified. The initial parameters used in
model 6 are shown in table 2.5.
Alpha Eta Seed
0.1 0.01 1634325128
Table 2.5: Initial hyperparameters of model 6
The optimised hyperparameters for model 6 are in table 2.6.
The optimised η is 0.009999999776482582≈0.01 and α is a vector because it determines
both the concentration and the distribution of the dirichlet.
2.3.3. Spanish dataset
The topics generated in the Spanish dataset use the same initial configuration as before,
and after applying LDA using Tomotopy, the following results are obtained:2.3 Topic models 9
Topic α Alpha η Eta Topic α Alpha η Eta
1 0.04786995 ≈ 0.01 11 0.0246688 ≈ 0.01
2 0.03028768 ≈ 0.01 12 0.08299106 ≈ 0.01
3 0.02600852 ≈ 0.01 13 0.02694346 ≈ 0.01
4 0.02367546 ≈ 0.01 14 0.02616131 ≈ 0.01
5 0.02690362 ≈ 0.01 15 0.02476281 ≈ 0.01
6 0.0318893 ≈ 0.01 16 0.02483426 ≈ 0.01
7 0.06597356 ≈ 0.01 17 0.04007532 ≈ 0.01
8 0.02706708 ≈ 0.01 18 0.02944445 ≈ 0.01
9 0.03751139 ≈ 0.01 19 0.03318707 ≈ 0.01
10 0.04596604 ≈ 0.01 20 0.02584574 ≈ 0.01
Table 2.6: Optimised hyperparameters of model 6
Model no. Topics Min. freq. Top words Coherence score
1 10 5 30 0.43489614
2 15 5 30 0.50402074
3 20 5 30 0.48818585
4 25 5 30 0.52275900
5 30 5 30 0.53912560
6 35 5 30 0.56245883
7 40 5 30 0.56680728
8 45 5 30 0.56816329
9 50 5 30 0.58335623
10 55 5 30 0.62039953
11 60 5 30 0.63546988
12 65 5 30 0.61586836
13 70 5 30 0.62985727
14 75 5 30 0.63560033
15 80 5 30 0.65025692
16 85 5 30 0.64952227
17 90 5 30 0.63884560
18 95 5 30 0.65002834
19 100 5 30 0.64305672
Table 2.7: Coherence scores of the topic models from the Spanish dataset
The highest coherence score was obtained in model 18 with 95 topics, but as occurred
in the English dataset, model 6 was chosen even though it has a lower coherence score
because it is more understandable and doesn’t overlap as much.
The hyperparameters and seed were set using the same procedure as in the English
dataset. The initial parameters used in model 6 are shown in table 2.8.
Alpha Eta Seed
0.1 0.01 1095214984
Table 2.8: Initial hyperparameters of model 6
The optimised hyperparameters for model 6 are shown in figure 2.9.
The optimised η is 0.009999999776482582≈0.01 and α is a vector because it determines
both the concentration and the distribution of the dirichlet.10 Methodology
Topic α Alpha η Eta
Topic α Alpha η Eta
1 0.00522919 ≈ 0.01
19 0.01447704 ≈ 0.01
2 0.03156144 ≈ 0.01
20 0.01143125 ≈ 0.01
3 0.01652787 ≈ 0.01
21 0.01909995 ≈ 0.01
4 0.01705627 ≈ 0.01
22 0.02340267 ≈ 0.01
5 0.01323911 ≈ 0.01
23 0.01361348 ≈ 0.01
6 0.00962649 ≈ 0.01
24 0.0114844 ≈ 0.01
7 0.00555154 ≈ 0.01
25 0.02130513 ≈ 0.01
8 0.03528611 ≈ 0.01
26 0.01846656 ≈ 0.01
9 0.03379017 ≈ 0.01
27 0.01341356 ≈ 0.01
10 0.0124288 ≈ 0.01
28 0.01524314 ≈ 0.01
11 0.01172946 ≈ 0.01
29 0.01625623 ≈ 0.01
12 0.03044947 ≈ 0.01
30 0.0114897 ≈ 0.01
13 0.00894839 ≈ 0.01
31 0.01463872 ≈ 0.01
14 0.01960727 ≈ 0.01
32 0.01743889 ≈ 0.01
15 0.01026232 ≈ 0.01
33 0.02137626 ≈ 0.01
16 0.01643065 ≈ 0.01
34 0.0114294 ≈ 0.01
17 0.00741075 ≈ 0.01
35 0.01730559 ≈ 0.01
18 0.0171014 ≈ 0.01
Table 2.9: Optimised hyperparameters of model 6
2.4 Data visualisation
2.4.1. Problem analysis
Because of the large amount of the data used in the study, it is almost impossible to
understand the results without plotting them in charts or choropleth maps. Also, another
goal of the study is making this data as open and available as possible, and thus creating
a dashboard offers an easy tool to see the results of the analysis. The data by itself, are
thousands and even millions of tweets and results of categorising them in topics which
would have no meaning if they were not organised in a way that makes it clear and easy
to understand.
To be able to find correlations in data, as for example, the change of opinion/interest
depending on the cases, hospitalisations or deaths, presenting them in the same chart,
improves the comprehension and results of the analysis.
2.4.2. Solution design
In order to visualise all this data, it was concluded that it was best to design a dashboard
where all the data would be centralised and easily accessible, organised by sections and
in a single-page view so that all data related to the same topic would be shown in the
same page, structured in grids.
This decision was made because even though it would be simpler to show all the
data in charts and plots in this document, it would not have any interactive components
which would offer the same experience when trying to browse the data. For example, a
static chart does not allow the user to carefully examine the temporal evolution, with
the accuracy of the data gathered in the previous processes. On the other hand, the
possibility of filtering the data shown in the charts would let the user deepen on the
results that might be of greater interest.2.4 Data visualisation 11
Figure 2.1: Data processing flowchart
Figure 2.1 describes the data pipeline, from the tweet search to the plotting of the
charts. The data generated by the processes always resulted in CSV files because this
would facilitate the saving speed for the parallel threads during the search and geoloca-
tion, it was also used as a backup method, because in the case that the database got cor-
rupted, the CSV files would make it easy to restore the data. Using the database would
also allow using fast queries during the analysis, which facilitated filtering the users and
its tweets by location.
Because the main purpose of this work was to gather the data and then extract con-
clusions, the process of designing this interface was reactive rather than planned, that
is to say: whenever new data was gathered, new charts and plots were made to see the
results, and then they were structured in the dashboard.
2.4.3. Technology used
To develop the solution, two Python libraries were used: Plotly: It is a Python graphing
library that allows plotting any data in many formats, allowing to customise every aspect
of the resulting chart: colours, fonts, information panels... Its graphs range from bar
charts, pie charts, scatter plots or bubble charts, to choropleth maps, heatmaps, contour
plots, 3d charts or animations.
Dash: From the creators of Plotly, it is a framework built to create web apps that
heavily depend on data visualisation. It is completely integrated with Plotly so that the
developer can add any figures to the web app that can interact with forms and are up-
dated dynamically, depending on the user response.
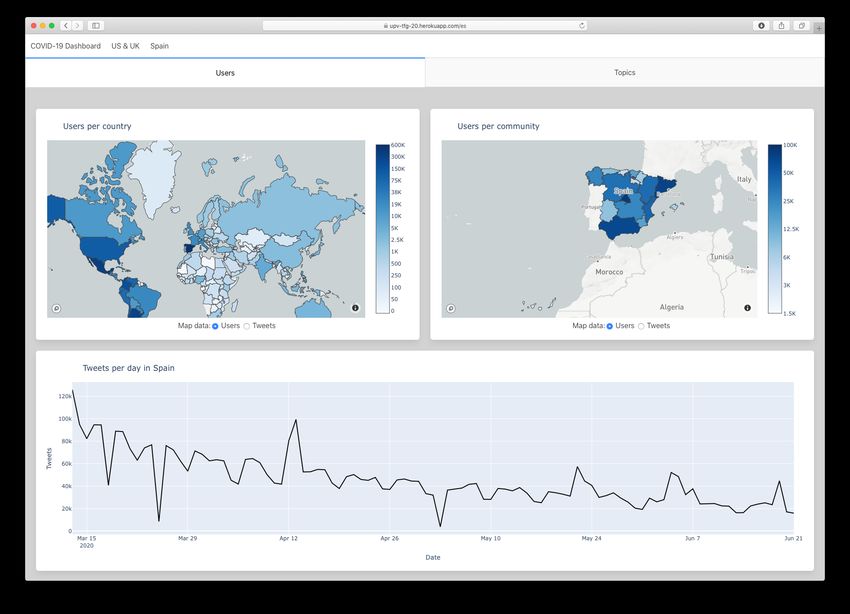
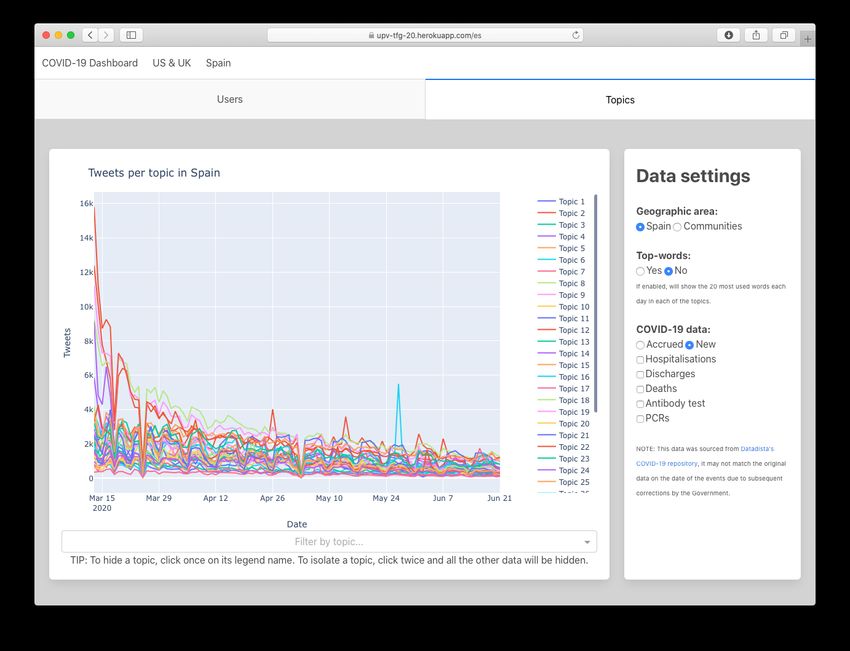
2.4.4. Dashboard
The final data visualisation platform is shown in figures 2.2, 2.3, 2.4 and 2.5. It can be
accessed as a Heroku app on https://upv-tfg-20.herokuapp.com12 Methodology
Figure 2.2: US & UK users’ data
Figure 2.3: US & UK topics’ data2.4 Data visualisation 13
Figure 2.4: Spain users’ data
Figure 2.5: Spain topics’ dataCHAPTER 3
Results
3.1 English dataset
The study on the UK and US activity on Twitter during the period comprised between
the 2nd of December 2019 and the 18th of May 2020 is an overall view of the behaviour
from the users in both countries; it may give a general idea of the interests, but it is clearly
not an accurate representation of the concerns and the activity of the users during such
period.
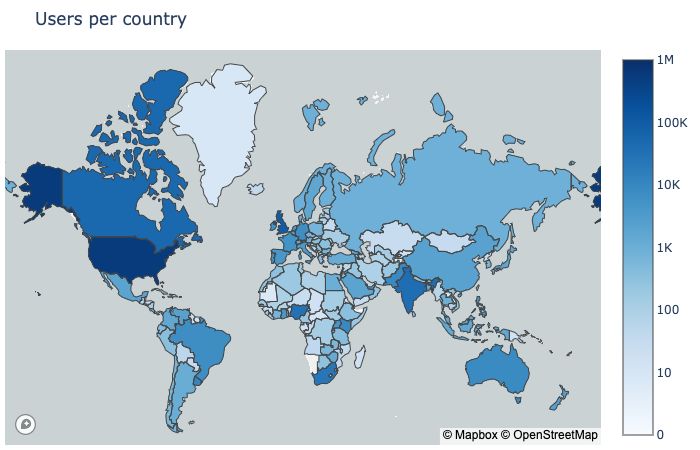
At first view, the dataset contains tweets from a broad range of countries, as can be
seen in the choropleth map below.
Figure 3.1: Choropleth map representing the amount of users per country in the English dataset
As per the study methodology, only tweets from the US or the UK are considered. A
total of 548,520 users in the dataset are located in the US, whilst 92,477 users are located
in the UK. Their tweeting activity can be seen in the timeline chart below, where it is
clearly seen that the interest in COVID-19 starts to appear on Twitter in late January
2020. The peak activity starts growing in the first week of April, and something that
draws attention is the fact that despite the public interest in COVID-19, in both countries
the tweeting activity decreases on the weekends, as it usually happens on Twitter.
1516 Results
Figure 3.2: Tweets per day in the English dataset
The polarity of the tweets is mostly neutral, followed by positive tweets and negative
tweets. By putting this metric together with the topics, we will be able to understand
public opinion further.
Figure 3.3: Polarity of the tweets per day.3.1 English dataset 17
The sixth topic model lays the following topics:
# 10 most used words
1 day love thank family share watch friends great video go
2 patients vaccine use drug disease study treatment treat symptoms may
3 county deaths report confirm total positive number death first department
4 gov governor order watch brief press response conference emergency house
5 school due cancel close students 2020 march concern events postpone
6 join discuss dr. webinar register impact talk question watch tomorrow
7 president government response would lie call china think right americans
8 positive patients hospital care die nurse symptoms release patient center
9 stay social distance safe keep care important protect please learn
10 information please resources check latest read use share visit free
11 mask hand wear wash face use buy paper water clean
12 go think would covid really come want back right good
13 close open order park store due city service restaurants food
14 china outbreak travel ship quarantine wuhan cruise italy flight report
15 support fund donate response community relief food crisis thank impact
16 workers thank care fight nurse medical healthcare line staff front
17 market impact global crisis economic world change economy company business
18 pay bill relief workers fund due businesses tax small care
19 number days weeks data could may still curve show would
20 deaths death flu rate die number million report infect toll
Table 3.1: List of topics obtained after applying LDA in the English dataset
It seems that for most of the topics, the polarity follows the same trend as in the
previous chart, most of the tweets are neutral, followed by positive and then negative
tweets, but somehow topic 7, 12 and 20 manage to disrupt the trends mentioned above
by spiking on negative polarity in some days. In the positive polarity spectrum, topics 4,
14, 16 and 18 also manage to increase the positive polarity, especially at the beginning of
March and by the end of April.
3.1.1. Topic 1
Topic 1 is not directly related to any specific events, but it evolves throughout the anal-
ysed time frame. If we check the existing tweets for the most active day, the 21st of
March, tweets like the one below show that people react to the progression of the pan-
demic, some of them are related to a country’s evolution, i.e. 512 tweets (15% of the total
number of tweets that day) are associated with Italy, but 434 (84.75%) tweets are identi-
cal, sharing support messages for Italy with the hashtag #WeStandWithItaly. It would be
sensible to consider this topic is similar to an "Other" category because it has the same
activity progression as the whole dataset, and there are no specific reactions to events.
We stand by Italy during these trying times. Share your Support for our Ital-
ian friends, They are our colleagues, friends and family. Cari amici, siamo con
voi. #COVID19 #WeStandWithItaly
— Cartney gmcc) March 21, 2020
Birthday celebrations #Covid_19 style - isolation doesn’t have to be isolated.
pic.twitter.com/iFCLEMr3i2
— Emily Khan (@EmilyKhan11) March 21, 202018 Results
3.1.2. Topic 2
Regarding topic 2, the first significant upward trend was on the 27th of February. During
those days GILEAD announced it would start two late-stage studies to test remdesivir,
a drug for coronavirus. They also announced the expansion of the drug trials to other
countries in Asia.
Gilead to Expand Coronavirus Drug Trials to Other Countries
The drug maker said that in March it would begin two more clinical trials of
remdesivir, an experimental antiviral drug, in more nations outside China.
The NY Times - Denise Grady
Gilead starts two late-stage studies to test drug for coronavirus
Gilead Sciences Inc (GILD.O) said on Wednesday it has started two late-stage stud-
ies to test its drug in patients with severe and moderate cases of the illness caused
by the coronavirus, sending its shares up 4% in extended trading.
REUTERS - Stephen Lam
On the 29th of April, there’s a global peak on the trend, coinciding with the news re-
lease from the NIH stating that Remdesivir accelerated recoveries from advanced COVID-
19 1 . The WHO also released a statement a few days before, launching an initiative to
share drugs, tests and vaccines 2
3.1.3. Topic 3
In topic three it’s clear that people react to local events on social media: on Saturday
29th of February, the first death from COVID-19 in the US was confirmed in the state of
Washington 3 . The global peak is on the 28th of March, and on that day, there are 700 out
of 1580 tweets (44.3%) that mention the word "death". There were 104686 cases and 1707
deaths, and it was the first death of an infant 4 .
3.1.4. Topic 4
The fourth topic is closely related to the government press briefings, so it "reacts" to the
press briefings during the analysed period. The White House released COVID-related
statements starting from late February 5 and the surges on the chart match with the re-
lease date of such information. If tweet samples are extracted, it can be seen that the
White House may not always be the source of information referenced, but other local
authorities:
WATCH LIVE: @GovHawaii and Hawai’i Department of Health officials dis-
cuss the #coronavirus outbreak https://t.co/3KPkjAAgOF #hinews #hawaii
pic.twitter.com/EH3XYZFoy0
— Star-Advertiser (@StarAdvertiser) February 27, 2020
1 https://www.nih.gov/news-events/news-releases/nih-clinical-trial-shows-remdesivir-accelerates-
recovery-advanced-covid-19
2 https://www.who.int/news-room/detail/24-04-2020-global-leaders-unite-to-ensure-everyone-
everywhere-can-access-new-vaccines-tests-and-treatments-for-covid-19
3 https://www.governor.wa.gov/news-media/inslee-statement-death-washington-state-covid-19
4 http://dph.illinois.gov/news/public-health-officials-announce-first-death-infant-coronavirus-disease
5 https://www.whitehouse.gov/briefings-statements/page/$29$/?issue ilter = healthcare
f3.1 English dataset 19
.@GovLarryHogan holds a press conference to provide an update on Mary-
land’s preparedness for COVID-19. https://t.co/ZiEHkTpsSL
— Maryland Department of Health (@MDHealthDept) February 27, 2020
3.1.5. Topic 5
The charts show a rise of interest in the topics when relevant news are released; for ex-
ample, topic 5’s interest grows abruptly on the 12th of March 2020. This sudden surge of
interest can be understood from the news published on that day:
Millions of U.S. students now affected by school closings related to the coron-
avirus outbreak
The number of K-12 students in the United States whose schools have closed or are
scheduled to shutter because of the spread of the novel coronavirus has surpassed
3.5 million — and more are expected. ...
Washington Post - Valerie Strauss
NBA suspends season until further notice after player tests positive for the coro-
navirus
The NBA is suspending game play following the conclusion of [Wednesday’s]
schedule of games until further notice,” the league said in a statement issued
shortly after 9:30 p.m. ET. "The NBA will use this hiatus to determine next steps
for moving forward in regard to the coronavirus pandemic.
ESPN News
Disney World, Disneyland Paris Resort to close over coronavirus concerns
Due to concerns over the coronavirus outbreak, Walt Disney World Resort in
Florida and Disneyland Paris Resort will close at the end of the business day Sun-
day through the end of the month, the company said in a statement tonight.
CNN - Frank Pallotta
Schools and theme parks were being closed, events were being postponed or sus-
pended, and it seems that the 12th of March was the day that the public was most con-
cerned about school closures and event cancellations, with over 5000 tweets during that
day related to topic 5.
3.1.6. Topic 6
When the pandemic starts, webinars to share information related to COVID-19 become
popular, as it is an easy and free way to share information fast and make it available to
everyone, this is reflected in topic 6. This tool was being used even by the CDC 6 (Cen-
ters for Disease Control and Prevention) to communicate technical knowledge among the
members of the medical community. The primary use of these webinars and online meet-
ings was targeted to citizens, as local communities, experts and members of the academia
organised such events to share information among the population. As it can be seen in
figure 3.2, the tweeting activities drops in the weekends and resumes on Mondays.
6 https://emergency.cdc.gov/coca/calls/2020/callinfo_032720.asp20 Results
Questions or concerns about #Coronavirus? UK HealthCare and @univer-
sityofky experts are weighing in live on YouTube. Watch: https://t.co/
ASkgPM4z9T
— UK HealthCare (@UK_HealthCare) February 27, 2020
Join us TOMORROW (April 29) @ 2pm ET for a #COVID19 briefing w/ @CDC,
@HopkinsMedicine & @UCDavis. Learn why people w/ chronic conditions
are at higher risk for COVID-19 complications. Excited to co-host this webi-
nar w/ @GHLForg & @ChronicCarePA. Register: https://t.co/rkFyzVnqx6
pic.twitter.com/Cauil2r4fg
— Allergy & Asthma Network (@AllergyAsthmaHQ) April 28, 2020
Excited to have one more community call for the day, join me at 6pm to talk
about #COVID19. Thank you to the coalition member’s of @bciitybaltimore
@noboundaries21217 @architectsofjustice @learnwithryan for inviting me to
talk. #coronavirusbalt #keepyourdistance #stayhomeheros pic.twitter.com/QIUhFrbtLb
— Letitia Dzirasa, MD (@DrTishCommish) April 29, 2020
Lee Kelso, host of WOWO’s Health Call Live Saturdays from 9-10 a.m., joins
to discuss changes at the Matthew 25 Clinic due to COVID-19 and dental hy-
gienists are the career most at risk for COVID-19 https://t.co/mUQQR7QQbj
— Pat Miller (@WOWOpatmiller) May 7, 2020
3.1.7. Topic 7
In topic 7, the most active day is the 29th of February with a trend disruption on the
polarity of the tweets, being negative tweets more frequent than positive ones. That same
day, President Trump said at a rally "The Democrats are politicising the coronavirus".
That same day, a Presidential Document by the Executive Office 7 is issued suspending
the entry of other countries than those already stated in the Proclamation issued on the
31st of January.
Coronavirus: Trump calls criticism Democrat ’hoax’
US President Donald Trump has called criticism from Democrats over his reaction
to the global coronavirus outbreak as a "hoax".
BBC News
3.1.8. Topic 8
The amount of positives each day increases as time passes and on the 17th of March the
positive cases detected in one day climb to 4,450, that makes topic 8 reach its tipping
point, as government officials react and implement measures that encourage citizens to
stay at home.
7 https://www.federalregister.gov/documents/2020/03/04/2020-04595/suspension-of-entry-as-
immigrants-and-nonimmigrants-of-certain-additional-persons-who-pose-a-risk-of3.1 English dataset 21
U.S. Health Departments Report Largest Number Of Deaths In One Day As
Total Confirmed Cases Climb To 4,450
Experts say there’s likely far more unreported cases because of failures to properly
test potential patients. On Monday, 18 people died from the virus bringing the
nation’s total deaths to 85 so far.
KHN
These States Have Some Of The Most Drastic Restrictions To Combat The
Spread Of Coronavirus
US coronavirus cases have now surpassed 4,475 and some officials say the US
could end up with a count as high as hard-hit Italy if it doesn’t make dramatic
changes to the way Americans live, work and play. Governors and city leaders
have begun implementing measures to encourage residents to stay home or skip
nights out, in an effort to curb the spread of the virus.
CNN - Christina Maxouris
3.1.9. Topic 9
On the 16th of March 2020, the CDC 8 9 recommends not to assist to gatherings of more
than fifty people in any events during the eight weeks after that day. During that day, in
topic 9 words like safe (17.70%), stay, social (16.02%), keep (9.16%), and care (8.67%) are
often used in the tweets. During the previous days to the CDC statement, the US banned
all travel from EU countries to the US 10 .
3.1.10. Topic 10
The tenth topic is similar to the sixth in the sense that it is also intended for sharing
information regarding the pandemic. They both have a similar progression, and in topic
ten the word information (17.36%) is often used together with words like "read" (10.63%)
and "resources" (8.18%). This topic does not have a specific catalyst, as it evolves with the
progress of the pandemic and it follows the same trends in the weekends as in figure 3.2.
3.1.11. Topic 11
At the beginning of the pandemic, there was a psychological reaction from the population
to stockpile toilet paper, on the 6th of March, many supermarkets across Australia had
their shelves in the toilet paper section, empty. This compulsive reaction from the citizens
echoed on social media, as it can be seen on chart 3.7k of topic 11.
8 Unfortunately the CDC page with said recommendations is no longer the original page since it has been
updated with more recent information throughout the pandemic. Although, many newspapers state-wide
and locally echoed these recommendations on their daily issues
9 https://www.cdc.gov/coronavirus/2019-ncov/community/large-events/considerations-for-events-
gatherings.html
10 https://www.whitehouse.gov/presidential-actions/proclamation-suspension-entry-immigrants-
nonimmigrants-certain-additional-persons-pose-risk-transmitting-2019-novel-coronavirus/22 Results
’It’s crazy’: Panic buying forces stores to limit purchases of toilet paper and
masks
... Some retailers are having to take drastic action to limit the number of toilet pa-
per rolls, face masks and hand sanitizer bottles each person can buy as customers
stockpile goods over fears of the novel coronavirus outbreak. ... Australian super-
market chains Woolworths and Coles both began limiting toilet paper purchases
to four packs per person this week. Costco Australia is also restricting how much
toilet tissue, disinfectant, milk, eggs and rice each customer can buy.
CNN - Michelle Toh
3.1.12. Topic 12
On the 29th of February, coinciding with the surge of activity in figure ?? and ??, Trump
dismissed the concerns about COVID-19 by qualifying it as a hoax during one of his
rallies. The following day, there was the first death from COVID-19 in the US.
During the other days in the period, users share general thoughts of the current situ-
ation and comment on the progress of the pandemic and the measures applied.
"I just want people to be able to take a breath..." @saintlukeskc Dr. Marc
Larsen talks symptoms with Coronavirus. #COVID19 "If you wouldn’t have
gone to the hospital six months ago with these symptoms, you probably don’t
need to go to the hospital today." @kmbc pic.twitter.com/ui6zkTBikj
— Matt Flener KMBC (@MattFlenerKMBC) March 12, 2020
Netflix and chill will go back to its original meaning during all this #COVID19
— Popeye the Taylor (@Taylor_Errthang) March 12, 2020
(inf) Note: In figures 3.4b and 3.4c, the word "coronavirus" is part of a hashtag, the
full hashtag is "coronaviruspandemic".3.1 English dataset 23
Word Count Word Count Word Count
coronavirus 2572 coronavirus 1816 covid 2008
covid 1025 covid 1762 19 1945
19 950 19 1726 covid_19 1364
covid19 876 covid_19 1401 coronavirus 1263
peopl 572 covid19 957 covid19 1082
go 563 go 798 peopl 801
get 543 get 781 get 722
trump 503 peopl 654 go 703
hoax 377 like 517 like 484
like 373 coronavirusin f 516 time 454
u 369 test 451 u 419
think 349 time 410 need 417
viru 326 one 381 test 398
know 310 think 376 think 390
say 277 u 370 work 385
one 269 know 358 coronavirusin f 382
realdonaldtrump 255 thing 355 one 381
would 241 need 345 day 368
coronaviru 236 work 341 know 364
die 218 would 325 home 353
(a) 29th of February (b) 12th of March (c) 21st of March
Figure 3.4: Top 20 words in topic 12
3.1.13. Topic 13
Because of the recommendations from the CDC regarding gatherings and the evolution
of the pandemic, some states decided to close bars and restaurants 11 and that is reflected
on topic 13 in the sudden surge of tweets on that day.
3.1.14. Topic 14
On the 26th of February, in topic 14, the tweeting activity peak is on that day, words like
outbreak and travel are present in 30.4% of the tweets. It was the first day that there were
more new cases outside of China than from China as stated by the WHO 12 . On that same
day, Italy reported a surge of 40% new more cases, from 22913 to 322.
3.1.15. Topic 15
Topic 15 peaks on the 5th of May, with over a thousand tweets mentioning the word
"support" and almost nine-hundred tweets referring to donations, a total of 1,660 tweets
out of 2,851 use either of these words. PEW Research published a study14 regarding the
11 https://www.scrla.org/news/493793/National-Restaurant-Association-Coronavirus-Update—
March-16-2020.htm
12 https://www.who.int/docs/default-source/coronaviruse/situation-reports/20200226-sitrep-37-
covid-19.pdf?sfvrsn=2146841e2
13 https://www.who.int/docs/default-source/coronaviruse/situation-reports/20200225-sitrep-36-
covid-19.pdf
14 https://www.pewresearch.org/fact-tank/2020/05/05/financial-and-health-impacts-of-covid-19-
vary-widely-by-race-and-ethnicity/24 Results
financial and health impacts of COVID-19 and how they impact differently depending
on race and ethnicity. This study, would help to understand the evolution of this topic, as
it explains that many black and Hispanic have had wage losses or do not have financial
reserves to cover expenses in case of an emergency.
3.1.16. Topic 16
On the 6th of April, Boris Johnson was moved to intensive care15 and in topic 16, around
40% of the tweets on that day mentioned the Prime Minister.
3.1.17. Topic 17
Since the 5th of February of 2018, the Dow had not had a single-day decline as large as
the one on the 28th of February16 , 1,190.95 points. But April was the best month since
1987 for the S&P 500, with a 12.7% change. These two highlights are reflected in topic
17’s chart, as can be seen in figure 3.7q.
3.1.18. Topic 18
On the 25th of March, there is a peak in topic 18. The US Senate passed the CAREs Act17 ,
a $2.2 trillion economic stimulus aimed at helping Americans with one-time payments,
increased unemployment benefits, forgivable loans for small businesses, large companies
and state and local governments.
3.1.19. Topic 19
In this topic, people share the progress of the pandemic and COVID-related information
regarding the number of cases and positives. Figures 3.5a, 3.5b and 3.5c show words like
"test", "case", "people" or "number".
1/3. The exponential increase in COVID-19 cases in the United States over
the last few days makes the next two weeks an important opportunity for
Americans to slow the spread of disease. pic.twitter.com/vyYyoNdvhm
— Roman (@Roman) March 18, 2020
Last week, Georgia became the first state to partially re-open. Guess what?
Positive COVID-19 tests are skyrocketing.
They’re going to call this a "second wave" in order to remove human agency.
Remember: this didn’t have to happen.https://t.co/il3IRK5gUF
— Michael Socolow (@MichaelSocolow) May 1, 2020
15 https://www.bbc.com/news/uk-52192604
16 https://www.nasdaq.com/articles/stock-market-news-for-feb-28-2020-2020-02-28
17 https://en.wikipedia.org/wiki/CARES_Act3.1 English dataset 25
Word Count Word Count Word Count
covid19 406 covid19 436 covid 633
covid 387 covid 418 19 604
19 374 19 404 covid19 485
coronavirus 315 coronavirus 290 test 256
test 245 test 266 coronavirus 253
case 143 case 215 case 168
peopl 121 day 131 say 165
day 115 peopl 116 day 152
u 113 u 107 week 138
need 85 say 106 peopl 131
like 84 number 103 new 118
week 82 week 96 data 110
spread 80 new 94 lockdown 109
say 77 need 89 number 107
get 76 could 85 state 102
take 70 state 84 death 101
number 67 spread 81 u 100
new 64 get 81 peak 95
time 60 like 80 work 89
coronaviru 59 go 78 still 83
(a) 18th of March (b) 25th of March (c) 15th of April
Figure 3.5: Top 20 words in topic 19
3.1.20. Topic 20
From the beginning of the pandemic, many people wondered why COVID-19 was de-
clared a pandemic if influenza usually kills up to 61,000 people in the US alone.18 As the
pandemic evolves, people start to be more concerned about the death tolls and positive
cases. Words like "flu", "rate", "infect", "die" or "million" are more frequent in figure 3.6a,
whereas in figure 3.6b, "number", "china", "world", "confirm" or "surpass" are among the
most used.
#2 We as Americans should worry more about influenza than #coronavirus.
Also: It’s not too late to get a flu shot!
Last year’s flu season there were 16.5M hospital visits, half a million hos-
pitalizations and ~34,000 deaths.
That was a typical year. This year could be worse.
— Jonathan Frederick (@jonmikefred) February 6, 2020
Global COVID-19 Update from Johns Hopkins:
1,002,159 cases
188,420 recovered
51,484 deaths
18 https://www.cdc.gov/flu/about/burden/index.html26 Results
Since I started composing this tweet, the numbers have gone up.
God help us.
— #FreeRealityWinner (@NickLaparra) April 2, 2020
#UK will have Europe’s worst #coronavirus death toll, study predicts, ac-
counting for more than 40% of total deaths across Europe
Germany is testing about 6,000 of every million, three times the rate in the
U.K
"Our key message is test, test, test" - @WHOhttps://t.co/9hqLA0rhWc pic.twitter.com/lNo8VQyB1u
— Hastings & Rye Labour Party #blackouttuesday (@HastingsRyeLab) April
7, 2020
Word Count Word Count
covid 342 case 1018
19 340 covid 738
coronavirus 249 19 705
case 204 u 553
peopl 204 coronavirus 530
death 196 number 470
flu 187 covid19 469
covid19 171 china 455
rate 147 death 387
000 127 world 322
infect 111 000 299
1 106 1 297
2 100 confirm 288
u 95 peopl 246
number 94 surpass 232
million 88 itali 231
die 87 report 214
test 79 countri 191
day 76 rate 190
mortal 76 usa 188
(a) 14th of March (b) 26th of March
Figure 3.6: Top 20 words in topic 20You can also read