The Urban Food System of Nairobi, Kenya - HUNGRY CITIES PARTNERSHIP - HUNGRY CITIES REPORT NO. 6 - university of nairobi staff ...
←
→
Page content transcription
If your browser does not render page correctly, please read the page content below
HUNGRY CITIES PARTNERSHIP

The Urban Food System of
     Nairobi, Kenya

     HUNGRY CITIES REPORT NO. 6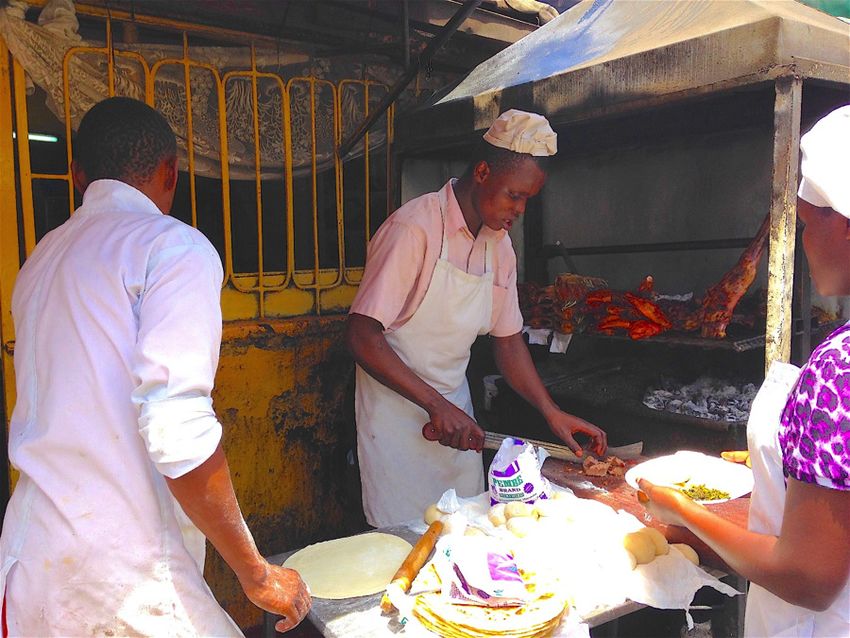
HUNGRY CITIES PARTNERSHIP

 THE URBAN FOOD SYSTEM
   OF NAIROBI, KENYA

SAMUEL OWUOR, ANDREA BROWN, JONATHAN
CRUSH, BRUCE FRAYNE AND JEREMY WAGNER

  SERIES EDITOR: PROF. JONATHAN CRUSH

     HUNGRY CITIES REPORT NO. 6
ACKNOWLEDGEMENTS
The research and publication of this report was funded by the Social
Sciences and Humanities Research Council (SSHRC) and the Interna-
tional Development Research Centre (IDRC) under the International
Partnerships for Sustainable Societies (IPaSS) Program.

© HUNGRY CITIES PARTNERSHIP 2017

Published by the Hungry Cities Partnership
African Centre for Cities, University of Cape Town, South Africa,
and Wilfrid Laurier University/Balsillie School of International Affairs,
Waterloo, Canada
hungrycities.net

First published 2017

ISBN 978-1-920597-27-6

Production by Bronwen Dachs Muller, Cape Town

All rights reserved. No part of this publication may be reproduced or
transmitted, in any form or by any means, without prior permission from
the publishers.
AUTHORS
Samuel Owuor is Senior Lecturer at the Department of Geography and Envi-
ronmental Studies, University of Nairobi, Kenya.

Andrea Brown is Associate Professor of Political Science at Wilfrid Laurier
University, Waterloo, Ontario, Canada.

Jonathan Crush is CIGI Chair in Global Migration and Development, Inter-
national Migration Research Centre, Balsillie School of International Affairs,
Waterloo.

Bruce Frayne is Director and Associate Professor in the School of Environment,
Enterprise and Development, University of Waterloo.

Jeremy Wagner is Research Fellow at the Balsillie School of International
Affairs, Waterloo.

Previous Publications in the Hungry Cities Report Series

No 1   The Urban Food System of Nanjing, China
No 2   The Urban Food System of Maputo, Mozambique
No 3   The Urban Food System of Cape Town, South Africa
No 4   The Urban Food System of Kingston, Jamaica
No 5   The Urban Food System of Bangalore, India
CONTENTS                                       PAGE
1. City Background                                1
   1.1 The Colonial City                          2
   1.2 The Post-Independence City                 4
   1.3 The Modern City                            5
2. Demography                                     7
3. Land Use and Population Distribution          11
   3.1 Land Use                                  11
   3.2 Population Density                        12
   3.3 Informal Slum Settlements                 14
4. The Formal Economy                            17
   4.1 Economic Activity                         17
   4.2 Employment and Unemployment               18
5. Informal Economy                              20
   5.1 Size and Character                        20
   5.2 Informal Sector Policies                  24
6. Poverty, Income and Services                  25
   6.1 Distribution of Income                    25
   6.2 Living Conditions in Slums                26
   6.3 Education                                 28
7. Urban Food System                             29
   7.1 Food Supply                               29
   7.2 Food Distribution                         30
   7.3 Food Processing                           38
   7.4 Formal Food Retail                        38
   7.5 Informal Food Sector                      44
   7.6 Urban Agriculture                         48
8. Urban Food Security                           52
   8.1 Levels and Drivers of Food Insecurity     52
   8.2 Food Price Increases                      58
   8.3 Food and Social Protection                58
9. Conclusion                                    60
References                                       60
LIST OF TABLES
Table 1: Population Growth Rate and Projections for Kenya, 1950-2090   7
Table 2: Intercensal Growth Rates by Region in Kenya                   8
Table 3: Trends in Recent Migration by Province, 1999-2009             10
Table 4: Migrant Population in Korogocho and Viwandani, 2006           10
Table 5: Areas of Land Use/Cover Types for Nairobi, 1976-2000          12
Table 6: Population Density by Residential Area, 2006                  12
Table 7: Settlements and Tenure Status                                 14
Table 8: Key Indicators in Kenya’s Labour Force                        18
Table 9: Income Generating Activity of Adult Population, 2009          20
Table 10: Types of Informal Sector Retail Activity                     22
Table 11: Types of Household Microenterprise in Nairobi                23
Table 12: School Attendance in Nairobi by Location and Gender, 2006    28
Table 13: Fresh Produce Market Share of Retail Outlets                 39
Table 14: Experience of Food Insecurity by Households With and         50
          Without Sack Gardens
Table 15: Comparison of Household Monthly Total and Food               54
          Expenditures, 2009

LIST OF FIGURES
Figure 1: Location of Nairobi                                          2
Figure 2: The Nairobi Central Business District                        6
Figure 3: Percentage of Population at Mid-Decade in Urban Areas,       8
          1950-2050
Figure 4: Population Pyramid of Kenya, Nairobi and Nairobi Slums       9
Figure 5: Nairobi Land Use Map, 2010                                   11
Figure 6: Population Density in Nairobi                                13
Figure 7: Residential Housing Density in Nairobi                       13
Figure 8: Location of Slum Settlements                                 15
Figure 9: Kibera Slum in Nairobi                                       15
Figure 10: Housing in Mathare Valley                                   16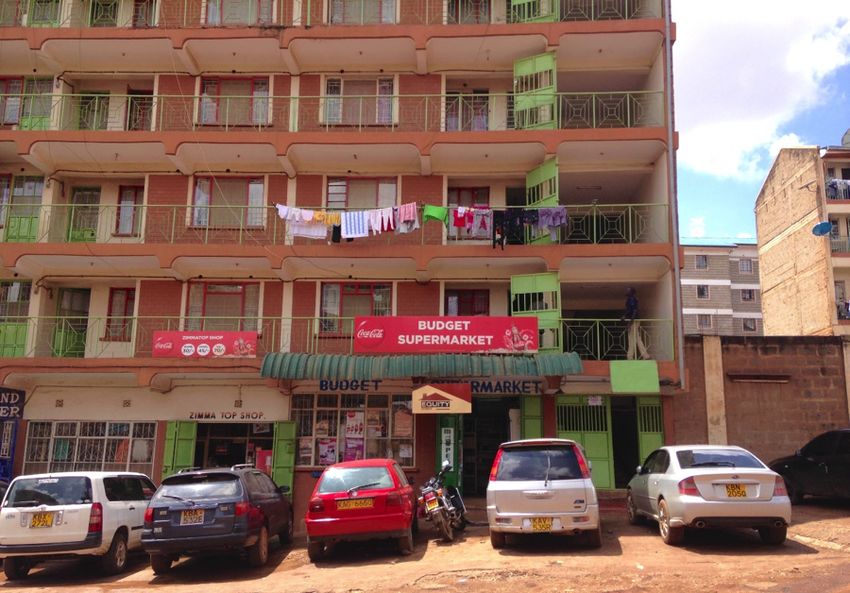
Figure 11: Spatial Distribution of Income 26
Figure 12: Refuse in Drainage Channel in Slum Area 27
Figure 13: Kenyan Wheat Production and Imports, 1961-2009 30
Figure 14: Fresh Produce Supply Chain in Kenya 31
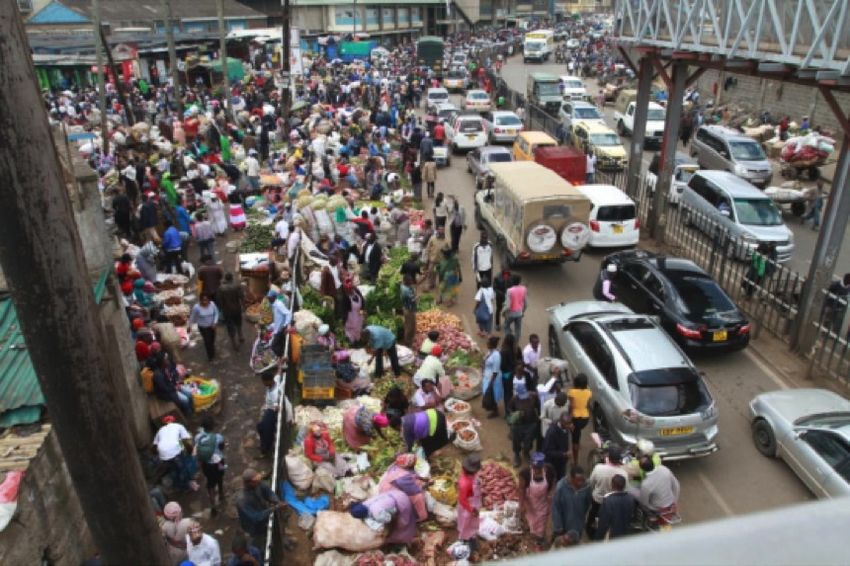
Figure 15: Wakulima Market 32
Figure 16: Transportation Truck at Wakulima Market 32
Figure 17: Location of Retail Markets in Nairobi 33
Figure 18: Satellite Image of Wakulima Market 34
Figure 19: Hand Cart Used for Intra-Urban Food Transport 35
Figure 20: Location of Meat Markets and Abattoirs 36
Figure 21: Flowchart of Meat Products to Nairobi Consumers 37
Figure 22: Nairobi Meat Retail Market 37
Figure 23: Growth of Top Five Supermarket Chains in Kenya, 1975-2003 39
Figure 24: Major Supermarket Chains in Kenya, 2017 40
Figure 25: Production and Marketing Margins in Kale Supply Chains 41
Figure 26: Nakumatt Supermarket in Nairobi 42
Figure 27: Uchumi Supermarket in Nairobi 42
Figure 28: Small Food Retail Outlet in Nairobi 43
Figure 29: Family-Owned Supermarket in Nairobi 44
Figure 30: Food Types Sold by Informal Vendors in Mathare, Mukuru 45
and Kibera
Figure 31: Location of Food Vendors in Kibera 45
Figure 32: Cooked Food Street Vendor 46
Figure 33: Roadside Food Vendors 47
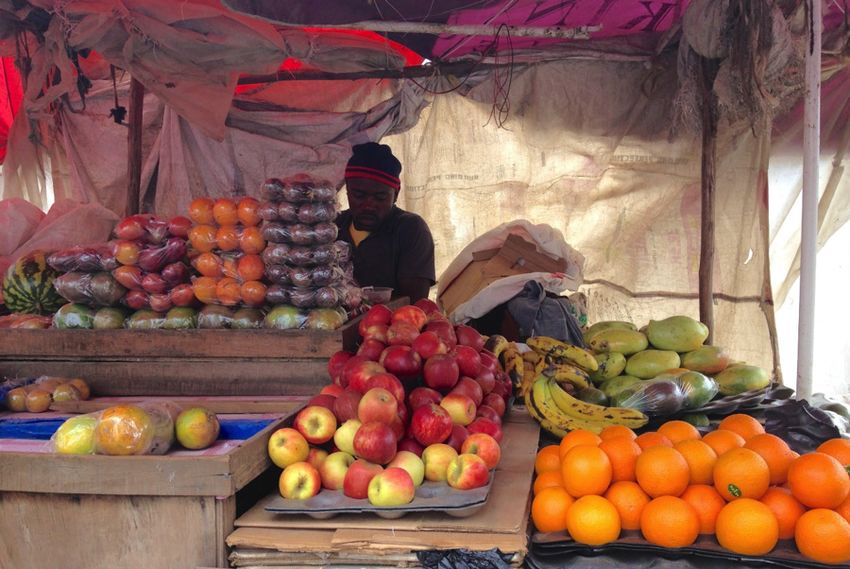
Figure 34: Informal Fruit Vendor 47
Figure 35: Urban Farm in Makadara, Nairobi 49
Figure 36: Rabbit Cages in Makadara, Nairobi 49
Figure 37: Prevalence of Severe and Moderate Malnutrition 53
Figure 38: Prevalence of Wasting by Age and Sex 53
Figure 39: Household Food Security and Education 55
Figure 40: Household Responses to Food Insecurity 56
Figure 41: Distribution of Household Food Insecurity within Korogocho 57
Figure 42: Household Food Security at Beginning and End of Intervention 60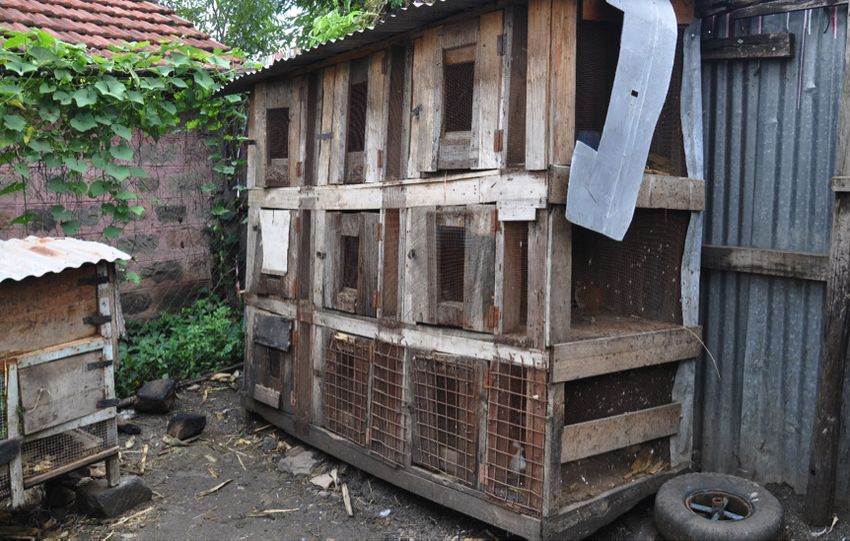
HUNGRY CITIES REPORT NO. 6                                                          1

1. CITY BACKGROUND
Nairobi is a city of stark contrasts. Nearly half a million of its three million resi-
dents live in abject poverty in some of Africa’s largest slums, yet the Kenyan
capital is also an international and regional hub boasting an array of embassies,
donor organizations and a UN complex in the exclusive residential estate of
Gigiri, which is surrounded by high-income suburbs. However, the drama of an
under-resourced and poorly managed city reaches into these pockets of wealth
and apparent calm. Water, power and telecommunications infrastructure is frag-
mented and unreliable, and private security companies provide the only buffer
between the elite and pervasive violent crime. In Nairobi, the urbanization of
poverty is a rapid and ongoing process. At the same time, economic and policy
reform is also prominent, suggesting the potential for a more prosperous and
sustainable future (APHRC 2014, KNBS 2012c, UN-Habitat 2016).

Nairobi has never been the orderly, planned city envisaged in the colonial Mas-
ter Plan of 1948 and, while the issues facing the contemporary city are of a much
larger scale and of greater complexity than those of the past, it continues its
struggle to develop a positive urban system and living environment for all, and
especially the urban poor (Jaffer 2013, UN-Habitat 2016). Nairobi has had three
eras of development which have all left their imprint on the city today. First,
there is the early development of Nairobi under British colonial rule (1899-
1962). Second, there is the post-independence period from 1963 to 1999 when
Nairobi was growing rapidly and the government was attempting to dismantle
the spatial inequities associated with the racial segregation and discrimination
that had characterized the colonial period. The final period is that of the modern
city, from 2000 to the present. This is the era in which Nairobi has become a
truly global African city, and also in which the institutional failures of the past
are reflected in the ongoing inability of the state to cope with the city’s increas-
ing challenges.
2                                                         HUNGRY CITIES PARTNERSHIP

   FIGURE 1: Location of Nairobi

   Source: http://www.nationsonline.org/maps/kenya_map.jpg

   1.1 The Colonial City
   The building of the Uganda Railway in the late 19th century, linking the Indian
   Ocean with the interior, brought a need for a halfway house for workers, ware-
   housing and food supplies. By 1899 the railhead had reached the service post of
   present-day Nairobi, some 530 kilometres from the port of Mombasa. Nairobi
   was little more than an informal settlement, comprising 11,500 people in 1906
   (UN-Habitat 2006a). Nonetheless, with the railway line reaching Kisumu on
   Lake Victoria (at that time part of Uganda), the British needed a suitable admin-
   istrative centre in the region. Being on the new railway line, free of malaria, with
   a mild climate and adequate water, and flat land for railway sidings and tracks,
   Nairobi was made the capital of British East Africa by the colonial administration

THE URBAN FOOD SYSTEM OF NAIROBI, KENYA
HUNGRY CITIES REPORT NO. 6                                                       3

(Furedi 1973). The railway company also moved its headquarters from Mombasa
to Nairobi, spurring the growth of Nairobi as a commercial and business hub of
the British East Africa protectorate (Aligula et al 2005a).

Nairobi was a racially segregated settlement from the start, with more than 100
ordinances that distinguished the legal domain in racial terms and a strong social
colour bar that pervaded all aspects of life. Africans, Asians and Europeans made
up the dominant race groups, living in separate residential areas. The colonial
system and nomenclature prevailed, with Africans providing their own housing
in “native locations.” Despite the introduction of the Town Planning Ordinance
of 1931, Africans lived in largely informal conditions within the native locations,
while inadequate land allocation for Africans in general resulted in an ongo-
ing spill-over into squatter settlements on undesignated land (Furedi 1973). The
government was unable to enforce the laws that controlled African settlement
in urban areas, although the low wage levels ensured that workers could only
afford single-room accommodation in the locations (designed for single, male
migrants), pushing families and the landless beyond the urban boundary. It was
only as a result of labour strikes in Mombasa in 1939 that the colonial govern-
ment reviewed its policies on urban affairs, and by 1940 the government had
begun providing housing for Africans within the city. This coincided with the
increase in employment opportunities for women, largely to meet the growing
demand for domestic workers in colonial homes, and after 1952 women consti-
tuted an important part of the Nairobi African labour force (Furedi 1973).

By the late 1940s, Nairobi’s poorly managed growth was described as “still a
jumble, the visitor’s main impression that of a minor Bombay” (Huxley 1948).
The British desire for social and spatial order led to a formal town plan through
the commissioning of the First Nairobi Master Plan of 1948 (Charton 2005).
This plan was comprehensive and included coverage of a wide variety of land
uses associated with British and American town planning approaches and sys-
tems of development control. As noted by Huxley (1948), the new Master Plan
catered for well-to-do Europeans; resident Asians at all income levels; and for a
largely single male African labour force of transient migrants, who were assumed
to have their real homes elsewhere.

Nairobi continued to develop within the framework of the Master Plan, which
had been designed to accommodate a quarter of a million people by 1963. By
1962, one year before independence from Britain, Nairobi’s population was
approximately 267,000 (Nairobi City Council 2008, UN-Habitat 2006a).
Racial segregation continued to favour Europeans and Asians over Africans, and
the city had the social, economic and physical duality typical of colonial cities
(Jaffer 2013).
4                                                      HUNGRY CITIES PARTNERSHIP

   1.2 The Post-Independence City
   Immediately after Kenyan independence from Britain in 1963, Nairobi moved
   to revise the urban planning system to ensure that the city played a central role
   in achieving the government’s non-racial national development priorities. Urban
   and regional planning systems for Kenya as a whole were developed as comple-
   mentary policy vehicles for achieving national planning goals (Aligula et al 2005b).
   The period 1963-1975 was the “era of the structure plan as a means of spatially
   guiding development” (Aligula et al 2005b) and a time of enhanced agricultural
   productivity, poverty alleviation and industrial and economic development. The
   dismantling of urban influx controls and racial labour laws, together with sig-
   nificant economic growth, resulted in rapid urbanization. Nairobi’s population
   grew from some 270,000 in 1963 to more than two million in 1999 (NCC 2008;
   UN-Habitat 2006a). The period also saw the increased in-migration of women
   to the city and the normalization of sex ratio for the first time in the history of
   Nairobi (Muwonge 1980).

   In 1968, the Government of Kenya passed the Land Planning Act, which was
   a re-enactment and amendment of the Development and Use of Land (Plan-
   ning) Regulations of 1964, with the object of controlling urban land use and
   development. Within this framework, between 1968 and 1973 a long-term plan
   was devised for Nairobi, culminating in the 1973 Nairobi Metropolitan Growth
   Strategy. However, this strategy was poorly implemented and did little to address
   the needs of the burgeoning poor urban population. During the first decade
   after independence, employment grew at about 3% per year, which represented
   approximately 42,000 new jobs. However, the labour force during these years
   grew at a rate of some 9%, which translated into 172,000 new job seekers. By
   1974, the unemployment rate was 44% (House 1984), indicating that high levels
   of unemployment are not unique to contemporary Nairobi. Although the infor-
   mal sector grew in response to rising unemployment, the Nairobi City Council
   did not support this unregulated dimension of the economy, with a consequent
   lack of services and infrastructure that constrained this entrepreneurial sector’s
   economic development, particularly in the slums.

   Official government policy in the post-independence era was to demolish
   informal settlements in the face of a failure to provide adequate housing for the
   growing urban population, most of whom had no means of obtaining housing
   (UN-Habitat 2016, Weru 2004). The main reason for this failure to deliver was
   wholesale political interference in planning with the result that the “development
   control machinery virtually collapsed” (Aligula et al 2005b). As an attempted
   remedy, the Local Authority Development Programme was introduced in 1982
   to draw out implementable investment programmes in line with national devel-
   opment goals. However, this did nothing to address the ongoing failure of the
   town planning system and little was achieved with the 1984-1988 Nairobi City

THE URBAN FOOD SYSTEM OF NAIROBI, KENYA
HUNGRY CITIES REPORT NO. 6                                                        5

Commission Development Plan, which outlined the development needs of all
sectors in Nairobi (Owuor and Mbatia 2012).

In the 1990s, attempts were made to implement the post-Rio Agenda 21 pri-
orities, which brought the environment into the planning machinery. A further
two laws were introduced in an attempt to address the growing development
challenges in Nairobi and other urban centres: the Physical Planning Act (1996)
and the Environmental Management and Co-ordination Act (1999). In addition,
the Local Authority Transfer Fund (1999) was developed to improve funding to
local authorities. However, despite the plethora of national and local planning
and related legislation, local authorities across the country continued to decline
in capacity and resources, and were unable to meet the demand from the urban
citizenry effectively. While the Directorate of City Planning was mandated to
co-ordinate development activities such as slum upgrading, micro-enterprises
and a range of municipal reforms, economic and physical planning was not har-
monized with land use or land taxation (UN-Habitat 2006a). A combination
of institutional and political factors resulted in a decline in economic growth,
environmental degradation, rising unemployment and poverty, insecurity and
high crime, poor education and health systems, eroded recreational opportuni-
ties, and a highly politicized and corrupt civil service at both local and national
levels (Aligula et al 2005b).

1.3 The Modern City
Since 2000, Nairobi’s functions “have developed and expanded such that today
it has achieved an overwhelming dominance in the political, social, cultural
and economic life of the people of Kenya and the whole of the Eastern African
region” (Aligula et al 2005a). Nairobi is at the centre of international diplomacy,
finance, banking and commerce because of its facilities and position on the Afri-
can continent. The city is the hub of road, rail and air transport networks, con-
necting eastern, central and southern African countries. Nairobi employs 25%
of Kenyans and 43% of urban workers in the country, generating over 45% of
Gross National Product (GNP) (KNBS 2012a, UN-Habitat 2006a). The Nai-
robi City County, created under the Constitution of Kenya 2010, replaced the
Nairobi City Council and operates principally under the Cities and Urban Areas
Act and the Devolved Governments Act (Nairobi City County 2017). The spatial
extent of the city increased to at least 3,000km2 in 2007 (Earth Institute 2008).
This growth, within the context of poor economic performance, high popula-
tion increase and limited institutional capacity, has placed significant pressure on
all sectors of the city, including the environment. Nairobi’s challenge is therefore
significant, particularly in relation to the urban poor.
6                                                           HUNGRY CITIES PARTNERSHIP

   FIGURE 2: The Nairobi Central Business District

   Source: http://panganga.com/wp-content/uploads/2014/04/editor6564565607503251782-1.jpg

   In 2007, the government unveiled the Kenya Vision 2030. Covering the period
   2008 to 2030, this national planning strategy aims at making Kenya a middle-
   income country that provides high-quality life for all its citizens (Republic of
   Kenya 2007). It includes five-year plans co-ordinated by the Ministry of Plan-
   ning and National Development and follows the Economic Recovery Strategy
   for Wealth and Employment Creation that has been in effect since 2002. The
   economic aim of the Kenya Vision 2030 is to achieve an average GDP growth
   rate of 10% per year (Republic of Kenya 2007).

   Related to the implementation of Kenya Vision 2030, and in response to the
   urbanization and development pressures on Nairobi and more broadly in Kenya,
   the government introduced the Kenya Municipal Programme in 2010, with
   responsibility for implementation falling to the Urban Development Department
   of the Ministry of Transport, Infrastructure, Housing and Urban Development.
   However, this programme has not succeeded as intended and will end in 2017.
   UN-Habitat (2016a: 1) reports that “currently, the challenges of unplanned
   urban growth, inadequate infrastructure, affordable low-cost housing, impov-
   erished informal settlements, and increasing urban poverty, among others, have
   profoundly undermined the path to sustainable urban development. In addition,
   the urban authorities are highly dysfunctional, characterised by ineffective man-
   agement and governance and low budgetary allocation for urban development.”

   In 2008, the newly created Ministry of Nairobi Metropolitan Development
   was charged with the development issues of the Nairobi Metropolitan Region.

THE URBAN FOOD SYSTEM OF NAIROBI, KENYA
HUNGRY CITIES REPORT NO. 6                                                           7

Aiming at area-wide governance interventions, it released an ambitious Nairobi
Metro 2030 as part of the Kenya Vision 2030. The Nairobi Metro 2030 aimed
to propel the city into a world-class African metropolis by creating a frame-
work for comprehensively addressing a broad range of policy areas, including the
economy, trunk and social infrastructure, transportation, slums and housing,
safety and security, and financing (Owuor and Mbatia 2012). Currently, Nairo-
bi’s growth and development is being guided by the Nairobi County Integrated
Development Plan 2014, County Annual Development Plan 2017/2018, and the
new Nairobi Integrated Urban Development Master Plan (NIUPLAN) 2014-
2030. NIUPLAN aims at providing an integrated urban development frame-
work for co-ordinated city development, as well as integrating all sectoral plans
and aligning them to Vision 2030.

2. DEMOGRAPHY
The country’s fertility rate has dropped to nearly half its 1960 rate of 7.9, with a
sustained decrease expected throughout the rest of the century (World Popula-
tion Review 2017). Kenya’s population is still growing with a national fertility
rate of 4.13 (births per woman). Replacement fertility is only expected by the
end of this century (Table 1). In addition to a fast-growing population, Kenya is
also rapidly urbanizing (Figure 3). Currently, about 30% of Kenya’s population
is urban, with an annual growth rate of 4.4%. Table 2 summarizes the intercensal
growth rate by region in Kenya. Nairobi’s population is expected to double in 16
years, and triple in 25 years. The population of Nairobi in 2009 was 3.1 million;
by 2025 it will be 6.2 million and is projected to reach approximately 10 million
by 2038 (KNBS 2010). These demographics represent a significant challenge to
Kenya and the governance of the urban economy.

TABLE 1: Population Growth Rate and Projections for Kenya, 1950-2090
Year                  Population         % Male       % Female       Growth rate %
1950                   6,076,757          50.4          49.6              2.7
1970                  11,252,466          49.9          50.1              3.5
1990                  23,446,229          49.8          50.2              3.3
2010                  40,328,312          50.0          50.0              2.7
2030                  65,411,901          49.8          50.2              2.1
2050                  95,504,636          49.7          50.3              1.6
2070                 125,137,459          49.5          50.5              1.1
2090                 148,681,346          49.4          50.6              0.6
Source: World Population Review (2017)
8                                                     HUNGRY CITIES PARTNERSHIP

   FIGURE 3: Percentage of Population at Mid-Decade in Urban Areas, 1950-
   2050

   Source: UN (2014)

   TABLE 2: Intercensal Growth Rates by Region in Kenya
     Province               1969-1979     1979-1989     1989-1999       1999-2009
     Nairobi                   4.9           4.7           4.8             3.8
     Central                   3.4           2.8           1.8             1.6
     Coast                     3.5           3.1           3.1             2.9
     Eastern                   3.6           3.3           2.1             2.0
     North Eastern             4.2          -0.1           9.5             8.8
     Nyanza                    2.2           2.8           2.3             2.1
     Rift Valley               3.8           4.2           3.4             3.6
     Western                   3.8           3.4           2.8             2.5
     Kenya                     3.4           3.4           2.9             3.0
     Source: KNBS (2010a)

   An estimated 60% of Nairobi’s population lives in slums or informal settlements
   (APHRC 2014, Rockefeller Foundation 2013). The age profile of the popula-
   tion in informal settlements varies markedly from that of Kenya, and even Nai-
   robi, as whole. First, the proportion of people over the age of 50 is lower in the
   slums than in the country and the city as a whole. Second, the general youth
   bulge of people between the ages of 20 and 35 in Nairobi is replicated in the
   informal settlements, which means that a significant proportion of young people
   are slum-dwellers (Figure 4). Nairobi attracts a youthful population in search

THE URBAN FOOD SYSTEM OF NAIROBI, KENYA
HUNGRY CITIES REPORT NO. 6 9 of economic opportunities through rural-to-urban migration, and regional and international migration. The most recent Kenyan population and housing census data, from 2009, shows that a large percentage of the youth population live in slums (APHRC 2014, KNBS 2013). Third, there is a difference in the composi- tion of the informal area population by sex. There are roughly equal numbers of male and female children, but there are more females than males in the 15-24 age group. In every age group over the age of 25, there are more men than women (UN-Habitat 2013). The city retains a female and elderly population, particularly among low-income populations. A growing number of elderly people remain in slums, with an annual out-migration rate of only 4% (Falkingham et al 2012). The complexities of Nairobi’s demographics create stress on social service programmes, especially with high levels of unemployment and dependence on precarious livelihoods. Unemployment and weak social service programmes contribute to food insecu- rity concerns. These factors are exacerbated by rapid urbanization. FIGURE 4: Population Pyramid of Kenya, Nairobi and Nairobi Slums Source: APHRC (2014)
10                                                                        HUNGRY CITIES PARTNERSHIP

   As the major economic centre within the region, Nairobi attracts internal
   migrants as well as economic migrants and refugees from outside Kenya (Arnold
   et al 2014). Table 3 shows that Nairobi is by far the largest net recipient of
   migrants in Kenya. Despite a 1990 policy that refugees and asylum seekers should
   remain in refugee camps, many refugees live in Nairobi (Campbell et al 2011).
   The UNHCR notes that in 2014 over 50,000 refugees were resident in the city,
   although the actual number could be much larger since this does not take unreg-
   istered refugees into account (UNHCR 2014). The current economic and social
   state of the country, better income-earning opportunities and access to educa-
   tion, health and other social services are the main reasons behind circular and
   international migration to Nairobi. Males show a higher out-migration rate and
   females a higher retention rate in slum settlements (Beguy et al 2010). Additional
   factors influencing migration to Nairobi include climate change and political
   instability (ACP 2010, ICMPD and IOM 2012).

   TABLE 3: Trends in Recent Migration by Province, 1999-2009
                                                                         North                  Rift        West-
                       Nairobi    Central      Coast     Eastern                    Nyanza
                                                                        Eastern                Valley        ern
     In-migrants
                      341,463     140,299     172,762    118,551         12,750     164,222    287,061      87,747
     1999
     In-migrants
                      247,688     135,114      67,849        51,427       7,627      65,577    192,110      44,704
     2009
     Out-migrants
                      149,853     118,730      46,988    161,154         17,406     135,730    119,586   141,785
     1999
     Out-migrants
                      153,655     109,998      42,008    146,021         14,340     107,220    133,945   104,907
     2009
     Net in-
                      191,610      21,569     125,774    -42,603         -4,656      28,492    167,475      -54,038
     migrants 1999
     Net out-
                       94,033      25,116      25,841    -94,594         -6,713     -41,643     58,165      -60,203
     migrants 2009
     Source: KNBS (2012b)

   In the informal settlements of Nairobi, the proportion of migrants is particularly
   high. A 2006 survey in Korogocho and Viwandani, for example, found that 86%
   of the residents were migrants (Emina et al 2011) (Table 4). While there were
   more male than female residents who were migrants, the difference was less than
   5% in both sites and in the aggregate.

   TABLE 4: Migrant Population in Korogocho and Viwandani, 2006
                              Korogocho                       Viwandani                        Both sites
                     Female      Male     Total    Female       Male        Total     Female     Male        Total
     Migrant          73.6       76.5       75.2    94.1         95.2       94.8       84.4      87.7        86.3
     Non-migrant      26.4       23.5       24.8       5.9        4.8        5.2       15.6      12.3        13.7
     Source: Emina et al (2011: S210)

THE URBAN FOOD SYSTEM OF NAIROBI, KENYA
HUNGRY CITIES REPORT NO. 6 11 3. LAND USE AND POPULATION DISTRIBUTION 3.1 Land Use Nairobi’s built environment consists of the following land uses: residential, commercial, industrial, transportation, educational and public utilities/services (Figure 5). The city boundaries also include recreational, agricultural and unde- veloped land, as well as forest and water bodies. Nairobi’s urban landscape can be divided into three types of land tenure, all of which are based on national laws: government land, trust or communal land, and private land (Makachia 2011). Table 5 summarizes trends in land use changes between 1976 and 2000. In this period, land used for agriculture actually increased from 49km2 to 88km2. The urban and built-up areas have increased from 14km2 to 62km2. Forested and mixed range lands decreased, due to expanding agriculture and urban sprawl. Recreational areas include the Nairobi National Park, which on its own covers over 18% of Nairobi’s land (Waititu 2007). FIGURE 5: Nairobi Land Use Map, 2010 Source: Githira (2016)
12 HUNGRY CITIES PARTNERSHIP
TABLE 5: Areas of Land Use/Cover Types for Nairobi, 1976-2000
Year 1976 1988 2000
Land use/
Area (km2) % Area (km2) % Area (km2) %
cover classes
Urban areas 13.99 1.90 41.18 5.77 61.23 8.58
Agriculture 49.83 6.98 57.83 8.10 87.78 12.30
Forests 100.15 14.04 29.09 4.08 23.56 3.30
Bushlands 154.48 22.35 101.49 14.22 95.98 13.45
Mixed rangeland 357.32 50.08 340.62 47.74 237.63 33.31
Shrub/brush range 25.22 3.53 64.19 8.99 170.78 23.94
Open/transitional 6.92 0.96 77.96 10.92 32.72 4.58
Water 0.50 0.07 1.09 0.15 3.77 0.53
Total 713.41 100.00 713.44 100.00 713.45 100.00
Source: Mundia and Aniya (2006)
The rate of urban encroachment on other land uses has been rapid with discon-
tinuous patches of urban development characterizing the urban sprawl. As Mun-
dia and Aniya (2006) note, Nairobi shows a characteristic pattern of star-shaped
urban sprawl where urban development has evolved along the main transport
routes emanating from the city centre. The expansion of settlement has degraded
agricultural areas, particularly on the outskirts of the city, as well as converting
forests and rangeland (Mundia and Aniya 2006). Urban sprawl is affecting the
water supply, wildlife habitat and overall habitat quality, and is leading to serious
environmental degradation. Sprawl not only consumes natural habitats but also
fragments, degrades and isolates remaining natural areas.
3.2 Population Density
In residential areas, population density varies considerably (Figure 6). The aver-
age density is only 31 persons per hectare, with significant variation between the
different residential areas (by income) of the city (Table 6). Between 50-60%
of Nairobi’s population lives on 5-6% of the total land area (Oxfam 2011). In
slums, the population density can be up to 2,300 persons per hectare (UN-
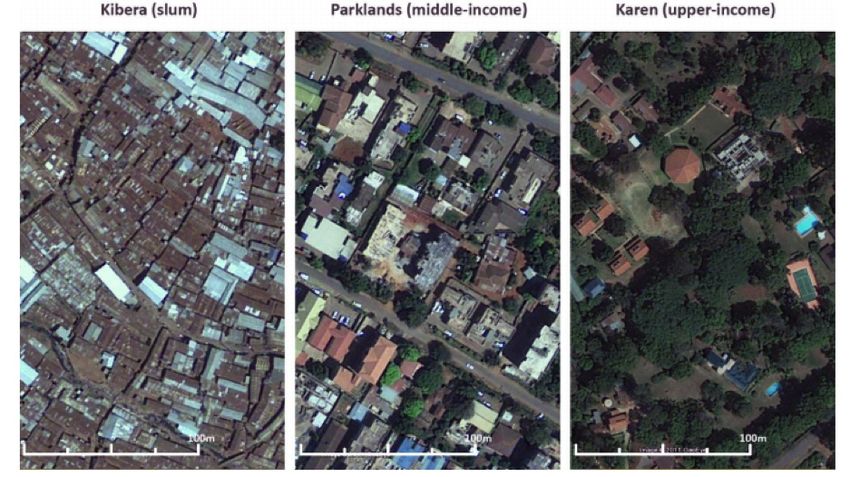
Habitat 2003). In contrast, in high-income areas, there are spacious residential
neighbourhoods with green spaces (Figure 7).
TABLE 6: Population Density by Residential Area, 2006
Area Income level Density per hectare
Muthaiga High 481
Parklands Medium 2,490
City centre Low 10,966
Kibera (slum) Lowest 49,228
Source: UN-Habitat (2006a)
THE URBAN FOOD SYSTEM OF NAIROBI, KENYAHUNGRY CITIES REPORT NO. 6 13 FIGURE 6: Population Density in Nairobi Source: http://www.gora4people.org/nairobi.html FIGURE 7: Residential Housing Density in Nairobi Source: University College London, Bartlett Working Paper 159
14 HUNGRY CITIES PARTNERSHIP
3.3 Informal Slum Settlements
The city’s informal settlements cover only 5% of the urban residential land area,
yet are home to as many as two-thirds of Nairobi’s population. As APHRC
(2014) notes, “the consequence of the rapid and uncontrolled population explo-
sion is the proliferation of informal settlements in Nairobi, with between 60 and
70 percent of Nairobi residents estimated to be living in slums.” Most slums in
Nairobi are of two types: (a) squatter settlements, and (b) illegal subdivisions
of government or private land. Makachia (2011) defines these housing types as
quasi-legal, illegal and legal housing (Table 7). The distribution of slums in Nai-
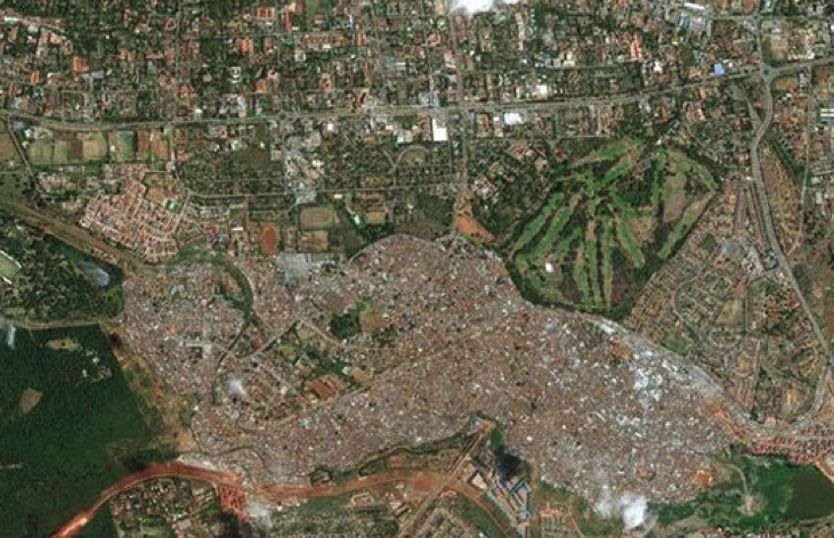
robi is shown in Figure 8. Figures 9 and 10 show the largest slums, Kibera and
Mathare Valley, respectively.
TABLE 7: Settlements and Tenure Status
Settlement Tenure Tenure system description
Resettlement area for Mukuru dwellers, close to Dandora
Gitara-Marigo Quasi-legal
Site & Service Scheme.
Private land, which was formerly rural Kikuyu (of Kiambu
Kangemi-Sodom Legal District) homesteads, that was incorporated into the city
boundaries through expansion.
Private land acquired through a land buying co-operative
Mihang’o Legal
society and ownership is through share holdings.
Mostly privately owned land but some squatting on pub-
Githogoro Legal/illegal lic land (road reserve). It is located on urban fringe and its
development is due to urban sprawl.
Early “African location”, where dwellers were allocated
Majengo-Pumwani Quasi-legal stands using Temporary Occupation Licences. Swahili
house typology used in all dwellings.
Mji-wa-Huruma Illegal Squatting on public land.
Land allocated to Sudanese soldiers who served in the
colonial British army. Initially occupied by Nubian of
Kibera-Makina Quasi-legal
mainly Muslim religious persuasion. Tenants are predomi-
nantly from other Kenyan communities.
Squatting on public land in areas adjacent to industries
Mukuru Illegal
and largely multi-ethnic.
Squatting on public land, largely land invasions and
Kibera-Soweto East Illegal encroachment on railway reserve and other public land.
Mainly Luo tenants with Kikuyu slum lords.
Authorized squatting on public land through populist
presidential order. Settlement never legalized but dwell-
Mathare Quasi-legal
ers believe they have the right to inhabit the area even
without documentation. Dwellers are mostly Kikuyu.
Native Industrial Emerged as a labour camp for road construction workers
Quasi-legal
Training Department in 1974.
CCN rental estate that has been transformed through
Kaloleni Legal dwellers’ initiatives of extensions of “temporary” dwelling
units.
Source: Makachia (2011)
THE URBAN FOOD SYSTEM OF NAIROBI, KENYAHUNGRY CITIES REPORT NO. 6 15 FIGURE 8: Location of Slum Settlements Source: Mutisya and Yarime (2011) FIGURE 9: Kibera Slum in Nairobi Source: http://s2.glbimg.com/z8uE_SmsD-g_gmML59JH1KobwDo=/s.glbimg.com/jo/g1/f/origi- nal/2015/02/25/bbc9.jpg
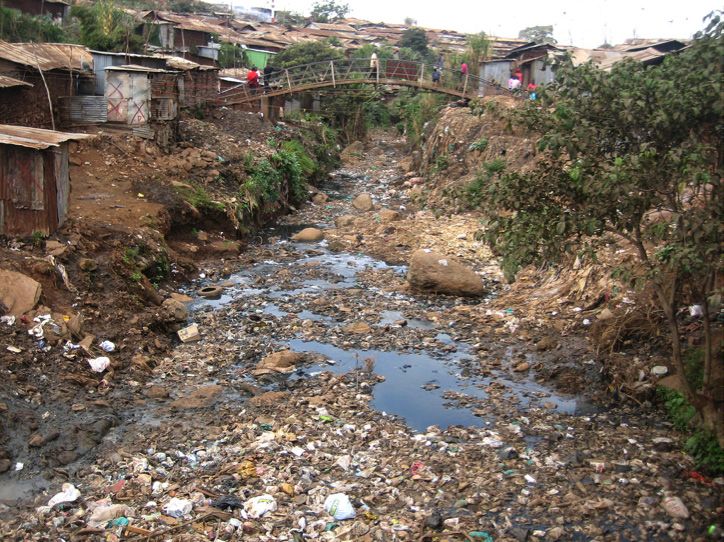
16                                                                HUNGRY CITIES PARTNERSHIP

   FIGURE 10: Housing in Mathare Valley

   Source: https://frameworks.ced.berkeley.edu/2012/collaborative-planning-in-nairobis-informal-settle-
   ments/

   Slums are often located on unsuitable, including polluted, land. The degradation
   and poor upkeep of land affects the social conditions in which slum dwellers live.
   For example, due to land degradation, slums areas are unsuitable for certain live-
   lihoods, such as those based on agricultural production. The government recent-
   ly drafted strategic plans and policies recognizing the existence of slums and the
   need for improvement, but this does not address the lack of security of tenure or
   help with access to the most essential social services (Mutisya and Yarime 2011).

   Compounding the plight of the poor, city-level land records and development
   control systems are poorly managed in all housing sectors. This institutional fail-
   ure has led to large-scale corruption, inequitable land management with a result-
   ing lack of access to land for the politically and economically weak, and generally
   to slum expansion. Evictions are commonplace in Nairobi, although these have
   declined since the government’s adoption of the Kenya Poverty Reduction Strat-
   egy Paper and the UN-Habitat and government housing upgrading partnership
   (IMF 2010, Weru 2004). With little or no legal recourse if evicted, and with no
   significant new residential land for low-income housing under development, the
   urban poor remain locked in crowded and insecure conditions. Recognizing the
   dire situation in the slums, the government prepared the Housing Bill of 2009,
   which is expected to become an Act in due course and increase the production
   of housing units nationally from the current level of 35,000 per year.

THE URBAN FOOD SYSTEM OF NAIROBI, KENYA
HUNGRY CITIES REPORT NO. 6                                                       17

4. THE FORMAL ECONOMY
4.1 Economic Activity
Nairobi is the economic heart of Kenya, accounting for 60% of its GDP. Employ-
ment and trade are concentrated in the services and manufacturing industries
and the agricultural sector, which is the mainstay of the Kenyan economy and
accounts for 24% of Nairobi’s GDP. Nairobi’s service industry (including tour-
ism and communications) is its largest sector, contributing 59% of GDP. Manu-
facturing of cement, textiles and processed foods is the third-place contributor
to the city’s GDP. In addition to these primary economic activities, Nairobi
engages in some forms of sector diversification, such as infrastructure retrofitting
and nuclear energy. Nairobi is connected to Mombasa with a Standard Gauge
Railway which is enhancing business investment, tourism and linkages between
the two cities, as well as easing congestion of buses along the Nairobi-Mombasa
highway.

Nairobi is also a banking and trading hub within East Africa. The Nairobi Secu-
rities Exchange stock market is one of Africa’s largest stock exchanges, capable
of making USD10 million in trade in a day. Most of Kenya’s banks have their
headquarters in Nairobi and the city is also the headquarters for many interna-
tional businesses. The Central Business District acts as the economic hub within
the city. With many Kenyan business and trade events taking place in Nairobi,
the city’s revenue is boosted by tourism and travel-related costs. Nairobi also
has a growing communications market, including companies such as Safaricom
and Airtel Safaricom, which owns the M-PESA system (Ngugi 2011). Africa’s
largest mobile-phone transfer operator, M-PESA has more than 14,000 agents
in Kenya, with more than 40% of these agents in urban areas, and more than 10
million customers. Since 2008, M-PESA users have been able to access banking
services through mobile phones (Ngugi 2011).

With 25% of the country’s workforce (and 43% of its urban workers) employed
in Nairobi, the capital city generates over 45% of the country’s GNP (UN-Hab-
itat 2006b). Vision 2030 seeks to boost Nairobi further and ensure it retains its
position as the regional and international hub for communication, financial ser-
vices, manufacturing, education and transport in East Africa (Republic of Kenya
2007). To further Nairobi’s global city aspirations, the government signed a tele-
communications agreement in 2007 for an undersea survey that would explore
the possibility of constructing a fibre-optic cable to the United Arab Emirates to
be called the East African Marine Systems. Other fibre-optic cable projects are
being pursued to link Kenya to the rest of East Africa and India. The economy
is expected to benefit from cheaper internet access prices and improved capac-
18                                                    HUNGRY CITIES PARTNERSHIP

   ity. Notwithstanding these positive developments, the economic situation in
   Nairobi has deteriorated much faster than nationally. The proportion of people
   living below the poverty line in Nairobi doubled in five years from 26% in 1992
   to 50% in 1997, and has continued to worsen (Aligula et al 2005a). Recent esti-
   mates suggest that more than half of Nairobi residents now live in poverty.

   The Kenyan diaspora plays an important role in the city’s economy. Not only do
   migrants return home and boost tourism revenues, but remittance inflows sent
   home from the Kenya diaspora amounted to 5.4% of Kenya’s GDP in 2009,
   which was more than the private sector raised in capital markets in the same
   period. As the majority of remittances come from economically stable countries
   in North America and Europe, this sets up the opportunity for partnership dis-
   cussions on wider economic issues, such as trade and investment. The creation
   of Diaspora Trade Councils and business networks facilitates the contracting of
   diaspora suppliers to exporters (Plaza and Ratha 2011). The knowledge transfer
   of skilled individuals and return migration help create and sustain Nairobi’s pub-
   lic and private institutions.

   4.2 Employment and Unemployment
   Kenya’s labour force increased from 7.3 million in 1989 to 14.2 million in 2009.
   The number of economically inactive people was estimated at 2.5 million in 1989
   and 4.7 million in 2009. Labour force participation rates ranged from 75.7% in
   1989 to 76.7% in 2009 (KNBS 2012a). Table 8 shows these rates according to
   the 2009 Kenya Population and Housing Census.

   TABLE 8: Key Indicators in Kenya’s Labour Force
                                              Total %       Male %       Female %
     Labour force participation rate           76.7          81.8           71.8
     Rural                                     76.8          80.4           73.3
     Urban                                     76.6          84.1           68.9
     Unemployment rate                          9.7           9.9            9.4
     Rural                                      7.9           9.0            6.8
     Urban                                     12.8          11.5           14.3
     Employment rate                           59.3          73.7           65.1
     Rural                                     70.7          73.2           68.3
     Urban                                     66.8          74.4           59.1
     Underemployment rate                      13.7          10.9           16.8
     Rural                                     16.9          13.7           20.2
     Urban                                      8.0           6.4           10.1
     Total dependency ratio                    86.9             -              -
     Rural                                    100.4             -              -
     Urban                                     62.7             -              -

THE URBAN FOOD SYSTEM OF NAIROBI, KENYA
HUNGRY CITIES REPORT NO. 6 19
Youth (15-30) unemployment rate 13.2 13.6 12.8
Rural 10.6 12.0 9.2
Urban 12.4 16.1 18.8
Youth (15-30) labour force participation rate 67.6 71.1 64.2
Youth employment rate 58.6 61.5 56.0
Rural 60.1 60.9 59.3
Urban 56.2 62.4 50.6
No. (million) No. (million) No. (million)
Employed population (aged 15-64) 14.2 7.4 6.8
Rural 9.3
Urban 4.9
Unemployed population (aged 15-64 years) 1.5 0.8 0.7
Rural 0.8
Urban 0.7
Economically active (5 years and older) 20.5 10.7 9.8
Rural 14.2
Urban 6.3
Working children (aged 5-7) 4.5 2.3 2.2
Rural 3.9
Urban 0.6
Employed population (65 years and older) 0.9 0.4 0.5
Rural 0.7
Urban 0.2
Source: KNBS (2012a)
These employment figures include both formal and informal sector employees.
However, the disaggregated data shows that 44% of workers were employed in
the informal sector (including persons employed in private households) and that
the formal sector accounted for only 23% of the working population aged 15-64
(KNBS 2010: xiii). The informal economy therefore dominates employment
and plays a critical role in urban livelihoods through employment creation and
economic growth, poverty reduction, job training and social protection.
Despite its varied economic structure, formal unemployment rates in Nairobi are
high. In 2011, there were an estimated 2.5 million formally unemployed young
people in Nairobi, which is well over 50% of the city’s population (Oxfam 2011).
The Nairobi region has some of the highest youth unemployment and total
unemployment rates in the world. Muiya (2014) notes a lack of skills and a lack of
education as factors affecting youth unemployment, especially for young women.
An opinion survey conducted as part of the Youth and Citizenship Project notes
that only 37% of young people say they received formal training for employ-
ment (Daily Nation 2014). Many respondents noted employment opportunities
lasting only a few days at a time with wages only slightly above USD1 per day
(Muiya 2014). Decision-makers have attempted to address youth unemployment20 HUNGRY CITIES PARTNERSHIP
in Nairobi through various stakeholder forums. In 2014, a summit took place for
employers and universities in the city (International Conference on the Great
Lakes Region 2014). As an outcome of this and other discussions, programmes
to overcome unemployment highlight new curricula that help bridge the gap
between necessary job skills and long-term and sustainable jobs (Muiya 2014).
A survey of household income-generating activity in two slum areas of Nairobi
in 2009 provided various insights into the employment situation in low-income
areas of the city (Emina et al 2011) (Table 9). Overall, only 14% of the popula-
tion over 18 years old were in salaried jobs. There was a major difference between
men and women with 22% of males and only 4% of females overall in salaried
employment. In Viwandani, the proportion in employment was 22% (33% male
and 5% female) due to the proximity of industry. In Korogocho, only 4% of
the adult population were in salaried employment (5% male and 2% female). .
Casual employment was more common than formal employment in both areas,
at 38% in total. As many as 50% of men and 21% of women were in casual jobs.
Around one-quarter of women and 18% of men were running their own busi-
nesses. The economically inactive population was 27% (which included 51% of
the women).
TABLE 9: Income Generating Activity of Adult Population, 2009
Korogocho Viwandani Both sites
Female Male Total Female Male Total Female Male Total
Salaried
1.8 5.1 3.6 5.1 32.6 21.6 3.6 22.3 14.4
employment
Established
12.1 12.4 12.2 10.2 7.2 8.4 11.0 9.1 9.9
business
Unestablished
15.1 13.2 14.1 11.4 6.6 8.5 13.0 9.1 10.7
business
Casual
18.6 54.9 38.1 23.5 46.8 37.5 21.4 49.8 37.8
employment
Economically
51.4 13.6 31.2 49.8 6.8 23.9 50.5 9.3 26.8
inactive
Source: Emina et al (2011: S212)
5. INFORMAL ECONOMY
5.1 Size and Character
The 2009 Kenya Population and Housing Census reported that 53% of the
national urban population is engaged in the informal economy, and that this is
likely to reflect conditions in Nairobi (KNBS 2012a). In addition, 40% of work-
ing children were self-employed in the informal sector. The informal sector is
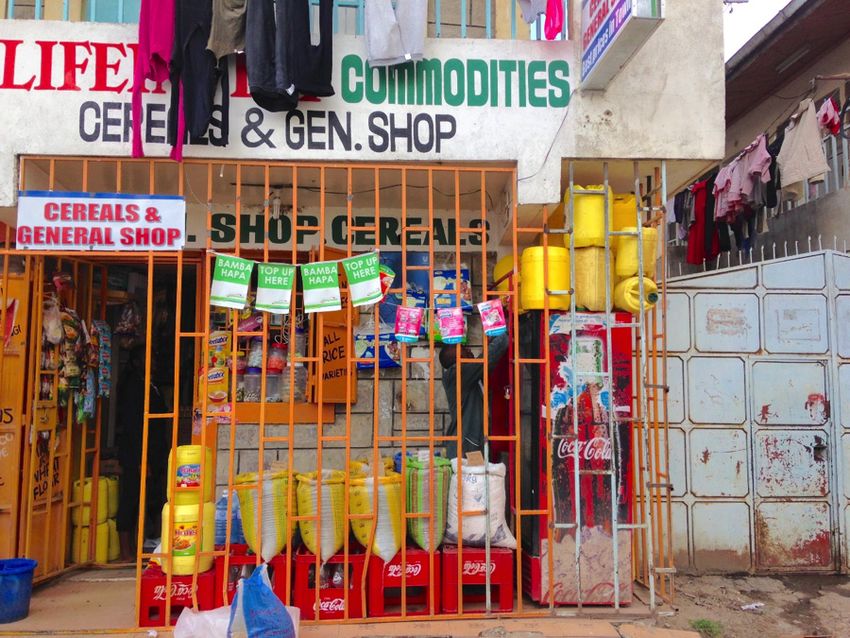
THE URBAN FOOD SYSTEM OF NAIROBI, KENYAHUNGRY CITIES REPORT NO. 6 21 the most robust employment sector, with nine in every 10 new jobs created being in the informal economy (Budlender 2011). While this data is not disaggregated for Nairobi, earlier data indicated that one-quarter of the city’s economy was informal, and it is expected that this proportion has risen over the past decade and a half (Mitullah and Wachira 2003: 5). UN-Habitat (2016: 16) estimates that approximately half of all employed adults in Nairobi are in the informal sec- tor. Moreover, 84% of informal sector employees are youth (15-24 years of age) and more women than men are involved in domestic work and street vending (UN-Habitat 2016: 16; see also Kinyanjui 2013, Muiruri 2010, Thieme 2013). A 2016 national survey of micro, small and medium-sized businesses in Kenya recorded a total of 268,100 licensed and 782,500 unlicensed enterprises in Nai- robi (KNBS 2016: 21). Some of the former and all of the latter would qualify as operating in the informal sector. UN-Habitat (2006b) shows that the informal sector is extremely heterogeneous with a wide variety of activities and work types as well as variable incomes and education levels of participants. There are two major groups of activity in the sector: manufacturing (popularly known as “jua kali”) and services (especial- ly retail). Jua kali artisans are mainly involved in metalworking, hardware and building materials, and repair of vehicles and appliances (Bull et al 2016, Sonobe et al 2011). Jua kali is male-dominated and contributes 15-20% of the informal economy in Nairobi. On the other hand, retail takes place in designated market spaces and on the streets: They operate on makeshift structures, including mats, tables, racks, wheelbarrows, handcarts and bicycles. Others simply carry their wares in their hands and/or on heads and shoulders. Others hang their goods, such as clothes, on walls, trees or fences. Some are more advanced and have set up temporary shades with stands to display their goods. Most street vendors operate without any formal tenure for the sites they use, nor with formal business names (UN-Habitat 2006b). Table 10 shows that clothing and shoe retail is the major informal-sector retail activity, with almost half of all vendors involved. Around 12% are involved in selling fresh fruit and vegetables. There is a clear gender difference, with 25% of women and only 6% of men involved in food vending. There are two main types of female entrepreneur in the sector: first, women from surrounding rural areas make regular visits to the city to sell vegetables in the main wholesale market of Wakulima and other small markets. Also, women from further afield come to the city to sell merchandise, including handcrafted baskets, fish and second-hand clothes. Second, many female informal entrepreneurs live in Nairobi and run their businesses in the city’s markets and on the streets.
22                                                       HUNGRY CITIES PARTNERSHIP

   TABLE 10: Types of Informal Sector Retail Activity
                                          % of informal
                                                          Male %         Female %
                                           economy
     Clothes/bags                             48.8         49.4            55.7
     Shoes                                    12.5         16.7             4.7
     Vegetables/fruit                         12.2          6.2            25.5
     Hardware/toys/assorted goods             11.7         12.2             9.4
     Electronics                               9.9         12.8               -
     Utensils                                  2.0          1.2             0.9
     Books                                     2.0          1.6               -
     Cooked food                               1.0            -             3.8
     Source: UN-Habitat (2006b)

   The informal sector includes workers who hold casual, temporary or multiple
   jobs, work in subsistence agriculture or illegal business operations, are self-
   employed and even work unpaid (Ouma 2010a). Also, some formal businesses
   pay those in the informal sector for service-based work. Activities include trans-
   portation, construction, garment or shoe making and trading, metal fabrication,
   market and street vending and trading, production of household goods, and
   medicine sales (Kinyanjui 2013). The informal economy also includes financial
   institutions as few people among the urban poor have access to formal banking
   services. The average monthly charges for maintaining an account and with-
   drawal fees make banks inaccessible to the poor and create the need for informal
   financial services (Ngugi 2011).

   Gulyani and Talukdar (2010) randomly sampled 1,755 households in Nairobi’s
   slum settlements to examine their rates of participation in the informal economy.
   They found that 30% of households operated 632 enterprises that employed 900
   people. This would mean that 81,000 slum households operate at least one enter-
   prise and employ 130,000 people. As many as 46% of the micro-enterprises
   were involved in food retail including sellers of fruit and vegetables, butchers and
   fishmongers, those preparing and selling snacks and other foods, and those sell-
   ing household items including cereals. The majority (60%) operate outside the
   home and half report selling outside their own settlement (Table 11). Households
   that owned microenterprises were more likely to be poor, to be larger in size, to
   have more women in the household, and to have previously lived in a rural area.
   At the same time, microenterprise ownership decreases poverty. The longer the
   enterprise had been in operation the less likely the household was to be poor.
   Also, those in the food sector were less likely to be poor than those with enter-
   prises in other sectors.

THE URBAN FOOD SYSTEM OF NAIROBI, KENYA
HUNGRY CITIES REPORT NO. 6 23
TABLE 11: Types of Household Microenterprise in Nairobi
Category and types of enterprise % of enterprises
1. Retailing
Selling fruit and vegetables
45.5
Food preparation, sale and processing
Small retailers/hawkers
2. Clothing and shoes
Sewing and textile
24.2
Shoe making and repair
Selling clothes and shows
3. Retail kiosks
Kiosk selling various items 7.9
Water kiosk
4. Small fabrication and repairs
Furniture making
Electronic sales and repair 7.7
Metal welding/fabrication
Automotive repair
5. Services
Dry cleaning, washing, ironing
Building, plumbing, electrician, painter 4.2
Transportation
Traditional medicine
6. Services
Hairdresser
4.9
Medical clinic
Photography
7. Entertainment
Brewing 2.3
Bar
8. Farming and livestock 0.9
9. Other 2.3
Source: Gulyani and Talukdar (2010: 1714)
Nairobi is also home to thousands of refugees, especially from the Horn of Africa
and the Great Lakes Region (Campbell 2005, 2006, Pavanello et al 2010). Just
over 40% are estimated to be self-employed, primarily in the informal economy
(Wagacha and Guiney 2008). Since the 1990s, the Eastleigh district of Nairobi
has become a major hub for Somali formal and informal business activity (Car-
rier 2017). Somali refugees in Eastleigh sell a wide variety of goods on the road-
sides, including fabrics, undergarments, scarves, shoes, toiletries, crockery, and
fruit and vegetables (Pavanello et al 2010). Hundreds of smaller shops, also run
mainly by Somalis, sell electronic goods, kitchenware, furniture, clothes and
other items. Eastleigh is also home to many Somali-owned telephone call cen-
tres and internet cafes (Campbell, 2006). Many musicians and tailors in Nairobi
are Congolese refugees, and Ethiopian refugees are successful in the catering and
beauty businesses, as well as in running matatus (commuter taxis).24 HUNGRY CITIES PARTNERSHIP
5.2 Informal Sector Policies
The informal economy in Kenya has traditionally been subject to statutes, by-
laws and regulations that produce an unfavourable business environment (UN-
Habitat, 2006b). Local authorities have used these to control and suppress the
development of street vending and other forms of informal trade. This legislation
includes the Local Government Act, the Physical Planning Act, the Land Act,
the Trade Licensing Act, the Public Health Act, the Employment Act and other
employment-related Acts. All have been used in various ways in attempts to con-
trol the expansion of the informal sector. The 2012 Micro and Small Enterprises
Act was designed to provide a process for the regularization of the informal sec-
tor and its absorption into the formal. According to UN-Habitat (2006b), the
City of Nairobi (Hawkers) By-Laws 1963 is the main impediment to street trad-
ing and other micro-enterprises in Nairobi:
The City Inspectorate has often used these by-laws in order to forcibly to remove
informal vendors from the street, where their presence was perceived as an offence.
Interestingly, the same by-laws do allow hawking as a licensed activity, but fall
short of defining how and where such trade could or should be carried out…Many
vendors would readily regularise their informal activities, but are prevented from
doing so as much by complex regulations as by lack of support or repressive action
by public authorities. Yet for all the wasteful efforts to evict them from public space,
most vendors continue to use it illegally (UN-Habitat 2006b).
The sites considered illegal for hawking by city authorities are seen as the most
appropriate by hawkers because of their proximity to potential customers (UN-
Habitat 2006b). In 2003, the forced relocation of vendors from the open streets
pushed them into the backstreets of the Central Business District. In 2006, the
City Council updated its by-laws to ban street traders from the CBD (Morange
2015). Over 8,000 vendors are now housed in the government-funded Muth-
urwa Market outside the CBD (Ouma 2010a). The City Council of Nairobi also
allows a weekly Maasai Market to be held in a city parking area (Ouma 2010a).
Other markets have developed organically on unoccupied land (Linehan 2015).
The markets certainly do not have the capacity to accommodate all street traders
and many still operate on the streets of Nairobi, close to the CBD (IFRA 2016).
As Linehan (2015: 327) notes: “poor vendors, with no market space left to trade
in, take to the streets, are assaulted by police, arrested, oppressed by taxes, fines,
and persistently harassed.” An estimated 14,000 street vendors ply their trade
near the CBD where there is constant harassment and conflict with the city
authorities:
Between October and December 2012, six street traders were killed by the police as
clashes over their presence in the city centre broke down into violence. Their death
is the latest sign of a running conflict between the urban poor and the elite. This is
a conflict over space, a conflict over ways of life, where the urgencies of livelihoods
THE URBAN FOOD SYSTEM OF NAIROBI, KENYAHUNGRY CITIES REPORT NO. 6 25 sustained by informal trade, clash against the forces of kleptocratic urbanism, and a vision to order Nairobi and build its status as a world class city. As a consequence, the history of street markets in Nairobi is a history of destruction. The needs and rights of these informal workers are not safeguarded by legal or social protections, leading to constant expulsions from the city (Linehan 2015: 325). Reports of corruption led to an undercover investigation that revealed wide- spread and organized intimidation and systematic payment of bribes to city officials. The investigation is portrayed in a four-part documentary series called ‘Kanjo Kingdom.’ As well as probing the governance of street trading, the videos provide a compelling picture of street trading in Nairobi (see https://www.you- tube.com/watch?v=IGMnFQTiwNg). 6. POVERTY, INCOME AND SERVICES 6.1 Distribution of Income Nairobi is characterized by high inequality, with a Gini coefficient of 0.46 and with the wealthiest 10% of the city’s population spending 20 times more than the poorest 10% (World Bank 2008). Income distribution across the city is con- nected to housing distribution and land tenure. High-income neighbourhoods are concentrated in the western part of the city (Figure 11). Civil servants and the middle class reside in medium-density and middle-income neighbourhoods in the eastern quadrant. The low-middle-income population lives in high-density housing estates along major transport routes. The lowest-income areas in Nai- robi – except Kibera and a few other informal settlements scattered around the city – form a contiguous area from east of the CBD to the urban fringe of the east quadrant. Income distribution and expenditure also vary within both low-income and higher-income areas (World Bank 2008). While Nairobi has lower absolute pov- erty levels than other urban centres in Kenya, poverty is concentrated in the city’s slums. The World Bank (2008: xix) reported that 63% of Nairobi’s slum populations live below the poverty line and that absolute poverty is concentrated in the “slum areas in Nairobi, [which] are home to the bulk of the poor in the country’s capital” (World Bank 2008: 24). Unemployment levels are dispropor- tionately high (26%), and secondary level education or more is low (24%). The World Bank (2008: 56) described living conditions in the slums as “appalling, characterized by widespread poverty and limited or non-existent public services. Housing units in the slums are shabby and crowded, yet rents are high, absorbing a sizeable fraction of household budget.”
You can also read