Geometry with Data Analysis - Overview - Mountain Brook Schools
←
→
Page content transcription
If your browser does not render page correctly, please read the page content below
Geometry with Data Analysis
                                                                  Overview
Geometry with Data Analysis is a newly-designed course which builds on the students’ experiences in the middle grades. It is the first of three
required courses in high school mathematics, providing a common Grade 9 experience for all students entering high-school-level mathematics.

Geometry with Data Analysis builds essential concepts necessary for students to meet their postsecondary goals (whether they pursue additional
study or enter the workforce), to function as effective citizens, and to recognize the wonder, joy, and beauty of mathematics (NCTM, 2018). It is
important because it develops mathematical knowledge and skills through visual representations prior to the more abstract development of algebra.
Beginning high school mathematics with Geometry with Data Analysis in Grade 9 offers students the opportunity to build their reasoning and sense-
making skills, see the applicability of mathematics, and prepare more effectively for further studies in algebra. The course also focuses on data
analysis, which provides students with tools to describe, show, and summarize data in the world around them.

In Geometry with Data Analysis, students incorporate knowledge and skills from several mathematics content areas, leading to a deeper
understanding of fundamental relationships within the discipline and building a solid foundation for further study. In the content area of Geometry
and Measurement, students build on and deepen prior understanding of transformations, congruence, similarity, and coordinate geometry concepts.
Informal explorations of transformations provide a foundation for more formal considerations of congruence and similarity, including development
of criteria for triangle congruence and similarity. An emphasis on reasoning and proof throughout the content area promotes exploration, conjecture
testing, and informal and formal justification. Students extend their middle school work with conjecturing and creating informal arguments to more
formal proofs in this course.

In the content area of Algebra and Functions, students perform algebraic calculations with specific application to geometry that build on foundations
of algebra from Grades 7 and 8. In the Data Analysis, Statistics, and Probability content area, students build from earlier experiences in analyzing
data and creating linear models to focus on univariate quantitative data on the real number line (shape, center, and variability) and bivariate
quantitative data on a coordinate plane (creating linear models).
Geometry with Data Analysis
NOTE: Although not all content areas in the grade level have been included in the overview, all standards should be included in instruction.
A focus on mathematical modeling and real-world statistical problem-solving is included across the course; see Appendix E for more information on
the modeling cycles for mathematics and statistics. It is essential for students to use technology and other mathematical tools to explore geometric
shapes and their properties and to represent and analyze data.
The eight Student Mathematical Practices listed in the chart below represent what students are doing as they learn mathematics. Students should
regularly engage in these processes and proficiencies at every level throughout their mathematical studies. Proficiency with these practices is critical
in using mathematics, both within the classroom and in life. The Student Mathematical Practices are standards to be incorporated across all
grades.
Student Mathematical Practices
1. Make sense of problems and persevere in solving them. 5. Use appropriate tools strategically.
2. Reason abstractly and quantitatively. 6. Attend to precision.
3. Construct viable arguments and critique the reasoning of others. 7. Look for and make use of structure.
4. Model with mathematics. 8. Look for and express regularity in repeated reasoning.
The standards indicating what students should know or be able to do at the end of the course are listed in the right columns of the content standard
tables. The essential concepts are listed in the left columns. In some cases, focus areas are indicated. Statements in bold print indicate the scope of
the standard and align the standard to related content taught in other courses. The full scope of every standard should be addressed during instruction.
Geometry with Data Analysis Content Standards
Each content standard completes the stem “Students will…”
Number and Quantity
Together, irrational numbers and rational 1. Extend understanding of irrational and rational numbers by rewriting expressions involving
numbers complete the real number system, radicals, including addition, subtraction, multiplication, and division, in order to recognize
representing all points on the number line, geometric patterns.
while there exist numbers beyond the real
numbers called complex numbers.Geometry with Data Analysis
Quantitative reasoning includes and 2. Use units as a way to understand problems and to guide the solution of multi-step problems.
mathematical modeling requires attention to a. Choose and interpret units consistently in formulas.
units of measurement. b. Choose and interpret the scale and the origin in graphs and data displays.
c. Define appropriate quantities for the purpose of descriptive modeling.
d. Choose a level of accuracy appropriate to limitations of measurements when reporting
quantities.
Algebra and Functions
Focus 1: Algebra
The structure of an equation or inequality 3. Find the coordinates of the vertices of a polygon determined by a set of lines, given their
(including, but not limited to, one-variable equations, by setting their function rules equal and solving, or by using their graphs.
linear and quadratic equations, inequalities,
and systems of linear equations in two
variables) can be purposefully analyzed (with
and without technology) to determine an
efficient strategy to find a solution, if one
exists, and then to justify the solution.
Expressions, equations, and inequalities can be 4. Rearrange formulas to highlight a quantity of interest, using the same reasoning as in solving
used to analyze and make predictions, both equations.
within mathematics and as mathematics is Example: Rearrange the formula for the area of a trapezoid to highlight one of the bases.
applied in different contexts – in particular,
contexts that arise in relation to linear,
quadratic, and exponential situations.
Focus 2: Connecting Algebra to Functions
Graphs can be used to obtain exact or 5. Verify that the graph of a linear equation in two variables is the set of all its solutions plotted
approximate solutions of equations, in the coordinate plane, which forms a line.
inequalities, and systems of equations and
inequalities—including systems of linear 6. Derive the equation of a circle of given center and radius using the Pythagorean Theorem.
equations in two variables and systems of a. Given the endpoints of the diameter of a circle, use the midpoint formula to find its
linear and quadratic equations (given or
center and then use the Pythagorean Theorem to find its equation.
obtained by using technology).
b. Derive the distance formula from the Pythagorean Theorem.Geometry with Data Analysis
Data Analysis, Statistics, and Probability
Focus 1: Quantitative Literacy
Mathematical and statistical reasoning 7. Use mathematical and statistical reasoning with quantitative data, both univariate data (set of
about data can be used to evaluate values) and bivariate data (set of pairs of values) that suggest a linear association, in order to
conclusions and assess risks. draw conclusions and assess risk.
Example: Estimate the typical age at which a lung cancer patient is diagnosed, and estimate
how the typical age differs depending on the number of cigarettes smoked per day.
Focus 2: Visualizing and Summarizing Data
Data arise from a context and come in two 8. Use technology to organize data, including very large data sets, into a useful and manageable
types: quantitative (continuous or discrete) structure.
and categorical. Technology can be used to
“clean” and organize data, including very
large data sets, into a useful and
manageable structure – a first step in any
analysis of data
Distributions of quantitative data 9. Represent the distribution of univariate quantitative data with plots on the real number line,
(continuous or discrete) in one variable choosing a format (dot plot, histogram, or box plot) most appropriate to the data set, and
should be described in the context of the represent the distribution of bivariate quantitative data with a scatter plot. Extend from
data with respect to what is typical (the simple cases by hand to more complex cases involving large data sets using technology.
shape, with appropriate measures of center
and variability, including standard 10. Use statistics appropriate to the shape of the data distribution to compare and contrast two or
deviation) and what is not (outliers), and more data sets, utilizing the mean and median for center and the interquartile range and
these characteristics can be used to standard deviation for variability.
compare two or more subgroups with a. Explain how standard deviation develops from mean absolute deviation.
respect to a variable. b. Calculate the standard deviation for a data set, using technology where appropriate.
11. Interpret differences in shape, center, and spread in the context of data sets, accounting for
possible effects of extreme data points (outliers) on mean and standard deviation.Geometry with Data Analysis
Scatter plots, including plots over time, can 12. Represent data of two quantitative variables on a scatter plot, and describe how the variables
reveal patterns, trends, clusters, and gaps are related.
that are useful in analyzing the association a. Find a linear function for a scatter plot that suggests a linear association and
between two contextual variables. informally assess its fit by plotting and analyzing residuals, including the squares of the
residuals, in order to improve its fit.
b. Use technology to find the least-squares line of best fit for two quantitative variables.
Analyzing the association between two 13. Compute (using technology) and interpret the correlation coefficient of a linear relationship.
quantitative variables should involve
statistical procedures, such as examining 14. Distinguish between correlation and causation.
(with technology) the sum of squared
deviations in fitting a linear model,
analyzing residuals for patterns, generating
a least-squares regression line and finding
a correlation coefficient, and
differentiating between correlation and
causation.
Data analysis techniques can be used to 15. Evaluate possible solutions to real-life problems by developing linear models of contextual
develop models of contextual situations situations and using them to predict unknown values.
and to generate and evaluate possible a. Use the linear model to solve problems in the context of the given data.
solutions to real problems involving those b. Interpret the slope (rate of change) and the intercept (constant term) of a linear model in
contexts. the context of the given data.
Geometry and Measurement
Focus 1: Measurement
Areas and volumes of figures can be 16. Identify the shapes of two-dimensional cross-sections of three-dimensional objects, and
computed by determining how the figure identify three-dimensional objects generated by rotations of two-dimensional objects.
might be obtained from simpler figures by
dissection and recombination.Geometry with Data Analysis
17. Model and solve problems using surface area and volume of solids, including composite
solids and solids with portions removed.
a. Give an informal argument for the formulas for the surface area and volume of a sphere,
cylinder, pyramid, and cone using dissection arguments, Cavalieri's Principle, and
informal limit arguments.
b. Apply geometric concepts to find missing dimensions to solve surface area or volume
problems.
Constructing approximations of 18. Given the coordinates of the vertices of a polygon, compute its perimeter and area using a
measurements with different tools, variety of methods, including the distance formula and dynamic geometry software, and
including technology, can support an evaluate the accuracy of the results.
understanding of measurement.
When an object is the image of a known 19. Derive and apply the relationships between the lengths, perimeters, areas, and volumes of
object under a similarity transformation, a similar figures in relation to their scale factor.
length, area, or volume on the image can
be computed by using proportional 20. Derive and apply the formula for the length of an arc and the formula for the area of a sector.
relationships.
Focus 2: Transformations
Applying geometric transformations to 21. Represent transformations and compositions of transformations in the plane (coordinate and
figures provides opportunities for otherwise) using tools such as tracing paper and geometry software.
describing the attributes of the figures a. Describe transformations and compositions of transformations as functions that take
preserved by the transformation and for points in the plane as inputs and give other points as outputs, using informal and formal
describing symmetries by examining when notation.
a figure can be mapped onto itself. b. Compare transformations which preserve distance and angle measure to those that do
not.
22. Explore rotations, reflections, and translations using graph paper, tracing paper, and geometry
software.
a. Given a geometric figure and a rotation, reflection, or translation, draw the image of the
transformed figure using graph paper, tracing paper, or geometry software.
b. Specify a sequence of rotations, reflections, or translations that will carry a given figure
onto another.
c. Draw figures with different types of symmetries and describe their attributes.Geometry with Data Analysis
23. Develop definitions of rotation, reflection, and translation in terms of angles, circles,
perpendicular lines, parallel lines, and line segments.
Showing that two figures are congruent 24. Define congruence of two figures in terms of rigid motions (a sequence of translations,
involves showing that there is a rigid rotations, and reflections); show that two figures are congruent by finding a sequence of rigid
motion (translation, rotation, reflection, or motions that maps one figure to the other.
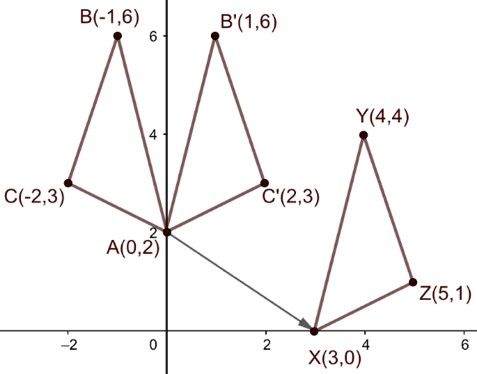
glide reflection) or, equivalently, a Example: △ABC is congruent to △XYZ since a reflection followed by a translation maps
sequence of rigid motions that maps one △ABC onto △XYZ.
figure to the other.
25. Verify criteria for showing triangles are congruent using a sequence of rigid motions that map
one triangle to another.
a. Verify that two triangles are congruent if and only if corresponding pairs of sides and
corresponding pairs of angles are congruent.
b. Verify that two triangles are congruent if (but not only if) the following groups of
corresponding parts are congruent: angle-side-angle (ASA), side-angle-side (SAS), side-
side-side (SSS), and angle-angle-side (AAS).
Example: Given two triangles with two pairs of congruent corresponding sides and a
pair of congruent included angles, show that there must be a sequence of rigid motions
will map one onto the other.Geometry with Data Analysis
Showing that two figures are similar 26. Verify experimentally the properties of dilations given by a center and a scale factor.
involves finding a similarity transformation a. Verify that a dilation takes a line not passing through the center of the dilation to a
(dilation or composite of a dilation with a parallel line, and leaves a line passing through the center unchanged.
rigid motion) or, equivalently, a sequence b. Verify that the dilation of a line segment is longer or shorter in the ratio given by the
of similarity transformations that maps one scale factor.
figure onto the other.
27. Given two figures, determine whether they are similar by identifying a similarity
transformation (sequence of rigid motions and dilations) that maps one figure to the other.
28. Verify criteria for showing triangles are similar using a similarity transformation (sequence of
rigid motions and dilations) that maps one triangle to another.
a. Verify that two triangles are similar if and only if corresponding pairs of sides are
proportional and corresponding pairs of angles are congruent.
b. Verify that two triangles are similar if (but not only if) two pairs of corresponding
angles are congruent (AA), the corresponding sides are proportional (SSS), or two pairs
of corresponding sides are proportional and the pair of included angles is congruent
(SAS).
Example: Given two triangles with two pairs of congruent corresponding sides and a
pair of congruent included angles, show there must be a set of rigid motions that maps
one onto the other.
Focus 3: Geometric Arguments, Reasoning, and Proof
Using technology to construct and explore 29. Find patterns and relationships in figures including lines, triangles, quadrilaterals, and circles,
figures with constraints provides an using technology and other tools.
opportunity to explore the independence a. Construct figures, using technology and other tools, in order to make and test
and dependence of assumptions and conjectures about their properties.
conjectures. b. Identify different sets of properties necessary to define and construct figures.
Proof is the means by which we 30. Develop and use precise definitions of figures such as angle, circle, perpendicular lines,
demonstrate whether a statement is true or parallel lines, and line segment, based on the undefined notions of point, line, distance along a
false mathematically, and proofs can be line, and distance around a circular arc.
communicated in a variety of ways (e.g.,
two-column, paragraph).Geometry with Data Analysis
31. Justify whether conjectures are true or false in order to prove theorems and then apply those
theorems in solving problems, communicating proofs in a variety of ways, including flow
chart, two-column, and paragraph formats.
a. Investigate, prove, and apply theorems about lines and angles, including but not limited
to: vertical angles are congruent; when a transversal crosses parallel lines, alternate
interior angles are congruent and corresponding angles are congruent; the points on the
perpendicular bisector of a line segment are those equidistant from the segment's
endpoints.
b. Investigate, prove, and apply theorems about triangles, including but not limited to: the
sum of the measures of the interior angles of a triangle is 180˚; the base angles of
isosceles triangles are congruent; the segment joining the midpoints of two sides of a
triangle is parallel to the third side and half the length; a line parallel to one side of a
triangle divides the other two proportionally, and conversely; the Pythagorean Theorem
using triangle similarity.
c. Investigate, prove, and apply theorems about parallelograms and other quadrilaterals,
including but not limited to both necessary and sufficient conditions for parallelograms
and other quadrilaterals, as well as relationships among kinds of quadrilaterals.
Example: Prove that rectangles are parallelograms with congruent diagonals.
Proofs of theorems can sometimes be made 32. Use coordinates to prove simple geometric theorems algebraically.
with transformations, coordinates, or
algebra; all approaches can be useful, and 33. Prove the slope criteria for parallel and perpendicular lines and use them to solve geometric
in some cases one may provide a more problems.
accessible or understandable argument than Example: Find the equation of a line parallel or perpendicular to a given line that passes
another. through a given point.Geometry with Data Analysis
Focus 4: Solving Applied Problems and Modeling in Geometry
Recognizing congruence, similarity, 34. Use congruence and similarity criteria for triangles to solve problems in real-world contexts.
symmetry, measurement opportunities, and
other geometric ideas, including right 35. Discover and apply relationships in similar right triangles.
triangle trigonometry, in real-world a. Derive and apply the constant ratios of the sides in special right triangles (45˚-45˚-90˚
contexts provides a means of building and 30˚-60˚-90˚).
understanding of these concepts and is a b. Use similarity to explore and define basic trigonometric ratios, including sine ratio,
powerful tool for solving problems related cosine ratio, and tangent ratio.
to the physical world in which we live. c. Explain and use the relationship between the sine and cosine of complementary angles.
d. Demonstrate the converse of the Pythagorean Theorem.
e. Use trigonometric ratios and the Pythagorean Theorem to solve right triangles in applied
problems, including finding areas of regular polygons.
36. Use geometric shapes, their measures, and their properties to model objects and use those
models to solve problems.
37. Investigate and apply relationships among inscribed angles, radii, and chords, including but
not limited to: the relationship between central, inscribed, and circumscribed angles; inscribed
angles on a diameter are right angles; the radius of a circle is perpendicular to the tangent
where the radius intersects the circle.
Experiencing the mathematical modeling 38. Use the mathematical modeling cycle involving geometric methods to solve design problems.
cycle in problems involving geometric Examples: Design an object or structure to satisfy physical constraints or minimize cost;
concepts, from the simplification of the work with typographic grid systems based on ratios; apply concepts of density based on area
real problem through the solving of the and volume.
simplified problem, the interpretation of its
solution, and the checking of the solution’s
feasibility, introduces geometric
techniques, tools, and points of view that
are valuable to problem-solving.You can also read