ECOSTRESS Level-3 DisALEXI-JPL Evapotranspiration (ECO3ETALEXI) User Guide
←
→
Page content transcription
If your browser does not render page correctly, please read the page content below
ECOsystem Spaceborne Thermal Radiometer
Experiment on Space Station (ECOSTRESS)

ECOSTRESS Level-3 DisALEXI-JPL
Evapotranspiration (ECO3ETALEXI)
User Guide
Version 1
May 20, 2021

Kerry Cawse-Nicholson
ECOSTRESS Science Team
Jet Propulsion Laboratory
California Institute of Technology

Martha Anderson
ECOSTRESS Algorithm Development Team
ECOSTRESS Science Team
U.S. Department of Agriculture
Agricultural Research Service

© 2021 California Institute of Technology. Government sponsorship acknowledged.

National Aeronautics and
Space Administration
Jet Propulsion Laboratory
4800 Oak Grove Drive
Pasadena, California 91109-8099
California Institute of Technology

                                                                         ii
The technical data in this document is controlled under the U.S. Export Regulations; release to foreign persons may require an export authorization.
This research was carried out at the Jet Propulsion Laboratory, California Institute of Technology, under a
contract with the National Aeronautics and Space Administration.
Reference herein to any specific commercial product, process, or service by trade name, trademark,
manufacturer, or otherwise, does not constitute or imply its endorsement by the United States
Government or the Jet Propulsion Laboratory, California Institute of Technology.
© 2021. California Institute of Technology. Government sponsorship acknowledged.
Note:
The users' guide is designed to be a living document that describes the ECOSTRESS DisALEXI-
JPL evapotranspiration (ET) product. The document describes the current state of the art, and is
revised as progress is made in the development and assessment of the ET product. The primary
purpose of the document is to present an overview of the ECOSTRESS L3 DisALEXI-JPL data
product to the potential user. For more detailed information on the physical basis and algorithm
details please see the Algorithm Theoretical Basis Document (ATBD).
3Change History Log
Revision Effective Date Prepared by Description of Changes
Draft 5/5/2021 Kerry Cawse-Nicholson User Guide first draft
4Contacts
Readers seeking additional information about this product may contact the following:
• Kerry Cawse-Nicholson
MS 183-501
Jet Propulsion Laboratory
4800 Oak Grove Dr.
Pasadena, CA 91109
Email: Kerry-anne.cawse-nicholson@jpl.nasa.gov
Office: (818) 354-1594
• Martha C. Anderson
Hydrology and Remote Sensing Laboratory
USDA - ARS
103000 Baltimore Ave
Beltsville, MD 20705
Email: martha.anderson@ars.usda.gov
Office: (301) 504-6616
• Simon J. Hook
MS 183-501
Jet Propulsion Laboratory
4800 Oak Grove Dr.
Pasadena, CA 91109
Email: simon.j.hook@jpl.nasa.gov
Office: (818) 354-0974
Fax: (818) 354-5148
5Contents
Figures ............................................................................................................................................ 7
Tables ............................................................................................................................................. 7
1 Introduction .......................................................................................................................... 8
1.1 File format for L3 products ........................................................................................... 8
1.2 DisALEXI-JPL ET Product .......................................................................................... 9
1.3 Product Availability ...................................................................................................... 9
2 ECOSTRESS_L3_ET Product ........................................................................................... 9
2.1 Algorithm Description .................................................................................................. 9
2.2 Scientific Data Sets (SDS) .......................................................................................... 12
2.3 Attributes..................................................................................................................... 12
2.4 Quality Flag ................................................................................................................ 14
3 References ........................................................................................................................... 15
6Figures
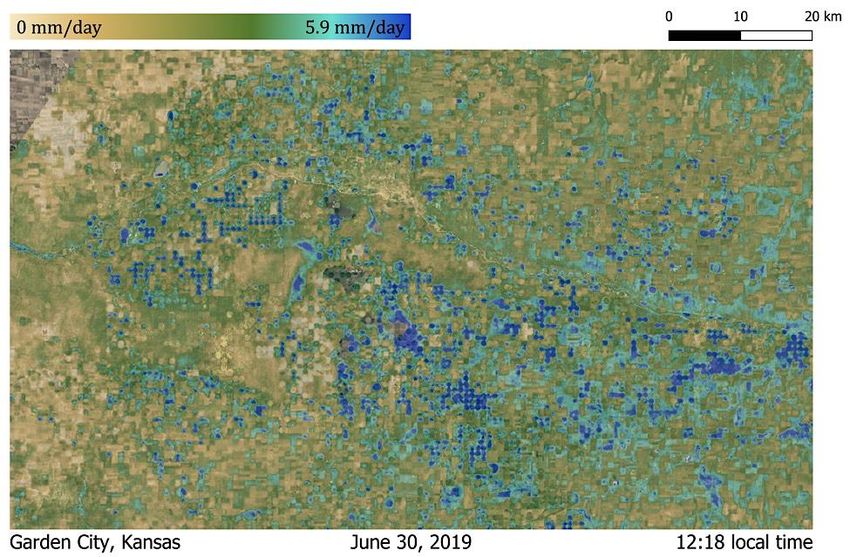
Figure 1. Example ECOSTRESS L3 Evapotranspiration (ET) scene produced by DisALEXI-JPL over Garden City
Kansas, acquired on June 30, 2019.
...........................................................................................................................................................................
10
Figure 2. Conceptual diagram describing computation of L3(ALEXI_ET) evapotranspiration
...........................................................................................................................................................................
11
Tables
Table 1: Summary of the ECOSTRESS LST&E product. ............................................................................................... 9
Table 2: ECOSTRESS input products and ancillary data required to produce the L2 LST&E product. ......................... 11
Table 3. The Scientific Data Sets (SDS) in the ECOSTRESS L2 product. ..................................................................... 12
Table 4. Standard product metadata included in all ECOSTRESS products. .................................................................. 12
Table 5.Product specific metadata for the ECOSTRESS L2 product. ............................................................................. 13
Table 6. Bit flags defined in the QC SDS in the MxD21_L2 product. (Note: Bit 0 is the least significant bit). ............. 14
Table 7. The SDSs in the ECOSTRESS L2 Cloud product.
........................................................................................................................................................................... Er
ror! Bookmark not defined.
Table 8. The metadata definition in the ECOSTRESS L2 Cloud product.
........................................................................................................................................................................... Er
ror! Bookmark not defined.
71 Introduction
This is the user guide for the ECOSTRESS Level-3 DisALEXI-JPL (evapotranspiration (ET)
product. The L3 product uses a physics-based surface energy balance (SEB) algorithm to retrieve
estimates of daily ET using the ECOSTRESS L-2 land-surface temperature and emissivity
(LST&E) products, along with ancillary meteorological data and remotely sensed vegetation
cover information. The output ET is generated in an HDF5 format consistent with ECOSTRESS
L-2 products. A future implementation will include data projected onto a 70 m grid. The
algorithm is based on spatial disaggregation of regional-scale fluxes from the Atmosphere Land
Exchange Inverse (ALEXI) SEB model, and this is an extension of the DisALEXI-USDA
product that is available over selected sites at 30 m resolution. DisALEXI-JPL has been
evaluated in comparison with micrometeorological flux tower observations over crop, forest,
grassland, wetland and semiarid desert sites.
The algorithms and data content of the ET product are briefly described in this guide, with the
purpose of providing a user with sufficient information about the content and structure of the
data files to enable the user to access and use the data, in addition to understanding the
uncertainties involved with the product and how to interpret the mask information. Overviews of
the file formats and provided first followed by descriptions of the algorithm and product contents
including all metadata. Publications and documents related to the ECOSTRESS ET products are
listed in the final section.
A description of the major components of the ECOSTRESS algorithm implemented in version 1
of the DisALEXI-JPL ET code provided in the ATBD available at
https://ecostress.jpl.nasa.gov/products.
1.1 File format for L3 products
The ECOSTRESS ET products are distributed in HDF5 format and can be read in by HDF5
software. Information on Hierarchical Data Format 5 (HDF5) may be found at
https://www.hdfgroup.org/HDF5/. The HDF format was developed by NCSA, and has been
widely used in the scientific domain. HDF5 can store two primary types of objects: datasets and
groups. A dataset is essentially a multidimensional array of data elements, and a group is a
structure for organizing objects in an HDF5 file. HDF5 was designed to address some of the
limitations of the HDF4. Using these two basic objects, one can create and store almost any kind
of scientific data structure, such as images, arrays of vectors, and structured and unstructured
grids. They can be mixed and matched in HDF5 files according to user needs. HDF5 does not
limit the size of files or the size or number of objects in a file. The scientific data results are
delivered as SDSs with local attributes including summary statistics and other information about
the data. More detailed information on HDF5 data types may be found in the L3 Product
Specification Document (PSD) available at https://ecostress.jpl.nasa.gov/products.
The ECOSTRESS ET data product files contain one set of Attributes (metadata) describing
information relevant to production, archiving, user services, input products, geolocation and
analysis of data, as well as provenance and Digital Object Identifier (DOI) of the product
attached to the root group (the file). The attributes listed in Table 4 are not described further in
this user guide.
81.2 DisALEXI-JPL ET Product
The ECOSTRESS DisALEXI-JPL ET data product is produced for ECOSTRESS overpass dates
in swath format, yielding estimates of daily integrated ET for pixels that were flagged as clear-
sky in the input L2 LST&E product. The JPL product is generated CONUS-wide. Table 1 shows
a summary of the L3 product characteristics.
Other data product levels briefly described: Level 1B (L1B) is a swath (scene) of measured
radiance data geolocated to latitude and longitude centers of 70m resolution pixels. A Level 2
(L2) product is a geophysical product retrieved from the L1B data that remains in latitude and
longitude orientation; it has not been temporally or spatially manipulated. The Level 3 and 4 (L3,
L4) ECOSTRESS products consist of higher level geophysical variables output from models
(evapotranspiration, evaporative stress index, water use efficiency) derived from the L2 and
other ancillary data.
Table 1: Summary of the ECOSTRESS DisALEXI-JPL ET product.
Earth Science Data Product Data Spatial Grid/swath Map
Type (ESDT) Level Dimension Resolution Projection
ECOSTRESS_L3_ET L3 Approximately 30 m gridded UTM
(USDA) 3000 lines by
3000 samples
ECOSTRESS_L3_ET L3 5400 x 5632 ~70 m swath Geographic
(JPL)
1.3 Product Availability
The ECOSTRESS L3 product will be made available at the NASA Land Processes Distribution
Active Archive Center (LPDAAC), https://earthdata.nasa.gov/ and can be accessed via the
Earthdata search engine (initially only available to early adopters; for access see
https://ecostress.jpl.nasa.gov/applications).
2 ECOSTRESS_L3_ET Product
2.1 Algorithm Description
The basic processing steps involved in L3 ET product generation are outlined schematically in
Fig. 2 - for a full detailed description of the DisALEXI-JPL processing scheme please see the
ATBD at https://ecostress.jpl.nasa.gov/products. The energy balance model employed here is a
multi-scale system designed to generated self-consistent flux assessments from field to
regional/continental scales (Anderson, 2003). The regional Atmosphere-Land Exchange Inverse
(ALEXI) model relates time-differential LST observations from geostationary satellites to the
time-integrated energy balance within the surface-atmospheric boundary layer system (Anderson
et al., 1997, 2007). ALEXI has minimal reliance on absolute (instantaneous) air or surface
9temperature input data, and therefore provides a relatively robust flux determination at the coarse
geostationary pixel scale. For finer scale ET applications, ALEXI flux fields can be spatially
disaggregated using higher resolution LST information from ECOSTRESS, polar orbiting
systems (e.g., Landsat or MODIS), or from aircraft using an algorithm referred to as DisALEXI-
JPL (Norman et al., 2003; Anderson et al., 2004; Cammalleri et al., 2013, 2014; Anderson et al.,
2018). Both ALEXI and DisALEXI-JPL use the two-source energy balance (TSEB; Norman,
1995; Kustas, 1999) land-surface representation to partition surface fluxes between the canopy
and the soil.
Figure 1. Example ECOSTRESS L3 Evapotranspiration (ET) scene produced by DisALEXI-JPL over
Garden City Kansas, acquired on June 30, 2019.
Data inputs to the ECOSTRESS L2 algorithm are listed in Table 2. Baseline ALEXI daily ET
fluxes are produced at 4km resolution over CONUS using hourly morning LST retrievals from the
East and West Geostationary Operational Environmental Satellites covering CONUS. Primary
high resolution remote sensing inputs to DisALEXI-JPL are LST, leaf area index (LAI; used in
the soil/canopy partitioning) and surface albedo (used to compute net radiation). For the L3 ET
product, LST is obtained from the L2 LST&E product, while albedo and LAI are computed from
Landsat spectral reflectance (SR) data. Gridded meteorological inputs (solar radiation, wind speed,
vapor pressure, atmospheric pressure and air temperature) are obtained from the Climate Forecast
System Reanalysis (CFRS) dataset at native resolution of 0.25 degrees (Saha, 2010).
10Figure 2. Conceptual diagram describing computation of L3 (ECO3ETALEXI) evapotranspiration, along
with required inputs.
Table 2: ECOSTRESS input products and ancillary data required to produce the L3 DisALEXI-JPL ET
product.
Ancillary Data Set Long Name Data Used
ECOSTRESS_L2 ECOSTRESS Level-2 Land-surface temperature
land-surface temperature
and emissivity
ECOSTRESS_L1B_GEO Geolocation Land/ocean mask
Elevation
Sensor and solar zenith angles
Latitude, Longitude
Landsat Surface Landsat Surface Multi-band surface reflectance
Reflectance product Reflectances, Collection 1
(EROS)
MCD15A3H MODIS/Terra+Aqua Leaf Leaf Area Index
Area Index/FPAR 4-Day
L4 Global 500 m SIN Grid
V006
CFSR Climate Forecast System Air temperature, wind speed,
Reanalysis mixing ratio, atmospheric pressure
NLCD National Land Cover Landcover classification
Dataset
112.2 Scientific Data Sets (SDS)
The ECOSTRESS Level-3 DisALEXI-JPL ET product contains 3 scientific data sets (SDSs):
ETdaily, ETdailyUncertainty, and QualityFlag. All SDS data are output ECOSTRESS native
swath resolution. The ETdailyUncertainty data reflect the uncertainty ET associated with the
error reported for the L2 ECOSTRESS LST inputs (LST_Err). Details of each SDS including
data type and units are shown in Table 3.
Table 3. The Scientific Data Sets (SDS) in the ECOSTRESS L3 ET product.
Field Name Type Unit Field Data
GROUP EVAPOTRANSPIRATION ALEXI
ETdaily Float mm/day
ETdailyUncertainty Float mm/day
QualityFlag UInt16
2.3 Attributes
Archived with the SDS are attributes (metadata) describing characteristics of the data. Contents
of these attributes were determined and written during generation of the product at JPL by the
Process Control System (PCS) and are used in archiving and populating the database at the
LPDAAC to support user services. They are stored as very long character strings in parameter
value language (PVL) format. Descriptions of the attributes are given here to assist the user in
understanding them. ECOSTRESS products consist of a set of standard metadata (Table 4) and
product-specific metadata (Table 5). The product specific metadata in Table 5 give details on
ancillary data sets and average ET uncertainty values for the entire scene.
Table 4. Standard product metadata included in all ECOSTRESS products.
Name Type Size Example
Group StandardMetadata
AncillaryInputPointer String variable Group name of ancillary file list
AutomaticQualityFlag String variable PASS/FAIL (of product data)
BuildID String variable
CampaignShortName String variable Primary
CollectionLabel String variable
DataFormatType String variable NCSAHDF5
DayNightFlag String variable
EastBoundingCoordinate LongFloat 8
HDFVersionID String variable 1.8.16
ImageLines Int32 4 5400
ImageLineSpacing Float32 4 70
ImagePixels Int32 4 5632
ImagePixelSpacing Float32 4 70
InputPointer String variable
InstrumentShortName String variable ECOSTRESS
12LocalGranuleID String variable
LongName String variable ECOSTRESS
NorthBoundingCoordinate LongFloat 8
PGEName String variable L3_ET_ALEXI
PGEVersion String variable
PlatformLongName String variable ISS
PlatformShortName String variable ISS
PlatformType String variable Spacecraft
ProcessingLevelID String variable 3
ProcessingLevelDescription String variable Level 3 Evapotranspiration ALEXI
ProducerAgency String variable
ProducerInstitution String variable JPL
ProductionDateTime String variable
ProductionLocation String variable
RangeBeginningDate String variable
RangeBeginningTime String variable
RangeEndingDate String variable
RangeEndingTime String variable
SceneID String variable
ShortName String variable L3_ALEXI
SISName String variable
SISVersion String variable Final
SouthBoundingCoordinate LongFloat 8
StartOrbitNumber String variable
StopOrbitNumber String variable
WestBoundingCoordinate LongFloat 8
Table 5.Product specific metadata for the ECOSTRESS L3 ET product.
Name Type Size Example
Group L3_ET_ALEXI Metadata
QualityBitFlag String 255 01011011011
AvgETUncertainty LongFloat 8
AncillaryFiles Int 4 100
AncillaryFileAirTemperature String 255 CFSR_FILENAME_DATE
AncillaryFileALEXIETd String 255 EDAY_V7NC_CFSRINSOL_2018200.dat
AncillaryFileBadMask String 255
AncillaryFileInsolation String 255 CFSR_FILENAME_DATE
AncillaryFileLandcover String 255 NLCD_FILENAME
AncillaryFileLST String 255 LSTE_FILENAME
AncillaryFileMixingRatio String 255 CFSR_FILENAME_DATE
AncillaryFilePressure String 255 CFSR_FILENAME_DATE
AncillaryFileSurfaceReflectance String 255 LANDSAT_TARFILE_NAME
AncillaryFileSurfReflectanceFill String 255
AncillaryFileWindSpeed String 255 CFSR_FILENAME_DATE
BandSpecification Float32 6
Projection String 255 ECOSTRESS
13Geotransform String 255
OGC Well Known Text String variable Blank if Projection=ECOSTRESS
If Projection=UTM, EG:
{PROJCS["UTM_Zone_11N",GEOGCS["GCS_WG
S_1984",DATUM["D_WGS_1984",SPHEROID["
WGS_1984",6378137.0,298.257223563]],PRIM
EM["Greenwich",0.0],UNIT["Degree",0.017453
2925199433]],PROJECTION["Transverse_Merca
tor"],PARAMETER["False_Easting",500000.0],P
ARAMETER["False_Northing",0.0],PARAMETER[
"Central_Meridian",-
117.0],PARAMETER["Scale_Factor",0.9996],PAR
AMETER["Latitude_Of_Origin",0.0],UNIT["Mete
r",1.0]]}
2.4 Quality Flag
Indicators of data quality are described in the quality flag SDS generated during production. The
QualityFlag SDS provides information on regarding cause of missing data in the L3 DisALEXI-
JPL ET product. A successful ET retrieval for a given pixel requires 1) good quality clear-sky L2
LST data are available, 2) good quality surface reflectance data are available from bracketing
Landsat overpass date, 3) an ALEXI retrieval is available for the 4-km ALEXI grid cell
encompassing the 70-m target pixel; and 4) the pixel is designated as land in the NLCD
(retrievals for open water bodies are not conducted). These conditions are tracked in the
QualityFlag SDS at the pixel level. The QualityFlag SDS unsigned 8-bit data are stored as bit
flags in the SDS. This QC information can be extracted by reading the bits in the 8-bit unsigned
integer.
Table 6. Bit flags defined in the QC SDS in the L3 ALEXI ET product. (Note: Bit 0 is the least significant
bit).
Bit Field Long Name Result
0 Pixel computed 0 = yes
1 = no
1 Good quality LSTE available 0 = yes
1 = no
2 Good quality Surface Reflectance data available 0 = yes
1 = no
3 ALEXI data available 0 = yes
1 = no
4 Other (land pixel, etc.) 0 = yes
141 = no
Acknowledgements
We thank Martha Anderson, Munish Sikka, Erin Wong, Gregory Halverson, Chris Hain, Feng
Gao, Bill Kustas, John Norman, Carmelo Cammalleri, Peijuan Wang, Kate Semmens, Yun Yang,
Wayne Dulaney, Liang Sun, and Yang Yang for contributions to the algorithm development
described in this User Guide.
3 References
Anderson, M.C., Norman, J.M., Diak, G.R., Kustas, W.P., & Mecikalski, J.R. (1997). A two-
source time-integrated model for estimating surface fluxes using thermal infrared remote
sensing. Remote Sens. Environ., 60, 195-216
Anderson, M.C., W. P. Kustas, and J. M. Norman, (2003). Upscaling and downscaling—A
regional view of the soil–plant–atmosphere continuum. Agron. J., 95, 1408–1423.
Anderson, M.C., Norman, J.M., Mecikalski, J.R., Torn, R.D., Kustas, W.P., & Basara, J.B.
(2004). A multi-scale remote sensing model for disaggregating regional fluxes to
micrometeorological scales. J. Hydrometeor., 5, 343-363
Anderson, M.C., Norman, J.M., Mecikalski, J.R., Otkin, J.A., & Kustas, W.P. (2007). A
climatological study of evapotranspiration and moisture stress across the continental U.S.
based on thermal remote sensing: I. Model formulation. J. Geophys. Res., 112, D10117,
doi:10.1029/2006JD007506
Anderson, M.C., Gao, F., Knipper, K., Hain, C., Dulaney, W., Baldocchi, D.D., Eichelmann, E.,
Hemes, K.S., Yang, Y., Medellín-Azuara, J., & Kustas, W.P. (2018). Field-scale assessment
of land and water use change over the California Delta using remote sensing. Remote Sens.,
10, 889
Cammalleri, C., Anderson, M.C., Gao, F., Hain, C.R., & Kustas, W.P. (2013). A data fusion
approach for mapping daily evapotranspiration at field scale. Water Resources Res., 49, 1-15,
doi:10.1002/wrcr.20349
Cammalleri, C., Anderson, M.C., Gao, F.H., C.R., & Kustas, W.P. (2014). Mapping daily
evapotranspiration at field scales over rainfed and irrigated agricultural areas using remote
sensing data fusion. Agric. For. Meteorol., 186, 1-11
Gao, F., Kustas, W.P., Anderson, M.C., (2012a). A data mining approach for sharpening thermal
satellite imagery over land. Remote Sens. 4, 3287–3319. http://dx.doi.org/10.3390/rs4113287.
15Gao, F., Anderson, M.C., Kustas, W.P., Wang, Y., (2012b). Simple method for retrieving leaf
area index from Landsat using MODIS leaf area index products as reference. J. Appl.
Remote. Sens. 6, 63554. http://dx.doi.org/10.1117/1.JRS.6.063554.
Kustas, W. P., and J. M. Norman (1999), Evaluation of soil and vegetation heat flux predictions
using a simple two-source model with radiometric temperatures for partial canopy cover,
Agric. For. Meteorol., 94, 13– 25.
Norman, J. M., Kustas, W. P., & Humes, K. S. (1995). A two-source approach for estimating soil
and vegetation energy fluxes from observations of directional radiometric surface
temperature. Agricultural and Forest Meteorology, 77, 263-293.
Norman, J.M., Anderson, M.C., Kustas, W.P., French, A.N., Mecikalski, J.R., Torn, R.D., Diak,
G.R., Schmugge, T.J., & Tanner, B.C.W. (2003). Remote sensing of surface energy fluxes at
101-m pixel resolutions. Water Resour. Res., 39
Saha, S., S. Moorthi, H. Pan, X. Wu, J. Wang, S. Nadiga, P. Tripp, R. Kistler, J. Woollen, D.
Behringer, H. Liu, D. Stokes, R. Grumbine, G. Gayno, J. Wang, Y. Hou, H. Chuang, H.H.
Juang, J. Sela, M. Iredell, R. Treadon, D. Kleist, P. Van Delst, D. Keyser, J. Derber, M. Ek, J.
Meng, H. Wei, R. Yang, S. Lord, H. van den Dool, A. Kumar, W. Wang, C. Long, M.
Chelliah, Y. Xue, B. Huang, J. Schemm, W. Ebisuzaki, R. Lin, P. Xie, M. Chen, S. Zhou, W.
Higgins, C. Zou, Q. Liu, Y. Chen, Y. Han, L. Cucurull, R.W. Reynolds, G. Rutledge, and M.
Goldberg, 2010: The NCEP Climate Forecast System Reanalysis. Bull. Amer. Meteor.
Soc., 91, 1015–1058, https://doi.org/10.1175/2010BAMS3001.1
16You can also read