Getting to zero A practical policy commission to deliver decarbonisation in the UK - Onward
←
→
Page content transcription
If your browser does not render page correctly, please read the page content below

Getting to zero

    A practical policy commission
to deliver decarbonisation in the UK

         Ted Christie-Miller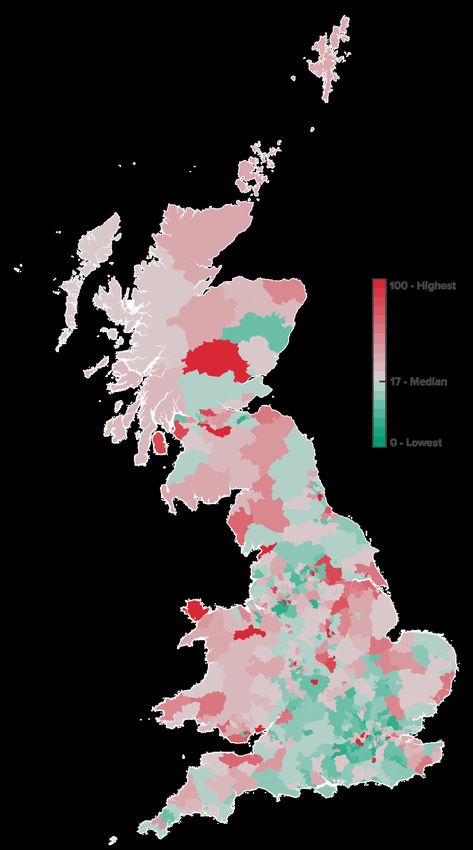
About Onward
Onward is a campaigning thinktank whose mission is to develop new ideas for the next
generation of centre right thinkers and leaders. We exist to make Britain fairer, more
prosperous and more united, by generating a new wave of modernising ideas and a fresh
kind of politics that reaches out to new groups of people. We believe in a mainstream
conservatism – one that recognises the value of markets and supports the good that
government can do, is unapologetic about standing up to vested interests, and assiduous in
supporting the hardworking, aspirational and those left behind.

Our goal is to address the needs of the whole country: young as well as old; urban as well as
rural; and for all parts of the UK – particularly places that feel neglected or ignored in
Westminster. We will achieve this by developing practical policies that work. Our team has
worked both at a high level in government and for successful thinktanks. We know how to
produce big ideas that resonate with policymakers, the media and the public. We will engage
ordinary people across the country and work with them to make our ideas a reality.

Onward is an independent, not-for-profit thinktank, registered in England and Wales
(Company Registration no. 11326052).

Thanks

Onward is a small non-profit that relies on the generosity of our donors and
patrons to do our work. We are particularly grateful to our partners for the Getting to zero
programme - the European Climate Foundation, the Purpose Foundation and the Quadrature
Climate Foundation.

We would like to thank Milo Boyd and James Blagden for their research support and Jess
Hopwood for her help with design. We also would like to thank the co-chairs and steering
group for the Getting to zero programme for their thoughtful comments and challenge.

About the programme

This year-long programme of work, culminating at COP26 in November 2021, will explore the
practical challenges to net zero and set out a series of bold, deliverable and politically
possible policies to achieve it.

It will be framed around how the green transition can be aligned to the economic recovery,
turbocharging green growth and levelling up productivity rates and employment levels across
the whole of the UK. It will focus on three core components: a large-scale analysis of key
incumbent industries; research on the green skills and jobs opportunity; and an exploration of
the possibility for future innovation to materially drive down or capture emissions at the pace
required.

The programme follows on from Onward’s 2019 report, Costing the Earth, which set out the
case for decarbonisation through innovation and greater government accountability. This,
combined with Onward's work on levelling up and political strategy ahead of the 2019
election, puts Onward in an ideal position to be a bold voice for practical and politically
possible decarbonisation policy.

About the author

Ted Christie-Miller joined Onward in January 2019 and has since authored a number of
research reports including Onward's first report on net zero policy, Costing the Earth. He is
now the Programme Manager for the Getting to zero programme at Onward. During his time
at Onward he has had articles published in The Telegraph, CityAM, ConservativeHome,
Reaction and BusinessGreen.

Before joining Onward he worked on energy policy in the Central Government team at
Instinctif Partners. He graduated from the University of Edinburgh in 2018 with a Masters
degree in History.

Contents

Foreword                   1

Summary of the Argument    4

The state of play          7

The net zero challenge    20

Conclusion                33

Our steering group        35

Endnotes                  37
Foreword

Twenty-nine years is not a long time. It took longer for politicians to approve a third
runway at Heathrow and will take nearly as long to complete HS2. But twenty-nine years
is the timescale we have set ourselves and the rest of the world to reduce net carbon
emissions to zero.

It is a breakneck pace made necessary by our own past failures to regulate and moderate
environmentally damaging behaviour. We have a moral responsibility as well as an
ecological imperative to act - and with the international climate summit COP26 being held
in Glasgow in 2021, the UK has an opportunity to lead.

But in doing so we must not be naive about the changes in industrial and human
behaviour needed to decarbonise the economy, and the political trade offs that will
follow. Yes, there are huge opportunities for a more sustainable, resilient and prosperous
society. And we share the optimism of many that scientific innovation, responsible
business investment and enlightened political leadership will help achieve this
phenomenal feat.

But it is undeniable, too, that many jobs will be lost, totemic industries will become
unviable and the prices for some goods may rise. And perhaps most notably, given
divisions in Britain today, these changes will affect different places in markedly different
ways - as the South Yorkshire industries and Midlands auto manufacturers we used to
represent in Parliament will testify.

Analysis for Onward released today [in this report] suggests there will be as many as 10
million high emitting jobs disrupted by the transition to net zero over the next three
decades. More than half (52%) are concentrated in the North, Midlands or Scotland. In
some of Britain’s poorest regions more than two in five jobs are in a high-emitting
industry, compared to less than one in four in London.

In the last two decades, climate policy has gone from one of the most contested areas of
policy to an area of genuine cross party consensus. All major parties at the 2019 General
Election had net zero targets in their manifestos. Recent polling suggests that all regions,
age groups and ethnicities now support decarbonisation. As we make difficult choices,
we must preserve this coalition of support by ensuring there is no-one and nowhere left
behind.

This is why we are delighted to co-chair Onward’s Getting to zero programme, which will
spend the next twelve months developing policies that will not only help to achieve net
zero, but do so in a way that is sensitive to what is politically possible and practical to
deliver. We will examine three distinct challenges, each of which are prerequisites for
success.

Getting to zero                                                                                2

The first is the vexed question of how to decarbonise incumbent industries. Four
industries are responsible for three quarters of the UK’s emissions (Manufacturing;
Transport and Storage, Electricity, gas, steam and air conditioning supply; and consumer
expenditure). Many of the most carbon intensive industries are made up of deeply-rooted
businesses that have sustained communities and supply chains for generations: farming,
steel, oil and gas, auto and aerospace, chemicals. We must sensitively but urgently
tenable adaption, easing any friction and anticipating the fallout that can accompany
wholesale industrial change.

Second, we will examine the labour market implications of net zero. The transition to net
zero may well create millions of new jobs to replace those it disrupts, but it is far from
clear that they will be in the same places - like North Wales of the North Sea Basin -or
available to the same workers as before. What are we doing to support people to retrain
or progress into the new economy, rather than being left despondent in the old?

Last, we need to create the conditions for inventors and innovators to overcome some of
the constraints that currently limit our ability to act. Government has a poor record in
picking winners but it does set the rules of the game. Whether batteries, carbon capture
and reduction, use of different fuel sources like hydrogen, policymakers must develop
new regulatory, tax and policy incentives to encourage change.

We will conclude ahead of COP26 in November this year, when the UK will be the stage
for the most important international climate summit to date. The current pandemic has
shown us that nature still holds the power to transform our lives - and the vaccine reveals
that with scientific endeavour, political will and international action we can wrestle back
control. In the next year, ahead of COP26, we must do so again - once again with the UK
leading the way.

              Dame Caroline Spelman                                      Rt Hon Caroline Flint

  Co-Chair & Former Secretary of State for Environment,   Co-Chair & Former Shadow Secretary of State for Energy
                 Food and Rural Affairs                                   and Climate Change

Getting to zero                                                                                       3
Summary of
            the argument

Getting to zero            4
The UK has less than a year to go until it hosts the UN Climate Change Summit (COP26)
in Glasgow and under three decades to achieve a net zero emission economy. The clock
is ticking on our moral and legal obligations to the environment and to future generations.

We have made considerable progress since the first UN Climate Change Summit in 1995.
In the last 30 years, the UK has decarbonised at the fastest rate in the G7, and faster than
many other OECD countries. In 2018, the UK was the first major economy to legislate for
Net zero emissions by 2050, prompting China, Japan, France and South Korea to follow
suit. With the USA expected to join the club in 2021, more than three fifths of global CO2
emissions, and three quarters of global GDP, will shortly be subject to legally binding net
zero targets. On current distribution, 73% of coal, 58% of oil and 49% of gas will be
covered.1

But we have a long, long way to go. Over the last three decades global emissions have
risen sharply, despite broad knowledge of the risks. Some of the reductions in the West
have been as a consequence of moving highly emitting manufacturing and heavy industry
from the West into the developing world, often resulting in higher - not lower - overall
emissions. Others have only recently begun to pay off, such as policies to encourage the
development and use of clean technologies like offshore wind and battery technology.

The environment will be one of the defining policy challenges of this generation of
policymakers, voters and industry leaders. We have the target but not the policy or
political playbook to get there. The changes that politicians describe - the wholesale shift
to electric vehicles, the decarbonisation of housing, or the introduction of effective carbon
pricing and taxes, for example - will all demand enormous behavioural changes on the
part of workers, consumers, shareholders and businesses. If the next three decades are
to undo the limited progress of the last three, we urgently need a practical, politically
tested plan for action.

This is why Onward is delighted to launch Getting to zero, a practical policy programme
designed to develop our understanding of what is required to deliver net zero and to
generate the policies that can get us there. The programme of work is a serious
endeavour, co-chaired by Dame Caroline Spelman, the former Secretary of State for
Environment, Food and Rural Affairs, and Rt Hon Caroline Flint, former Shadow Secretary
of State for Energy and Climate Change. We are thrilled that it also includes a wealth of
experience in the form of policy thinkers, business leaders and representatives of
different political parties.

Getting to zero                                                                            5

This launch report sets out the state of play: where we are and where are the risks. We
explore specifically the labour market risks from decarbonisation and the density of
carbon intensive jobs, revealing a strong overlap between areas that are reliant on
emitting industries for jobs and the areas who are economically vulnerable - and
politically volatile - in other ways. This speaks to the central challenge we are trying to
address: how can we successfully decarbonise the economy without leaving already
vulnerable people and places further behind? How can we make net zero an opportunity,
rather than a threat?

In the following year, we will explore that question in a number of contexts, looking at
how to decarbonise incumbent industries, what we could do to retrain and upskill those
whose jobs are linked to emissions, and how to better leverage the UK’s research and
technological expertise by creating a conditions for innovation. We look forward to
working with you as we do that.

Getting to zero                                                                            6
The state of play

Getting to zero         7
Since Margaret Thatcher became the first world leader to call for climate change
mitigation in 1989, global emissions have remained on a consistent upward trajectory.
There have been dozens of international agreements and commitments, including 25
Conference of the Parties (COP) meetings since the first UN Climate Change Summit in
1995, but overall collective action has failed to halt the global rise in greenhouse gas
emissions.

1. Despite global climate change policies, greenhouse gas emissions have risen, not
declined, since 1990.

   •   Concentrations of CO2 in the atmosphere are higher today than at any time in
       three hundred thousand years of global history. CO2 concentration in the
       atmosphere is now over 408 parts per million (ppm), up from 354 ppm in 1990 and
       275 ppm before the Industrial Revolution. Before this, carbon concentration in the
       atmosphere had remained stable for two thousand years as Figure 2 shows. Not
       only is the trend going upward, but it is doing so in a fairly linear fashion. The
       financial crisis, which led to losses of over $2 trillion worldwide, does not even
       feature in the relentless rise in global emissions.

   •   This has happened alongside rising public consciousness about the dangers of
       climate change, supported by growing political and media interest. Since 2004,
       world newspaper coverage of climate change or global warming has risen six-
       fold.2 There is also clear public demand for action to tackle climate change.
       Onward research from 2019 found that every age group believes the Government
       should do more to tackle climate change.3 Despite a huge rise in awareness of the
       problem, the data shows we have categorically failed at finding adequate
       solutions so far.

   •   But, there are signs that the Paris Agreement marked a turning point in 2015. More
       than three fifths of global CO2 emissions, and three quarters of global GDP, will
       shortly be subject to legally binding net zero targets.4 This is new and is a product
       of the Paris Accord. Only time will tell how much this reduces emissions in real
       terms.

Getting to zero                                                                            8
Figure 1: Global CO2 atmospheric concentration: global annual mean concentration of
CO2 (ppm).
Source: Our World in Data; Dieter Helm.
420
410
400
390
380
370
360
350
340
330
320
16
90
98
12
14
10
18
06
02
04
96
92
94
00
08
20
20
20
20
20
19
19
20
19
19
19
20
20
20
20
Figure 2: CO2 concentration since 01AD
Source: Our World in data; Dieter Helm.
450
400
Concentration
350
300
250
200
1 501 1001 1501 2001
Year
Getting to zero 92. This rise has been mostly due to an increased demand in fossil fuels over the past
thirty years
• Before 1990, coal and oil were dominant. Gas was illegal to burn in the US and
Europe. Since then, gas use has risen by 64% in the US and by 30% in Europe. 5 In
that time, gas has replaced nuclear energy in many countries, especially in
Western Europe and the United States. In 1990, the typical household in the US
and Europe had an energy mix of 80% coal and 20% nuclear. The same
household today is now more likely to be 40% gas and less than 40% coal, as
Dieter Helm has noted.6 Despite the progress made in recent years, renewables
are responsible for just 2.2% of global energy consumption.7 Gas has given the
developed world a higher emitting and cheaper option than both renewables and
nuclear for much of that period.
• This is not to say that coal and oil have not performed strongly over this period.
Almost all of the world’s cars and heavy goods vehicles (HGVs) still use internal
combustion engines. Since 1990, the world has added 100 million vehicles to the
existing fleet of 1.2 billion, of which 300 million were produced in highly emitting
China.8 The number of aircraft worldwide has doubled roughly every 15 years from
around 5,000 in 1990 to 26,000 today. Petrochemical demand has also grown
significantly and is set to be the main driver of oil demand in coming years with
projections of 10 million barrels per day (mdb) through to 2030.
• Coal has overseen a dramatic increase in usage too, largely due to developing
countries such as China and India. China is responsible for over half (53%) the
world's coal consumption today, up from 23% in 1990.9 To put this into
perspective, the world’s coal consumption has grown by 73% since 1990 and
China has still managed to double their proportion of consumption in this time.10
The emissions saved by the UK’s entire coal phase-out would be offset by just a
few weeks of China’s current coal usage. In 1990, China’s GDP was just USD$360
billion. By 2018 it had grown 38-fold, to $13.6 trillion, in no small part due to coal.
Getting to zero 10Figure 3: Global primary energy consumption, measured in TWh per year.
Source: Vaclav Smil (2017); Energy Transitions: Global and National Perspectives; & BP Statistical Review of
World Energy; Our World In Data
3. This increased demand for fossil fuels has been driven by an expansion of
industrial and manufacturing sectors in developing countries.
• The UK manufacturing industry has decarbonised industry and manufacturing by
54% since 1990, the highest rate in the G7.11 This may be due in part to the decline
of this sector relative to the service economy. Since 1990, manufacturing has seen
the amount of jobs plummet by 47%12, with many of these industries opting to
move operations overseas where labour, materials and land is cheaper.
•
The long term collapse of manufacturing and industry has been a common feature
across the whole G7 and historically there has been a strong correlation between
de-industrialisation and a declining rate of emissions. More recently, this has
started to change: as the Climate Change Committee has noted, increased
industrial output in the UK over the last ten years has mostly come from
Getting to zero 11restructuring for reasons unrelated to climate policy. This suggests that arising
industrial output does not always have to coincide with a rise in emissions.13
• While the West has deindustrialised however, the developing world has been
rapidly developing. Over the same period, China and India have seen their
manufacturing and industrial emissions grow by 370% and 280% respectively. It is
no coincidence that these industries have been key turbochargers of growth in
these nations as they developed, with China growing its GDP by 1400% and India
by 580% since 1990.14
Figure 4: Industry and Manufacturing GHG emissions % change from 1990 baseline
(G7 average Vs India & China).
Source: CAIT Climate Data Explorer; Our World in data
4.5
Industry and Manufacturing GHG emissions % change from
4
3.5
3
2.5
1990 baseline
2
1.5
1
0.5
0
-0.5
-1
91
95
96
99
92
98
03
04
07
0
20 1
10
05
06
09
02
93
94
97
13
14
08
11
15
16
12
00
0
9
20
20
20
19
20
20
20
20
20
20
19
20
20
19
19
19
19
19
19
19
20
20
20
20
19
20
China India G7
Getting to zero 124. Climate change policies have been useful drivers of technological innovation and
the phase out of coal
• There have been a number of major technological breakthroughs over the last
thirty years, most notably in the form of electric vehicles and offshore wind. Since
2005, the first time energy from offshore wind came on to the grid in the UK,
offshore wind as an energy source by thousand tonnes of oil equivalent has
increased by more than a million per cent (1,111,000%). In the last ten years the use
of offshore wind as an energy source has soared by 250%.15 In the UK, this has
been driven by both the mobilisation of private capital under the Green
Investment Bank and the policy of Contracts for Difference.
• The same can be said of the more recent growth in electric vehicle (EV) use. EV
ownership has risen by 815230% since 1990, and by 900% in the last ten years.16
While private sector innovation was pivotal in driving this rise - notably the
development of long range, consumer-ready vehicles such as Tesla - the wider
framing of international climate action and awareness provided important political
cover to make this possible.
• The phase-out of coal can also be accredited to international climate
campaigners. Since the Paris Agreement in 2015, the global pipeline of new coal-
fired power stations has fallen by 75%.17 Global agreements have been a driver in
the decline of emissions from power in Europe and the US. Since 2000, power
emissions have declined by 15% in Europe and 23% in the US. We have the
decline of coal to thank for much of this.18
5. While these policies have been effective in the West, they have been less
successful at decarbonising developing economies
• Since the 1990s, the UN has sought to deal with the climate problem through a
top-down approach of collective action and diplomatic agreements. This came in
the form of an annual Climate Change Conference (COP) and a set of multilateral
protocols such as Kyoto and Paris. This included the original target of limiting
global warming to 2°C, later followed by 1.5°C at Paris in 2015. The intention was
that targets would trigger economy-wide decarbonisation among the signatories.
Getting to zero 13• While these conferences and agreements did encourage targets - notably Paris -
these agreements did not stop emerging economies increasing their use of fossil
fuels dramatically. The agreements created structural allowances for greater
emissions growth in emerging economies but less so in industrialised advanced
economies. This was to reflect the lesser historical responsibility of these
economies in causing climate change. This has caused heavier relative cuts in the
West, but in turn it has not held back industrialisation - largely through fossil fuels -
in the developing world. It should be noted that developing countries have in turn
agreed to peak their emissions and ultimately eliminate them later this century,
most notably in the form of China’s 2060 target.
• Since 1990 high emitting activity like manufacturing has moved to countries with
lower labour, regulatory or capital costs. This offshoring of emissions was not
caused by multilateral agreements, but not discouraged either. Evidence from the
Sustainability Research Institute finds that offshoring was instrumental in the
decline in industrial emissions in the West, even more so than efficiency
improvements.19
• This movement of industry has been reflected in the change in emissions
worldwide. Since the Protocol was signed in 1997, the EU bloc has overseen a 21%
fall in greenhouse gas emissions. Meanwhile, China's emissions have nearly
trebled. India's emissions have more than doubled during this time.
Getting to zero 14Figure 5: Total GHG Emissions including LCAF (CAIT)
Source: CAIT Climate Data Explorer; Our World in data
6. The UK has an increasingly impressive record on decarbonisation, particularly in
Heat, Electricity, Industry and Manufacturing
• The UK has decarbonised heat and electricity by roughly half since 1990, the
fastest rate in the G7.20 This was mostly due to the decarbonisation of the power
sector, through substantial reduction in coal-fired generation and a corresponding
increase in the share of renewables in the energy mix, and because the improved
energy efficiency of products has reduced demand for power. Since 1990, the UK
has reduced territorial carbon emissions for coal by 95% (218.8 MtCO2 to 11.7
MtCO2). If coal was still at 1990 levels in the UK, the UK’s carbon emissions would
be 63% higher than they are today.
• To put this in perspective, China has overseen a 540% increase in emissions from
these sectors in the same amount of time, mostly as a result of a reliance on coal
to fuel rapid economic growth. Similarly, India saw a 370% increase in emissions
from these sectors. Similar increases in emissions have been seen in the G7
countries as well. As Figure 6 shows, Canada and Japan have seen increases of
55% and 39% respectively in combined Heat and Electricity emissions.
Getting to zero 15Figure 6: Electricity & Heat (GHG Emissions, CAIT) Million Tonnes of CO2 Equivalent.
Source: World in data
0.8
Electricity & Heat (GHG Emissions, CAIT) Million Tonnes of
0.6
0.4
0.2
CO2 Equiv
0
-0.2
-0.4
-0.6
0
93
94
97
13
14
91
08
20 1
95
96
20 9
92
15
16
12
00
98
20 3
20 4
20 7
20 1
10
05
20 6
09
02
1
0
0
0
0
9
9
0
20
20
20
20
20
19
20
20
19
19
19
20
19
19
19
19
19
19
20
20
Canada France Germany Italy Japan United Kingdom United States
• The UK has decarbonised manufacturing and industry by 54% since 1990, again
the highest rate in the G7. This has been driven by deindustrialisation and the
movement of much of this industry to China and India, where industrial and
manufacturing emissions have risen by 370% and 280% respectively. This trend is
repeated across the developed world: the G7 has experienced a fall in emissions
from manufacturing and industry by a third since 1990.
Getting to zero 16Figure 7: Emissions from Manufacturing & Industry % change from 1990 baseline (G7
Countries)
Source: CAIT Climate Data Explorer; Our World in data
0.2
Emissions from Manufacturing & Industry % change from 1990
0.1
0
-0.1
baseline
-0.2
-0.3
-0.4
-0.5
-0.6
0
93
94
97
13
14
91
08
11
95
96
99
92
15
16
12
00
98
03
04
07
01
10
05
06
09
02
9
20
20
20
20
20
20
19
20
20
19
20
19
19
20
20
20
19
19
19
19
19
19
20
20
20
20
20
Canada France Germany Italy Japan United Kingdom United States
7. The UK have been less successful at decarbonising surface transport and aviation
but are still leading the majority of other countries.
• The UK has failed to decarbonise the transport sector in recent decades.
Emissions from this sector fell by just 0.0001% between 1990 and 2019, largely
due to any efficiency and tech improvements being offset by traffic growth.21
However the UK still leads most of our competitors in Transport emissions, and we
are set to further this lead with the landmark pledge to phase out petrol and diesel
cars by 2030. Looking at all OECD countries and large non-OECD economies, the
only countries to have successfully reduced emissions from surface transport
between 1990 and 2016 are Russia and Lithuania. China’s transport emissions
have grown by eight-fold, and India and Indonesia each by three-fold. In the G7 all
countries have experienced an increase in emissions from transport, with
emissions rising in Canada and the United States the fastest, by 38% and 20%
respectively. The UK is the 7th most successful country at limiting emissions from
Getting to zero 17Transport in the OECD, beaten only by Russia, Lithuania, Estonia, Latvia, Sweden,
Germany and Japan.
• In Aviation, the picture is less positive. The UK has witnessed a 86% rise in
greenhouse gas emissions in this sector since 1990. While country specific time-
series data is not available for aviation emissions, 2018 data for CO2 (MMT)
reveals that the USA is responsible for a quarter (24.4%) of the world’s aviation
emissions and China responsible for an eighth (12.7%). The UK accounts for a far
lower proportion of global aviation emissions (4%), but is still the third highest
emitter in this sector. Close behind the UK are Japan (3.1%), Germany (3%) and the
UAE (2.8%).22
Figure 8: UK Greenhouse Gas Emissions % change from 1990 baseline to 2019
Source: Committee on Climate Change, Provisional Statistics.
100%
80%
UK Greenhouse Gas Emissions % change
60%
40%
20%
0%
-20%
-40%
-60%
-80%
Aviation Surface Buildings F-gases Shipping Agriculture Industry Waste Power
transport & LULUCF
Getting to zero 18Figure 9: Emissions from Transport % change from 1990 baseline (G7 Countries)
Source: CAIT Climate Data Explorer; Our World in data
NB: Data unavailable for selected countries after 2016.
0.5
0.4
Transport emissions relative to 1990 levels
0.3
0.2
0.1
0
-0.1
98
0
05
06
09
02
93
94
97
13
14
91
08
11
95
96
99
92
15
16
12
00
03
04
07
20 1
10
0
9
20
20
20
20
20
20
19
20
20
19
20
19
19
19
20
20
20
20
20
20
19
19
19
19
19
20
Canada France Germany Italy Japan United Kingdom United States
Getting to zero 19The net zero
challenge
Getting to zero 20In 2018, Onward set out principles that should frame the UK’s approach to Net Zero. We
argued the UK should strive to foster innovation, use the market where possible,
maximise the synergies of decarbonisation and most importantly ensure that Britain
continues to lead the way on the world stage, taking more heavily emitting countries with
them. We now need to build a consensus for climate and decarbonisation policy that
goes beyond party allegiance and looks at the practicalities of the net zero transition.
To do this, policymakers and legislators need to focus on the three great challenges of
the net zero transition: supporting incumbent industries to adapt to a net zero future; re-
skilling and retraining workers who may lose out from the transition into new, green jobs;
and providing the conditions that can foster technological innovation in the years ahead.
With creative and thoughtful policy, the UK can not only decarbonise its own economy by
2050, but develop a blueprint for other nations around the world to follow.
1. There are huge challenges ahead for incumbent industries, but there are also
opportunities to be grasped
• Since the industrial revolution, the UK economy has been built on heavy industry,
manufacturing, and fossil fuel extraction. Before 1750, the economy would have
taken around 6,000 years to double in size.23 But the advent of the Industrial
Revolution propelled growth at a faster rate than it had ever before experienced.
Since 1750, our economy has grown on average by 1.5% per year, meaning it has
on average doubled in size every 50 years. We can thank carbon - mostly coal -
for this meteoric rise in GDP growth.
• Since the 1980s, the way in which we rely on fossil fuels has evolved. The UK has
deindustrialised, with a shift from a productive economy to one more focused on
services. As Chapter One set out, this has allowed us to decarbonise faster than
our competitors, removing 44% of our emissions in just thirty years.
• Despite deindustrialisation, the UK continues to rely on production and
construction for 20% - £373 billion - of output.24 Breaking down emissions data by
sector, nearly three quarters of UK emissions come from just four sectors:
Manufacturing; Transport and Storage; Electricity, gas, steam and air conditioning
supply; and consumer expenditure. If the Government are serious about their net
zero ambitions, paving the way for these industries to decarbonise must be a
priority.
Getting to zero 21The first paper of the Getting to zero programme will look at each incumbent industry in turn
and consider what more can be done to help them to decarbonise, quickly and efficiently. In
some of these industries, it will be possible to find a cleaner, more sustainable future. In others,
it may not and policymakers will need to consider ways to facilitate new activity to take its
place. The purpose of the piece will be to outline the huge economic opportunities that are
there to be grasped throughout the net zero transition, as well as uncovering the people and
places where industry, jobs and livelihoods are currently tied to carbon emissions.
Figure 10: Industries by C02 emissions: thousands of Carbon Dioxide equivalent
Source: Greenhouse gas emissions in the United Kingdom, 1990-2018, ONS
500000
Thousand tonnes of carbon dioxide equivalent
400000
300000
200000
100000
0
Housing activities
Manufacturing
Total greenhouse gas
Construction
Other service activities
Education and Arts
Transport and storage
social work activities
Water supply; sewerage,
Electricity, gas, steam and
Consumer expenditure
Mining and quarrying
Administration, Finance and
Wholesale and retail trade;
Agriculture, forestry and fishing
waste management and
Human health and
air conditioning supply
repair of motor vehicles
remediation activities
Professional services
emissions
Getting to zero 222. The people and places who will face the most change are concentrated in the
same places that have been politically volatile in recent years
• The highest emitting industries by the scale of greenhouse gas emission per job
are Electricity, gas, steam and air conditioning supply (0.7 MtCO2 per job); Mining
and quarrying (0.5 MtCO2 per job); and Agriculture, forestry and fishing (0.2
MtC02 per job). Together these industries employ 401,000 people, just 4% of the
British workforce but are responsible for nearly a third (30%) of the country's
emissions. These will unsurprisingly be the industries that will face the biggest
transformation.
• If we look collectively at all the industries responsible for more than 2% of annual
greenhouse gas emissions in the UK, we see that these industries are
concentrated more in some parts of the UK than others. On a regional level, East
Midlands, West Midlands and Yorkshire and the Humber, have the highest
proportion of jobs in high emitting industries: 42%, 41% and 38% respectively. As
Figure 11 shows, the industrial and manufacturing heartlands in the Midlands and
North are far more likely to experience economic disruption during the net zero
transition than the South East and London. This may be positive - in the form of
new green jobs, or it may be negative through job losses - but the fact remains
some places will be affected more than others.
Getting to zero 23Figure 11: Percentage of jobs in high emitting industries.
Source: Business Register and Employment Survey; ONS; Onward analysis
45%
40%
35%
30%
25%
20%
15%
10%
5%
0%
East West Yorkshire North West East North East Wales South West Scotland South East London
Midlands Midlands and the
Humber
• To unpick and understand what the effects of the net zero transition will be on a
more granular level, we have created an index of high emitting jobs by
parliamentary constituency. This is created by multiplying the emissions of each
industry by the proportion of people employed in that industry in each
constituency of the UK. This number is then put on an index scale of 1-100. The
table below shows the scores with the highest and lowest jobs-related emissions
scores. The Map on figure 12 shows how this translates geographically across the
UK.
• As figure 11 shows there is a steep incline in emissions relating to the jobs profile
of different places, with the areas at the top end of the scale characterised by
constituencies with large industry, manufacturing and aviation employers. There is
a considerable overlay between these constituencies and regions that were
identified in Onward’s Repairing our Social Fabric and Levelling Up research as
particularly at need of social regeneration and economic development. The two
main agendas of this Government, the net zero transition and levelling up the
Getting to zero 24regions, have a risk of clashing, as the very regions that need levelling up are also
the regions that face huge change during the net zero transition. The
constituencies at the other end of the scale tend to be more metropolitan, well off
and rooted in the service economy. This speaks to the political importance of
retraining and upskilling workers who stand to lose out from the transition to a net
zero economy.
The effects of the transition will not be uniform, and especially low skilled workers in higher
emitting sectors will need support to keep their place in the labour market or to move on to the
opportunities that will undoubtedly arise in the years ahead. That many of these places were
worst hit from the deindustrialisation of the 1980s and 1990s reinforces this problem. The
second paper of the Getting to zero programme will explicitly consider this question, and
propose policies that can improve the human capital stock of workers whose jobs may be
about to be lost and ensure they have a bright future in a green economy.
Getting to zero 25Figure 12: Index of high emitting jobs, by constituency Getting to zero 26
Table 1: Top and bottom 10 constituencies by high emitting jobs

Top 10 constituencies by high emitting jobs                           Bottom 10 constituencies by high emitting jobs

                                       Employment                                                   Employment
Constituency                            emissions     Party              Constituency                emissions         Party
                                         score                                                        score

Houghton & Sunderland South               100.0        Lab          Poplar and Limehouse                0.0            Lab
Brentford and Isleworth                    79.1        Lab        Islington South and Finsbury          1.4            Lab
West Bromwich West                         77.4        Con      Cities of London & Westminster          2.4            Con
Lanark & Hamilton East                     68.5        SNP         Altrincham and Sale West             5.0            Con
Leeds West                                 58.1        Lab       Hackney South & Shoreditch             5.9            Lab
Runnymede & Weybridge                      53.1        Con                  Watford                     6.5            Con
Stockport                                  52.4        Lab          Edinburgh South West                6.6            SNP
Warwick & Leamington                       52.3        Lab           North East Hampshire               6.9            Con
Morecambe & Lunesdale                      52.1        Con              Richmond Park                   7.0             LD

Crawley                                    50.4        Con          Old Bexley and Sidcup                7.1           Con

            Figure 13: Index of high emitting jobs by constituency
            Source: Business Register and Employment Survey; ONS; Onward analysis

            Getting to zero                                                                                    27
• Looking at another measure of carbon intensity, we measure the transport
emissions per capita in each Local Authority and then rank them on a scale of 1-
100 to create a comparable index. As figure 12 and Table 2 display, there is
considerable overlay between the areas across the country which rely on high
emitting jobs, and those that have high transport emissions.
• In both indexes, urban areas have the lowest reliance on high emitting jobs and
transport. Notable examples are Islington and Hackney, both of which are areas in
the bottom ten for both high emitting employment and transport emissions. This is
likely due to the high reliance on the service economy over a production economy
and superior public transport links in dense urban areas like London.
• The top ten areas are mostly in road-reliant industrial and commuter belts outside
major cities, such as South Northamptonshire, Daventry and North Warwickshire.
Outliers in the data are Central Business Districts (CBDs) such as the City of
London, which has one of the highest Transport Emissions scores in the country.
Table 2: Top and bottom 10 constituencies by transport emission score
Top 10 Local Authorities by Transport Emissions Bottom 10 Local Authorities by Transport Emissions
score score
Transport Emissions Transport Emissions
LA LA
score score
North Warwickshire 100.0 Islington 0.0
Eden 91.0 Hackney 0.4
Daventry 60.7 Harrow 0.5
South Northamptonshire 60.6 Camden 0.5
Uttlesford 56.7 Barrow-in-Furness 0.8
City of London 46.2 Haringey 1.2
Epping Forest 45.8 Brent 1.7
North West Leicestershire 44.9 Southwark 1.8
Hambleton 44.2 Wandsworth 1.8
West Berkshire 44.1 Merton 1.9
Getting to zero 283. The more rural a constituency, the more disruption its local economy is likely to
face over the transition to net zero.
• Looking at the urbanity of different constituencies we can see the effects based
on whether places are primarily based around a City, Town or Rural. This is
measured by where the majority of the constituency’s population resides and we
have assumed for this purpose that a village is ‘Rural’. Cross referencing this by
jobs related emissions, we find some interesting patterns.
• City constituencies are twice as likely to be in the bottom decile of areas for high
emitting jobs (least reliant on emissions) than in the top decile. 16 out of the 63
constituencies in the most emitting decile are city constituencies. Whereas, 35 out
of the constituencies in the least emitting decile have the majority of inhabitants
residing in a city.
• A similar but opposite pattern is seen with rural constituencies. There is just one
rural constituency in the decile with the lowest jobs emissions decile (Calder
Valley). In contrast, there are 14 rural constituencies in the highest decile.
• As the chart below displays, town and rural constituencies have a higher
concentration of jobs in high emitting industries than their urban counterparts.
This presents a further elision of priorities for this Government, who have
repeatedly made clear their desire to shift policy away from cities towards more
provincial areas.
Getting to zero 29Figure 14: High emitting jobs by constituency and urbanity, decile analysis. * 1= Lowest decile for high emitting jobs, 10= Highest decile for high emitting jobs Getting to zero 30
The third paper of the Getting to zero programme will consider the issue of innovation, and
 how the Government can create the regulatory, institutional and financial conditions for new
 products and technologies to emerge to support the net zero transition. This will include both
 domestic policies and international ambitions ahead of COP26, and also seek to consider the
 spread of environmental innovation to ensure that all parts of the UK - urban and rural, North
 and South, town and city - are contributing to the generational challenge we face.

4. The political challenge of delivering net zero is a challenge all parties must face up
to
   •   Given the new political map following the 2019 election, with many traditional
       Labour seats in Wales, the Midlands, and the North of England falling to the
       Conservatives, the gap between the jobs emissions profile of constituencies by
       party is not as large as it once would have been. All parties thus have an interest
       in ensuring that those people and places who may be adversely affected by
       decarbonisation are helped appropriately as we make the transition.

   •   55% of Conservative seats are in the bottom half of constituencies in our jobs
       emissions index. This compares to 44% of Labour seats and only 28% of SNP
       seats. This means that nearly three quarters (72%) of SNP’s constituencies are in
       the top half of the index, and more than half (56%) of Labour constituencies are.

   •   Looking closer, Labour has the highest proportion of seats (12%) in the lowest
       decile of seats by high emitting jobs. On analysis, these seats are mostly Labour’s
       metropolitan, liberal, wealthier base such as Islington South and Finsbury,
       Hackney South and Shoreditch, and Leeds North East. On the other end of the
       scale, SNP have nearly double (17%) the proportion of constituencies in the top
       decile than Labour and the Conservatives.

   •   This suggests that the policy framework of the past few decades, whereby policy
       was focused on behavioural taxes that disproportionately burdened regional
       businesses or subsidy regimes that were advantageous to some areas over
       others, will no longer be effective. Ministers and Shadow Ministers will need to
       consider how to best balance the costs of decarbonisation as well as the benefits.
       It is a problem that all parties face.

Getting to zero                                                                            31
Figure 15: Jobs Emissions Index, by constituency and party
Source: Business Register and Employment Survey; ONS; Onward analysis
20%
18%
16%
% of seats in each decile
14%
12%
10%
8%
6%
4%
2%
0%
1 2 3 4 5 6 7 8 9 10
Conservative 9% 11% 10% 12% 12% 10% 8% 8% 9% 10%
Labour 12% 8% 11% 6% 7% 8% 11% 15% 11% 9%
SNP 4% 4% 4% 8% 8% 15% 19% 10% 10% 17%
Deciles
Conservative Labour SNP
Getting to zero 32Conclusion Getting to zero 33
The UN Climate Conference in Glasgow, COP26, is under a year away. We cannot afford
it to pass with little more than warm words and no action. Nor can the UK waste the
opportunity it has to lead the world on the defining policy challenge of this generation.
The challenge we have now set in statute is considerable on a global and national scale.
We have set the target; we now need the plan.

The Getting to zero programme will over the next year set out a blueprint for
decarbonisation that works for, not against, people and places who have lost out in the
past, and who - if we are not careful - will lose out again. We will no doubt uncover
uncomfortable truths and obstacles to be overcome. But the point is that only by going
into this challenge with our eyes open and a clear appreciation of who stands to gain and
who stands to lose, will policymakers be able to bring people, businesses and other
countries with them in saving the environment.

We are delighted to be led by an expert steering group who collectively bring decades of
experience in climate policy and - most importantly - a practical appreciation of what
needs to be done. We look forward to engaging with you as we run up to COP26.

Getting to zero                                                                        34
Our Steering
                Group

Getting to zero              35
Dame Caroline Spelman Rt Hon Caroline Flint
Co-Chair & Former Secretary of State for Environment, Co-Chair & Former Shadow Secretary of State for Energy
Food and Rural Affairs and Climate Change
Guy Newey Melanie Onn Sam Hall
Strategy and Performance Director, Deputy Chief Exec RenewableUK, Director, Conservative Environment
Energy Systems Catapult formerly MP for Grimsby Network
Ben Caldecott
Michelle You Daniel Hale
Director, Oxford Sustainable Finance Campaigns Director, Purpose PBC
Programme, Smith School, University Venture Partner, LocalGlobe, co-
of Oxford founder of SongKick
Joss Garman Richard Howard
UK Programme Director, European Ruth Edwards MP Research Director, Aurora Energy
Climate Foundation Member of Parliament for Rushcliffe Research Ltd.
Will Tanner
Director of Onward
Getting to zero 36Endnotes Getting to zero 37
1
  Carbon Brief
2
  Media and Climate Change Observatory (2020), “Fossil fuels face a precarious future”,
MeCC) Monthly summaries issue 46.
3
  Onward, Generation Why?, 2019.
4
  David Sheppard (2020), “Flat carbon output in 2019 raises hope that emissions have
peaked”, Financial Times.
5
  EIA (2020), “U.S. energy facts explained”. Eurostat Statistics Explained (2020),”Energy
statistics- an overview”.
6
   Dieter Helm, 2020.
7
   World in Data; Onward analysis.
8
   Dieter Helm; International Organisation of Motor Vehicle Manufacturers, ‘2018
Production Statistics’.
9
   IEA (2020)”World coal consumption, 1978-2019”
10
    IEA (2020)”World coal consumption, 1978-2019”
11
   CAIT Climate Data Explorer; Our World in data
12
    ONS
13
    Committee on Climate Change (2020), “Reducing UK emissions, progress report to
Parliament”.
14
    World Bank national accounts data, and OECD National Accounts data files.
15
    Digest of UK Energy Statistics (DUKES): renewable sources of energy
16
    Department for Transport, Cars (VEH02)
17
    Climate Analytics
18
    Our World in Data
19
    Hardt and Foxon (2018), “Untangling the drivers of energy reduction in the UK
productivity sectors; efficiency or offshoring?”
20
     CAIT Climate Data Explorer; Our World in data
21
     Committee on Climate Change (2019), “Reducing UK emissions, 2019 report to
Parliament”
22
     The International Council on Clean Transportation (2018), C02 emissions from
commercial aviation”
23
     Bank of England (2020).”How has growth changed over time”.
24
     ONS, Regional gross value added (balanced) by industry: all NUTS level regions

Getting to zero                                                                         38
Support Onward Onward is an independent, not-for-profit thinktank. We rely on the generous support of individuals and trusts, as well as partnerships with charities and businesses, to support our leading programme of research and events. Individual and Trust donations Onward’s core programme of research is funded by individual and trust donations. If you are an individual or represent a philanthropic trust and would like to support our ongoing research agenda, we would love to hear from you. We do not accept corporate funding for research reports.Please contact us on office@ukonward.com if you would like to donate by cheque or you can donate electronically using Onward’s account details below. UK Onward Thinktank Ltd Not-for-profit company no. 11326052 Bank: Natwest Account number: 21328412 Sort code: 50–10–05 Please note that Onward retains copyright and full editorial control over any written research it produces, irrespective of funding. Partnerships with companies and charities Alongside our research, we want to work closely with charities, trusts and businesses, large and small, to further the political debate and bring the expertise and ideas from outside government to bear on the policymaking process. If you would like to partner with Onward as a sponsor of one of our roundtable events or conferences, or to join our Business Leaders Network to engage further with our work, please get in touch at office@ukonward.com. A commitment to transparency Onward is committed to transparency and will publish the names of individuals and organisations who give us more than £5,000 of support each year. This is published on our website twice a year.
ww.ukonward.com
You can also read